


Abstract
There is increasing evidence that intrauterine lipid metabolism influences the adiposity of the newborn and the first years thereafter. It remains unclear if these effects persist when these children grow older.
This study examined the associations between maternal lipid blood levels during the 13th week of pregnancy and an offspring’s adiposity, measured at age 11-12, and if these associations were moderated by the child’s sex.
Data were obtained from a community-based birth cohort, the Amsterdam Born Children and their Development (ABCD) study. At a median of 13 weeks’ gestation, nonfasting blood samples of triglycerides (TGs), total cholesterol (TC), free fatty acids (FFAs), and apolipoprotein B/apolipoprotein A1 ratio (ApoB/ApoA1) were measured. An offspring’s body mass index (BMI), subcutaneous fat (SCF), waist-to-height-ratio (WHtR), and fat percentage (fat%) were measured at age 11-12. Mothers with at-term born children were included (n = 1853). Multivariable linear regression analyses were performed to assess the associations between maternal lipids and each offspring’s adiposity outcome separately. Sex differences were additionally evaluated.
TGs, TC, ApoB/ApoA1, and FFAs were significantly positively associated with BMI, WHtR, and fat% (adjusted for gestational age at blood sampling, child’s age, sex, and sexual maturation). After additional adjustments for potential confounders and covariates, only TGs remained significantly associated with WHtR (0.45, 95% CI –0.007; 0.91). There were no associations between maternal lipids and SCF and no clear sex-specific results were found.
Overall, our results do not strongly support that maternal lipid profile during the 13th week of pregnancy has programming effects on adiposity in preadolescence.
The worldwide prevalence of obesity in children and adolescents has increased in the last decades to 5.6% in girls and 7.8% in boys in 2016, and this trend is likely to continue (1). Childhood obesity is associated with adverse effects throughout adulthood, including cardiovascular diseases, type 2 diabetes and asthma, and psychological effects, like low social acceptability, depression and low body image (2-4).
Obesity is a multifactorial disease (5). The Developmental Origins of Health and Diseases hypothesis postulates that the obesity risk is already expressed during pregnancy, in other words the fetus responds to alterations in the intrauterine metabolic environment (6). Maternal triglycerides (TGs) cross the placenta as free fatty acids (FFAs), which are passed to the fetus (7, 8). These FFAs may be an energy source for the fetus, by promoting intrahepatic lipid storage and mesenchymal stem cell differentiation into adipocytes (9), and could finally lead to adiposity of the newborn (7, 8, 10-12). However, whether maternal antepartum lipids are associated with preadolescents’ adiposity remains largely unknown. Exploring this association is important because nutritional status in pregnancy is modifiable, and improving this during pregnancy might be a good starting point to prevent adiposity and its adverse effects (13).
Few studies have examined the associations between maternal lipids and early childhood adiposity. A prospective study in The Netherlands, using data of the Amsterdam Born Children and their Development (ABCD) study, showed that maternal FFAs in early pregnancy were positively associated with body fat percentage (fat%), body mass index (BMI), and risk for overweight at age 5-6; and maternal TGs with waist-to-height ratio (WHtR), and apolipoprotein B (ApoB), and total cholesterol (TC) with body fat% (14). Moreover, prospective studies, conducted in the United States and Greece, illustrated positive associations between maternal TGs and BMI, and between maternal TCs and risk of overweight and skinfold thickness at age 3-4 (15, 16). However, other studies did not report associations between maternal lipids and an offspring’s adiposity at age 2-7 (17-19).
There is increasing interest in placental differences between boys and girls and their responses to the intrauterine environment. Animal studies have found that female and male fetuses have differences in placental metabolism, epigenetics, and growth strategies, causing differential survival outcomes (20). Some prospective studies have observed stronger associations in girls, for example on adiposity, growth patterns, and lipids (21-23). Other prospective studies reported that boys were more vulnerable to intrauterine factors (24, 25). It is not clear whether the association of maternal lipids in pregnancy with an offspring’s adiposity in early childhood is still present in preadolescence, and whether this link is moderated by the child’s sex (14-16). The aim of this study was to examine the associations between maternal lipid blood levels during early pregnancy and adiposity outcomes in the offspring, measured at age 11-12 years in the ABCD cohort, and if these associations are moderated by the child’s sex.
Materials and Methods
Study Design and Population
The study population is part of the ABCD study, a multi-ethnic birth cohort in The Netherlands focusing on maternal factors during pregnancy influencing an offspring’s health (26). Between January 2003 and March 2004 all pregnant women in Amsterdam (n = 12 373) were invited for participation at their first pregnancy check-up at median 13 weeks’ gestation (interquartile range [IQR] 12-14). They were asked to fill out a pregnancy questionnaire and to participate in the ABCD biomarker study. Of these 12 373 women, 8266 filled out the pregnancy questionnaire at 16 weeks’ gestation (IQR 14-18) and 4389 also participated in the ABCD biomarker study, in which a blood sample was taken at the first pregnancy check-up (n = 4389). Exclusion criteria were mothers using lipid-altering medication or having pre-existing diabetes, congenital malformations of the child, and preterm birth (<37 weeks). This left 3833 eligible mothers for our study. Loss to follow-up and missing data on maternal lipids, gestational age at blood sampling, and adiposity outcomes of the child resulted in a total of 1853 mothers of singleton children who were included in the analysis. The included group had data on at least 1 lipid and 1 adiposity outcome (Fig. 1).
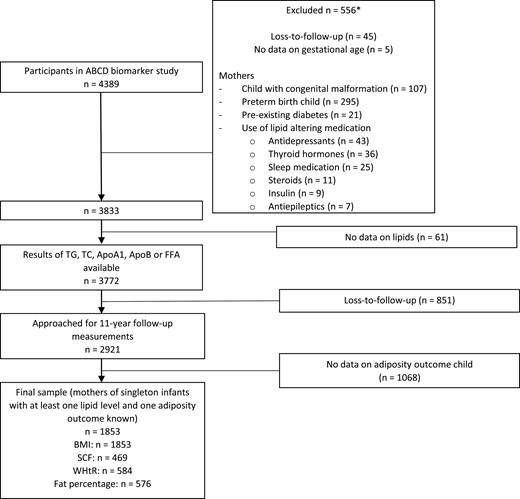
Study flow. *Sometimes more than 1 exclusion criterion per mother or child was present, so numbers count up to more than 556. TG, triglyceride; TC, total cholesterol; ApoA1, apolipoprotein A1; ApoB, apolipoprotein; FFA, free fatty acids; BMI, body mass index; SCF, subcutaneous fat; WHtR, waist-to-height ratio.
When the offspring reached the age of 11, a questionnaire was filled out by the participating women. Also, a health check, which included anthropometric and body composition measurements, was conducted in a randomly selected group of children (n = 1082) at their primary school or at a central location. Of these children, 589 had data on at least 1 adiposity outcome. BMI was obtained from the health check (n = 583) or Youth Health Care Registration (YHCR, n = 1270). The study protocol was approved by the medical ethics committee of the Amsterdam University Medical Centre and the Registration Committee of the Municipality of Amsterdam. All mothers and children gave written informed consent, including permission for perusal of their medical pregnancy files.
Data Collection in Mothers
Maternal lipid levels
Lipid levels were determined with nonfasting blood sampling at a median of 13 weeks’ gestation (IQR 12-14 weeks). Serum was prepared by taking a blood sample in a 9-mL vacuette for each participant (Greiner BV, Alphen aan den Rijn, The Netherlands) (14). Lipid levels in the blood sample were analyzed in the Laboratory for Toxicology, Pathology, and Genetics of the Dutch Institute for Public Health and the Environment (14). TG was measured with the glycerol-3-phosphate oxidase PAP method and TC with the cholesterol oxidase PAP method on a Hitachi 912 analyzer (Roche Diagnostics, Mannheim, Germany). Apolipoprotein A1 (ApoA1), ApoB, and FFA were assessed with an Abbot Architect CI 8200 (Abbott Laboratories, Ltd, Saint-Laurent, Quebec, Canada). ApoA1 and ApoB were measured with a turbidimetric technique and FFA with enzymatic and spectrophotometry/colorimetry combined (reagent by Wako Pure Chemical Industries Ltd, Osaka, Japan). The ratio of ApoB/ApoA1 was calculated, because this reliably predicts cardiovascular disease (27). The interassay coefficients of variation for TGs, TC, ApoA1, ApoB, and FFAs were, respectively, 2.3%, 1.0%, 1.6%, 1.6%, and 3.4% (14).
Additional measurements in mothers
Maternal education (years of education after primary school), maternal ethnicity (Dutch, other Western, non-Western), maternal age (years), and smoking and alcohol consumption during pregnancy (yes/no) and prepregnancy BMI (pBMI) were based on the self-report pregnancy questionnaire. Maternal education level represented the socioeconomic status, and ethnicity was based on the grandmother’s country of birth. pBMI was supplemented with pregnancy files, gestational diabetes (yes/no) with information from Dutch Perinatal Registration, and parity (primiparous: yes/no) was obtained from the Dutch Perinatal Registration and YHCR. We calculated pBMI as prepregnancy weight in kilograms divided by height in meters squared.
Data Collection in Children
Child adiposity measures
Adiposity measurements in the children were performed by trained research assistants at the health check at age 11-12 (14). Data on height and weight were obtained from the health check or YHCR. If height and weight were available from the health check and from the YHCR, the measurement of the ABCD health check was chosen. A Leicester portable height measure (Seca, Hamburg, Germany) was used to measure height to the nearest millimeter. Weight was measured to the nearest 100 g with a Marsden Ms-4102 weighing scale (Oxfordshire, UK). Subsequently, BMI was calculated by dividing the child’s weight in kilograms by their height in meters squared. Three experienced ultrasound technicians measured subcutaneous fat (SCF) with the plaque protocol setting of the automated ultrasound Panasonic Cardio Health Station V1.8 (Diagnostic Ultrasound System GM-72P00A). SCF was measured as the transversal edge to edge distance between the skin and the linea alba, just above the belly button. A Seca measuring tape was used to determine waist circumference to the nearest millimeter in the middle between the costal margin and the iliac crest. After this, the WHtR was calculated and multiplied by 100 (28). Arm-to-leg bioelectrical impedance analysis (Bodystat 1500 MDD machine (Bodystat Inc, Douglas, UK)) was performed to determine fat mass. Next, fat% was calculated (29).
Additional measurements in children
The following covariates at age 11-12 were measured: age, sexual maturation, physical activity, screen time, and diet. Sexual maturation was based on 5 questions about Tanner stages and reported by the mother (30). These questions related to growth spurt, skin changes, voice breaking (boys), and breast growth (girls). Answering options were 1 = not started, 2 = just started, 3 = clearly started, and 4 = seems to be over, and a total sumscore was calculated. This sumscore was classified into not yet in puberty, beginning of puberty, and already in puberty (31). Physical activity was based on the following question filled in by the child: “Do you practice sport? If yes, how many hours in a week do you practice it (including training and matches)?” This resulted in a definition of physical activity as a metabolic equivalent score per week for children in line with the World Health Organization method (32). Mothers recorded the TV and computer time of their children on week and weekend days. Mean screen hours/day were calculated, with a possible range of 0 to 5.5 (33). Diet intake was determined from 4 food groups reported by the child: fruits, vegetables, snacks, and sugar-sweetened beverages. For each food group, the average intake per day was calculated and divided into quartiles, rated 1 to 4. A dietary intake score was computed, ranging from 4 (unhealthy) to 16 (healthy). The total duration of exclusive breastfeeding (continuous) was obtained from the 3-month and 5-year questionnaire and the YHCR (34). Birth weight was derived from the Dutch Perinatal Registration and YHCR.
Statistical Analysis
Analyses were performed with IBM SPSS version 26. Nonresponse analyses were conducted by comparing baseline characteristics of included mothers (n = 1853) with those of eligible mothers who participated in the biomarker study but were lost to follow-up (n = 1980). The independent samples t-test was used to compare normally distributed continuous characteristics and the chi-squared test was applied for categorical characteristics. One-way analysis of variance, followed by the post hoc Tukey test, was performed to compare the mean lipid levels and adiposity values by subject characteristics. Multivariable linear regression analyses were done to evaluate the associations between maternal lipids and each adiposity outcome separately, including interaction analysis to determine sex-specific effects. Potential confounders related to the studied associations were selected based on literature (14-19) and graphically depicted in a directed acyclic graph (DAG) (35). The DAG was build using DAGitty (http://www.dagitty.net/dags.html, Figure S1 (35)). Model 1 was adjusted for gestational age at blood sampling, child’s age, sex, and sexual maturation. In model 2, additional adjustments were made for potential maternal confounders: pBMI, maternal education, maternal ethnicity, gestational diabetes, parity, age, and smoking and alcohol consumption during pregnancy; and child covariates: physical activity, screen time, diet, birth weight, and duration of exclusive breastfeeding. For model 3, a backward linear regression analysis was performed, starting with the variables that were significantly associated with the relevant maternal lipid and/or adiposity outcome (Tables 1 and 2), followed by stepwise elimination of variables with P > .05. The interaction term between maternal lipids and sex was added to model 2. If the interaction term was significant (P < .1), sex-stratified analysis was performed. Multiple imputation with 25 sets was performed in all models, because there were more than 10% missing data on covariates sexual maturation, diet, physical activity, and screen time (Tables 1 and 2).
Maternal and child characteristics by maternal lipids
| Maternal lipids | |||||
|---|---|---|---|---|---|
| All | TG (mmol/L) | TC(mmol/L) | ApoB/ApoA1 | FFA (mmol/L) | |
| n (%) | Mean (SD) | Mean (SD) | Mean (SD) | Mean (SD) | |
| Maternal characteristics | |||||
| n | 1853 (100) | ||||
| Maternal age (years) | |||||
| <25 | 177 (9.6) | 1.62 (0.78)c | 5.31 (1.13) | 0.56 (0.15)c | 0.33 (0.17) |
| 25-35 (reference) | 1329 (71.7) | 1.41 (0.67) | 5.12 (1.10) | 0.48 (0.14) | 0.31 (0.18) |
| >35 | 347 (18.7) | 1.51 (0.61)a | 5.29 (1.02)a | 0.49 (0.13) | 0.36 (0.19)c |
| Ethnicity (%), missing n = 2 | |||||
| Dutch (reference) | 1153 (62.2) | 1.35 (0.59) | 5.10 (1.00) | 0.47 (0.13) | 0.31 (0.17) |
| Other Western | 229 (12.4) | 1.48 (0.62)a | 5.28 (1.24) | 0.47 (0.13) | 0.32 (0.18) |
| Non-Western | 469 (25.3) | 1.68 (0.82)c | 5.29 (1.20)b | 0.54 (0.16)c | 0.37 (0.20)c |
| Education (years), missing n = 10 | |||||
| 0-5 | 298 (16.1) | 1.68 (0.77)c | 5.38 (1.25)c | 0.54 (0.16)c | 0.37 (0.19)c |
| 6-10 | 668 (36.0) | 1.49 (0.73)c | 5.18 (1.08) | 0.50 (0.14)c | 0.33 (0.18)a |
| >10 (reference) | 877 (47.3) | 1.33 (0.55) | 5.07 (1.01) | 0.46 (0.13) | 0.30 (0.17) |
| Smoking during pregnancy | |||||
| No | 1682 (90.8) | 1.43 (0.65) | 5.15 (1.08) | 0.48 (0.14) | 0.32 (0.18) |
| Yes | 171 (9.2) | 1.64 (0.82)c | 5.33 (1.18)a | 0.53 (0.17)c | 0.35 (0.21) |
| Alcohol during pregnancy | |||||
| No | 1357 (73.2) | 1.49 (0.70) | 5.18 (1.11) | 0.50 (0.15) | 0.33 (0.18) |
| Yes | 496 (26.8) | 1.34 (0.59)c | 5.13 (1.02) | 0.46 (0.12)c | 0.31 (0.17) |
| Primiparous (%) | |||||
| Yes | 1008 (54.4) | 1.40 (0.64) | 5.18 (1.08) | 0.48 (0.14) | 0.30 (0.17) |
| No | 845 (45.6) | 1.52 (0.70)c | 5.16 (1.11) | 0.50 (0.14)b | 0.35 (0.18)c |
| Gestational diabetes | |||||
| No | 1831 (98.8) | 1.44 (0.65) | 5.17 (1.09) | 0.49 (0.14) | 0.32 (0.17) |
| Yes | 22 (1.2) | 2.36 (1.38)c | 5.49 (1.35) | 0.57 (0.17)a | 0.47 (0.40)c |
| pBMI (kg/m2) | |||||
| <18.5 | 75 (4.0) | 1.26 (0.49) | 4.84 (0.88) | 0.46 (0.11) | 0.31 (0.18) |
| 18.5-24.9 (reference) | 1367 (73.8) | 1.40 (0.65) | 5.14 (1.09) | 0.48 (0.14) | 0.31 (0.16) |
| 25-29.9 | 306 (16.5) | 1.60 (0.77)c | 5.29 (1.07) | 0.52 (0.14)c | 0.36 (0.20)c |
| ≥30 | 105 (5.7) | 1.77 (0.68)c | 5.47 (1.18)a | 0.56 (0.16)c | 0.46 (0.28)c |
| Child characteristics | |||||
| Sex | |||||
| Boy | 877 (47.3) | 1.41 (0.61) | 5.10 (1.05) | 0.48 (0.14) | 0.32 (0.18) |
| Girl | 976 (52.7) | 1.48 (0.72)a | 5.23 (1.12)a | 0.49 (0.14) | 0.33 (0.18) |
| Birth weight (g), missing n = 8 | |||||
| <2500 | 31 (1.7) | 1.33 (0.55) | 4.79 (0.84) | 0.46 (0.14) | 0.32 (0.19) |
| 2500-4500 (reference) | 1758 (94.9) | 1.45 (0.67) | 5.17 (1.09) | 0.49 (0.14) | 0.32 (0.18) |
| >4500 | 56 (3.0) | 1.55 (0.64) | 5.21 (1.16) | 0.53 (0.17) | 0.29 (0.15) |
| Breastfeeding (months), missing n = 39 | |||||
| No breastfeeding | 279 (15.1) | 1.42 (0.62) | 5.21 (1.02) | 0.49 (0.13) | 0.36 (0.24)b |
| < 1 month | 132 (7.1) | 1.60 (0.84) | 5.21 (1.14) | 0.51 (0.16) | 0.35 (0.17) |
| 1-3 months | 529 (28.5) | 1.44 (0.65) | 5.23 (1.11) | 0.50 (0.14) | 0.32 (0.16) |
| >3 months (reference) | 874 (47.2) | 1.45 (0.68) | 5.11 (1.09) | 0.48 (0.14) | 0.31 (0.17) |
| Age at follow-up (years) | |||||
| <11 | 1026 (55.4) | 1.49 (0.68) | 5.20 (1.07) | 0.49 (0.14) | 0.32 (0.18) |
| ≥11 | 827 (44.6) | 1.40 (0.66)b | 5.14 (1.12) | 0.48 (0.14)a | 0.33 (0.18) |
| Tanner stage, missing n = 717 | |||||
| <6 (not yet in puberty) | 227 (12.3) | 1.28 (0.53) | 4.93 (1.01) | 0.45 (0.12)a | 0.30 (0.16) |
| 6-10 (begin of puberty) (reference) | 663 (35.8) | 1.36 (0.58) | 5.08 (0.97) | 0.47 (0.14) | 0.31 (0.17) |
| >10 (already in puberty) | 246 (13.3) | 1.51 (0.79)b | 5.31 (1.21)a | 0.49 (0.14) | 0.33 (0.17) |
| Dietary intake score (%), missing n = 827 | |||||
| 4-7 | 231 (12.5) | 1.43 (0.64) | 5.09 (1.16) | 0.48 (0.15) | 0.31 (0.16) |
| 8-12 (reference) | 706 (38.1) | 1.36 (0.63) | 5.11 (1.03) | 0.47 (0.13) | 0.32 (0.17) |
| 13-16 | 89 (4.8) | 1.38 (0.68) | 4.90 (1.00) | 0.45 (0.13) | 0.32 (0.18) |
| Physical activity (METS/week), missing n = 818 | |||||
| <35 | 634 (34.2) | 1.41 (0.65) | 5.17 (1.05) | 0.48 (0.14) | 0.32 (0.17) |
| ≥35 | 401 (21.6) | 1.25 (0.54)c | 4.94 (1.00)b | 0.46 (0.12) | 0.31 (0.16) |
| Screen time (hours/day), missing n = 728 | |||||
| <2 | 597 (32.2) | 1.37 (0.60) | 5.10 (1.05) | 0.46 (0.13) | 0.31 (0.16) |
| ≥2 | 528 (28.5) | 1.39 (0.66) | 5.10 (1.03) | 0.48 (0.14)a | 0.32 (0.17) |
TG, TC, ApoA1, ApoB, and FFA levels were standardized at median gestational age at blood sampling (13 weeks) (54).
Abbreviations: ApoA1, apolipoprotein A1; ApoB, apolipoprotein B; FFA, free fatty acids; METS, metabolic equivalent score; pBMI, prepregnancy body mass index; SD, standard deviation; TC, total cholesterol; TG, triglyceride.
aP < .05.
bP < .01.
cP < .001.
Maternal and child characteristics by adiposity outcomes
| Adiposity measures | |||||
|---|---|---|---|---|---|
| All | BMI (kg/m2) | SCF | WHtR | Fat% | |
| n (%) | Mean (SD) | Mean (SD) | Mean (SD) | Mean (SD) | |
| Maternal characteristics | |||||
| n | 1853 (100) | ||||
| Maternal age (years) | |||||
| <25 | 177 (9.6) | 18.7 (3.4)c | 13.2 (7.9)c | 43.6 (5.2)b | 26.8 (7.2)a |
| 25-35 (reference) | 1329 (71.7) | 17.4 (2.6) | 7.2 (4.4) | 40.4 (3.3) | 22.8 (5.5) |
| >35 | 347 (18.7) | 17.8 (2.9) | 7.0 (4.0) | 40.6 (4.1) | 23.3 (5.7) |
| Ethnicity (%), missing n = 2 | |||||
| Dutch (reference) | 1153 (62.2) | 17.1 (2.3) | 7.0 (4.3) | 40.3 (3.1) | 22.5 (5.4) |
| Other Western | 229 (12.4) | 17.2 (2.2) | 7.0 (4.2) | 40.2 (3.3) | 22.7 (4.7) |
| Non-Western | 469 (25.3) | 19.1 (3.5)c | 10.8 (6.2)c | 42.4 (5.6)c | 26.8 (6.4)c |
| Education (years), missing n = 10 | |||||
| 0-5 | 298 (16.1) | 19.0 (3.7)c | 8.5 (6.2) | 42.6 (5.5)c | 26.3 (6.5)c |
| 6-10 | 668 (36.0) | 17.8 (2.9)c | 8.5 (5.2)c | 40.9 (3.9)a | 23.9 (6.1)b |
| >10 (reference) | 877 (47.3) | 17.0 (2.0) | 6.5 (3.8) | 40.1 (2.9) | 22.1 (5.0) |
| Smoking during pregnancy (%) | |||||
| No | 1682 (90.8) | 17.5 (2.7) | 7.1 (4.4) | 40.5 (3.6) | 22.9 (5.6) |
| Yes | 171 (9.2) | 18.6 (3.3)c | 11.0 (5.2)c | 41.8 (4.2)a | 24.6 (5.3) |
| Alcohol during pregnancy (%) | |||||
| No | 1357 (73.2) | 17.8 (3.0) | 7.6 (4.9) | 40.9 (3.9) | 23.4 (5.9) |
| Yes | 496 (26.8) | 17.1 (2.1)c | 6.6 (3.6)a | 39.9 (3.0)b | 22.4 (4.8)a |
| Primiparous (%) | |||||
| Yes | 1008 (54.4) | 17.4 (2.7) | 7.1 (4.5) | 40.4 (3.3) | 22.5 (5.3) |
| No | 845 (45.6) | 17.8 (2.9)b | 7.6 (4.5) | 40.8 (4.0) | 23.8 (5.9)b |
| Gestational diabetes (%) | |||||
| No | 1831 (98.8) | 17.6 (2.8) | 7.3(4.5) | 40.5 (3.6) | 23.0 (5.6) |
| Yes | 22 (1.2) | 19.8 (4.6)c | 5.3 (1.0) | 43.4 (5.1)a | 25.4 (8.9) |
| pBMI (kg/m2) | |||||
| <18.5 | 75 (4.0) | 16.3 (2.3)a | 8.5 (6.5) | 39.9 (2.7) | 22.3 (6.1) |
| 18.5-24.9 (reference) | 1367 (73.8) | 17.1 (2.3) | 6.9 (4.2) | 40.1 (3.2) | 22.4 (5.1) |
| 25-29.9 | 306 (16.5) | 19.0 (3.1)c | 8.1 (4.4) | 41.6 (3.4)b | 24.1 (4.9) |
| ≥30 | 105 (5.7) | 21.0 (4.2)c | 12.9 (5.9)c | 45.6 (6.0)c | 31.2 (8.1)c |
| Child characteristics | |||||
| Sex | |||||
| Boy | 877 (47.3) | 1.41 (0.61) | 5.10 (1.05) | 0.48 (0.14) | 0.32 (0.18) |
| Girl | 976 (52.7) | 1.48 (0.72)a | 5.23 (1.12)a | 0.49 (0.14) | 0.33 (0.18) |
| Birth weight (g), missing n = 8 | |||||
| <2500 | 31 (1.7) | 17.5 (2.4) | 7.3 (4.1) | 40.9 (4.1) | 24.3 (5.5) |
| 2500-4500 (reference) | 1758 (94.9) | 17.6 (2.8) | 7.3 (4.5) | 40.5 (3.5) | 23.0 (5.6) |
| >4500 | 56 (3.0) | 17.8 (2.4) | 9.8 (7.8) | 41.5 (5.0) | 23.8 (6.5) |
| Breastfeeding (months), missing n = 39 | |||||
| No breastfeeding | 279 (15.1) | 18.1 (3.6)b | 8.2 (5.2) | 40.4 (3.4) | 23.6 (6.5) |
| <1 month | 132 (7.1) | 17.9 (3.4) | 10.7 (7.2)b | 41.4 (4.2) | 25.7 (5.5)a |
| 1-3 months | 529 (28.5) | 17.7 (2.8) | 7.1 (4.1) | 40.4 (3.3) | 22.6 (5.4) |
| >3 months (reference) | 874 (47.2) | 17.4 (2.6) | 6.9 (4.1) | 40.6 (3.7) | 22.8 (5.4) |
| Tanner stage (%), missing n = 717 | |||||
| <6 (not yet in puberty) | 227 (12.3) | 17.0 (2.2) | 6.2 (4.0) | 41.1 (3.2) | 20.4 (4.9)c |
| 6-10 (begin of puberty) (reference) | 663 (35.8) | 17.1 (2.4) | 7.2 (4.3) | 40.4 (3.7) | 23.3 (5.5) |
| >10 (already in puberty) | 246 (13.3) | 18.0 (2.6)c | 9.2 (5.5)b | 40.5 (3.9) | 25.4 (5.5)b |
| Dietary intake score (%), missing n = 827 | |||||
| 4-7 | 231 (12.5) | 17.0 (2.1) | 7.1 (3.4) | 40.0 (3.2) | 22.7 (5.7) |
| 8-12 (reference) | 706 (38.1) | 17.3 (2.5) | 7.4 (4.7) | 40.6 (3.7) | 23.0 (5.6) |
| 13-16 | 89 (4.8) | 17.6 (2.8) | 6.4 (4.0) | 40.4 (4.0) | 22.8 (5.7) |
| Physical activity (METS/week), missing n = 818 | |||||
| <35 | 634 (34.2) | 17.4 (2.7) | 7.8 (4.7) | 40.7 (3.9) | 23.7 (5.6) |
| ≥35 | 401 (21.6) | 17.0 (2.0)b | 6.1 (3.6)c | 40.1 (2.8) | 21.4 (4.8)c |
| Screen time (hours/day), missing n = 728 | |||||
| <2 | 597 (32.2) | 17.0 (2.3) | 6.8 (4.1) | 40.3 (3.6) | 22.6 (5.3) |
| ≥2 | 528 (28.5) | 17.6 (2.6)c | 8.1 (5.1)b | 40.8 (3.7) | 23.6 (6.0)a |
Abbreviations: BMI, body mass index; Fat%, fat percentage; METS, metabolic equivalent score; SCF, subcutaneous fat; pBMI, prepregnancy body mass index; WHtR, waist-to-height ratio;
aP < .05.
bP < .01.
cP < .001.
Results
Study Population
The 1853 included women were older, had a higher education level and BMI, were more often of Dutch origin, drank alcohol more often during pregnancy, and were more often multiparous than women who were eligible for our study and participated in the biomarker study but were lost to follow-up (n = 1980) (Table S1 (35)). The women in the present study had a mean (SD) age of 31.5 (4.8) years at a median of 16 weeks’ gestation, 62.2% were of Dutch origin, 54.4% were primiparous, and 22.2% were overweight or obese (Table 1). At follow-up, the mean (SD) age of the children was 11.0 (0.7) years and 47.3% of them were boys.
TG levels were higher in the oldest and youngest women, in women with a non-Dutch origin, who had low to moderate education, smoked during pregnancy, did not drink alcohol during pregnancy, were multiparous, and who had diabetes and a higher BMI (Table 1). TC levels were higher in women of older age, in women of non-Western origin, who had a lower education level, smoked during pregnancy, and were obese. The ApoB/ApoA1 ratio was higher in younger women, in women of non-Western origin, who had low to moderate education, smoked during pregnancy, did not drink during pregnancy, were multiparous, and who had gestational diabetes and a higher BMI. FFA levels were higher in women of older age, in women of non-Western origin, who had low to moderate education, were multiparous, and who had gestational diabetes and a higher BMI. The child’s BMI, SCF, WHtR, and fat% were higher if their mother was younger during pregnancy, was of non-Western origin, had low or moderate education, did not drink alcohol during pregnancy, and had a higher pBMI (Table 2). BMI, SCF, and fat% were higher in children who were less physically active, had more screen time, and were already in puberty. Mean (SD) BMI, SCF, WHtR, and fat% were 17.62 (2.79) kg/m2, 7.29 (4.53) mm, 40.54 (3.61), and 23.03% (5.62%), respectively. Girls had a higher fat%, lower WHtR, and more SCF than boys (Table 2).
Associations Between Maternal Lipids and Offspring’s Adiposity Outcomes
Maternal TG levels were associated with an offspring’s BMI (0.44, 95% Confidence interval (CI) 0.24; 0.63), fat% (1.00, 95% CI 0.29; 1.72), and WHtR (0.97, 95% CI 0.49; 1.46) in model 1 (Table 3). After adjustment for confounders and covariates (model 2), only TGs remained significantly associated with WHtR (0.45, 95% CI –0.007; 0.91) (Table 3). Maternal TC levels were also associated with the child’s BMI (0.17, 95% CI 0.05; 0.29), fat% (0.48, 95% CI 0.08; 0.88) and WHtR (0.34, 95% CI 0.06; 0.61) in model 1. These associations were rendered nonsignificant in model 2. The ApoB/ApoA1 ratio was associated with BMI (2.00, 95% CI 1.00; 3.00), fat% (5.38, 95% CI 2.21; 8.55), and WHtR (3.46, 95% CI 1.34; 5.59) in model 1. In model 2, these associations were no longer significant. In model 1, FFA levels were associated with BMI (1.91, 95% CI 1.13; 2.69), fat% (4.18, 95% CI 1.72; 6.62), and WHtR (2.70, 95% CI 0.91; 4.49). These associations did not remain significant in model 2 (Table 3). There were no significant associations between maternal lipids and SCF. The results of model 3 (adjustments based on backward elimination) did not differ from model 2 (Table S2 (35)). Most interaction terms between maternal lipids and the child’s sex, added to model 2, were nonsignificant; P values ranged from .24 to .96. The P value of the interaction term between FFA and sex was .10 in linear regression with WHtR (model 2). Sex-stratified analysis revealed an association between FFA and WHtR in boys (2.54, 95% CI 0.18; 4.91) but not in girls (0.000, 95% CI -2.42; 2.42).
Results of the multivariable linear regression analysis of the association between maternal lipids and child adiposity
| Outcome: child adiposity | |||||
|---|---|---|---|---|---|
| Maternal lipids | Model | BMI (kg/m2) β (95% CI) n = 1,853 | SCF β (95% CI) n = 469 | WHtR β (95% CI) n = 584 | Fat% β (95% CI) n = 576 |
| TG level (mmol/L) | |||||
| 1 | 0.44 (0.24; 0.63) | 0.51 (–0.20; 1.22) | 0.97 (0.49; 1.46) | 1.00 (0.29; 1.72) | |
| 2 | 0.02 (–0.16; 0.20) | 0.15 (–0.52; 0.83) | 0.45 (–0.007; 0.91) | 0.34 (–0.33; 1.00) | |
| TC level (mmol/L) | |||||
| 1 | 0.17 (0.05; 0.29) | 0.26 (–0.13; 0.65) | 0.34 (0.06; 0.61) | 0.48 (0.08; 0.88) | |
| 2 | 0.06 (–0.05; 0.16) | 0.26 (–0.11; 0.62) | 0.16 (–0.10; 0.41) | 0.27 (–0.10; 0.64) | |
| ApoB/ApoA1 ratio | |||||
| 1 | 2.00 (1.00; 3.00) | 2.55 (–0.71; 5.81) | 3.46 (1.34; 5.59) | 5.38 (2.21; 8.55) | |
| 2 | 0.03 (–0.89; 0.96) | –0.10 (–3.27; 3.07) | 0.36 (–1.72; 2.45) | 0.93 (–2.15; 4.00) | |
| FFA level (mmol/L) | |||||
| 1 | 1.91 (1.13–2.69) | 0.74 (–1.71; 3.19) | 2.70 (0.91; 4.49) | 4.18 (1.72; 6.62) | |
| 2 | 0.41 (–0.31; 1.13) | –0.94 (–3.25; 1.37) | 0.90 (–0.79; 2.58) | 1.15 (–1.14; 3.43) | |
Model 1: Adjusted for gestational age at blood sampling (54), child’s age, sex, and sexual maturation.
Model 2: Model 1 + pBMI, maternal education, ethnicity, gestational diabetes, parity, maternal age, smoking and alcohol during pregnancy, child’s physical activity, screen time, diet, birth weight, and duration of exclusive breastfeeding.
Abbreviations: ApoA1, apolipoprotein A1; ApoB, apolipoprotein B; BMI, body mass index; Fat%, fat percentage; FFA, free fatty acid; SCF, subcutaneous fat; TC, total cholesterol; TG, triglyceride; WHtR, waist-to-height ratio.
Values in bold represent a significant association (P < .05) between the relevant maternal lipid and adiposity outcome.
Discussion
In this study, strong positive associations between all maternal antepartum lipids and preadolescents’ BMI, WHtR, and fat% were present. However, adjustment for confounders rendered most associations nonsignificant, except for the association between TG and WHtR. Moreover, our results did not provide convincing evidence for sex-specific associations.
Previous research on the association between maternal antepartum lipids and offspring adiposity reported inconsistent results. While some studies found a significant positive association between maternal lipids and an offspring’s adiposity at age 3-6 (14-16, 36), our results are in line with 2 studies with large sample sizes (n = 1153 and n = 819), demonstrating no association of maternal lipids with an offspring’s adiposity at ages 6 and 7 (18, 19). Both studies measured several adiposity outcomes and corrected for multiple relevant variables, which makes them similar to our study. Only 1 study focused on 12-year-old children, in which maternal high-density lipoprotein cholesterol and low-density lipoprotein cholesterol were, respectively, negatively and positively associated with high BMI in the offspring (37). No associations were present between maternal TGs, TC, and high BMI in the latter study. It is tempting to speculate that lifestyle and environmental factors after birth play an increasing role in the development of excessive adiposity at older ages and thereby overrule prenatal factors, because both previous studies and the current study observed little evidence for the link between maternal antepartum lipids and an offspring’s adiposity when the offspring was older (18, 19, 37). Another explanation for the inconsistency might be the difference in adjustments for confounders. Our results of model 2 showed strong reduction in effect sizes, which indicates that the associations are influenced by confounding factors. pBMI was identified as an important confounder (Tables 1 and 2) while others did not adjust for it (14, 15). Furthermore, only in 1 previous small prospective cohort study was SCF measured in childhood using ultrasound. Their results did not reveal any significant association between maternal lipids and SCF (36), which is in agreement with our findings. To draw firm conclusions whether maternal lipid levels lead to accumulation of adipose tissue at certain locations, more research on this adiposity measure is warranted in humans.
The findings of our study did not provide convincing evidence for the developmental programming effects on children aged 11-12 years due to exposure to maternal prenatal lipids. According to the Developmental Origins of Health and Diseases hypothesis developmental programming refers to intrauterine exposure increasing the risk of cardiometabolic diseases later in life (6). Animal studies indicated that a high-fat diet during pregnancy leads to increased offspring adiposity (38, 39). Elevated maternal lipid profiles facilitate the availability of lipids to the fetus by crossing the placental barrier (40). This is caused by an increase in placental lipoprotein lipase activity, which has been shown to be increased in animals fed a high-fat diet (41). This may impact adipocyte differentiation and tissue development, which eventually leads to increased long-term abdominal fat accumulation (42, 43). Our results do not convincingly support these effects in children aged 11-12 years. However, the effects could be present at older ages. Moreover, maternal glucose metabolism might be more important for programming effects on fat accretion. The HAPO study found significant associations between maternal prenatal glucose levels across the whole spectrum of glucose values and a large range of adiposity measures at age 10-14 years, after adjustments for maternal BMI during pregnancy (44). This is in agreement with results from the DALI study showing stronger associations with skinfold thickness in neonates for maternal fasting glucose levels compared with fasting TG levels (45). These earlier reported findings and our results regarding the association between TGs and WHtR indicate that metabolites related to insulin resistance might be a mechanistic pathway for programming adiposity later in life.
The stronger association of FFAs with WHtR in boys could be caused by type 1 error, as this is only 1 out of 16 interactions that was present. This study therefore suggests no sex-specific adiposity programming influenced by maternal lipids in early pregnancy. However, a lot of animal studies give insight into sex-dependent intrauterine mechanisms that affect the health of the offspring (46). Plausible mechanisms are the differences in (epi)genetics, the placental reaction to changes in the uterus, and the action of hormones (47). When considering the sex-specific results of other prospective studies (21-25), future epidemiological studies are needed to explore the sex dimorphic associations in more detail.
Strengths and Limitations
For this long-term cohort study, a questionnaire was carefully designed and meticulous data collection was performed prospectively in order to have accurate data, minimize potential bias, and to be able to adjust for multiple relevant confounders. Furthermore, we included a large study population, most likely ensuring adequate statistical power to reveal a true association. Also, this study examined several adiposity outcomes, providing a more complete overview of the child’s body composition. Potentially, selection bias toward a more healthier population has occurred as the included women attended higher education, had a lower BMI, and were more often of Dutch origin than the women lost to follow-up (Table S1 (35)). Moreover, the majority of mothers had low healthy lipid profiles, but levels were comparable with other cohorts that measured lipid levels in the first trimester (15-17). This relatively healthy study population, which is also reflected in the low prevalence of gestational diabetes, may have led to an underestimation of the associations in our study. Also, generalization to the whole community should be made with caution.
Maternal weight status and ethnicity are strong determinants of the maternal lipid profile (14, 48-50) and therefore adjustments might have led to overcorrection. pBMI is related to maternal lipid levels and adiposity, suggesting potential mediation of maternal lipids in the association between pBMI and adiposity. However, Gademan et al observed that this mediation was not present at age 5-6 (14). It is unknown if maternal lipid profiles have a mediating role at age 11-12. Yet, it could also be speculated that mothers with a high BMI transfer their unhealthy body composition to their children via unhealthy lifestyle habits. Regarding ethnicity, previous studies observed ethnic differences in maternal lipid profiles (48, 49), which is also seen in this study. Ethnic variation in body composition, contributing to differences in cardiometabolic risk, potentially has its origins in fetal programming, but studies focusing on the associations between maternal lipids and ethnic variation in adiposity are lacking (51, 52). The blood sample of maternal lipids was taken in a nonfasting state; therefore, variation in diet, which has a great impact on lipid levels (53), could not be corrected for and might have led to misclassification, albeit we think that this misclassification is nondifferential and could have resulted in regression to the mean. Several previous cohort studies used fasting blood samples (15-17, 19, 36, 37). However, humans live in a nonfasting state most of the day, thus the current approach might have led to a more precise estimation of the true intrauterine exposures of the fetus. Maternal lipid levels were measured at a median of 13 weeks’ gestational age. Measuring lipid levels at more timepoints in pregnancy might allow insight into the critical periods for adiposity programming.
Finally, we did not adjust our results for multiple testing because of the explorative nature of our study. Overall, the results provide no convincing evidence for adiposity programming influences of maternal lipid profile in early pregnancy.
Implications
This study implies that maternal lipids in early pregnancy are not related to elevated adiposity in offspring at 11-12 years. A possible mediating role of maternal lipids in the association between pBMI and an offspring’s adiposity warrants further investigation. Another relevant topic for further studies is intrauterine conditions that may have sex-specific effects on an offspring’s health. Overall, future research should clarify the etiology of excess adiposity and metabolic diseases in order to prevent negative consequences. Although determinants may be partly lifestyle or epigenetic related, prevention strategies in pregnancy could still be beneficial for an offspring’s cardiometabolic health.
Conclusion
In conclusion, this study does not provide convincing evidence that maternal lipids in early pregnancy play a role in programming an offspring’s adiposity at age 11-12, and there is no indication for sex differences in fetal programming. More research is still needed to elucidate the factors in early life that influence the development of metabolic diseases.
Abbreviations
- ABCD
Amsterdam Born Children and their Development
- ApoA1
apolipoprotein A1
- ApoB
apolipoprotein B
- BMI
body mass index
- CI
confidence interval
- Fat%
fat percentage
- FFA
free fatty acid
- IQR
interquartile range
- SCF
subcutaneous fat
- TC
total cholesterol
- TG
triglyceride
- WHtR
waist-to-height-ratio
- YHCR
Youth Health Care Registration
Acknowledgments
We are grateful to all participating hospitals, obstetric clinics and GPs for their assistance in the implementation of the ABCD study. We would like to thank all participating pregnant women for their co-operation.
Funding
Funding was provided by The Netherlands Organization for Health Research and Development (ZonMw) Grant (TOP, 40-00812-98-11010), and the Sarphati Institute, Amsterdam.
Author Contributions
All the authors contributed to the conceptualization and the writing of the manuscript. R.B. conducted the analyses and drafted the manuscript; T.V. is project manager of the ABCD study; B.H. and T.V. were involved in obtaining the data. J.H., B.H., and T.V. provided advice on the analyses and interpretation of the data, revised the draft versions, and approved the final version of the manuscript.
Disclosure Statement
The authors have nothing to disclose.
Ethics Approval
Approval for the ABCD study was obtained from the Central Committee on Research involving Human Subjects (CCMO; number P02.0335L, 2002), the medical ethics committees of participating hospitals and the Registration Committee of Amsterdam.
Data Availability
The datasets generated and analyzed during the current study are not publicly available but are available from the corresponding author on reasonable request.
