


Abstract
Predicting the onset of menopause is important for family planning and to ensure prompt intervention in women at risk of developing menopause-related diseases.
We aimed to summarize risk prediction models of natural menopause onset and their performance.
Five bibliographic databases were searched up to March 2022. We included prospective studies on perimenopausal women or women in menopausal transition that reported either a univariable or multivariable model for risk prediction of natural menopause onset. Two authors independently extracted data according to the CHARMS (critical appraisal and data extraction for systematic reviews of prediction modelling studies) checklist. Risk of bias was assessed using a prediction model risk of bias assessment tool (PROBAST).
Of 8132 references identified, we included 14 articles based on 8 unique studies comprising 9588 women (mainly Caucasian) and 3289 natural menopause events. All included studies used onset of natural menopause (ONM) as outcome, while 4 studies also predicted early ONM. Overall, there were 180 risk prediction models investigated, with age, anti-Müllerian hormone, and follicle-stimulating hormone being the most investigated predictors. Estimated C-statistic for the prediction models ranged from 0.62 to 0.95. Although all studies were rated at high risk of bias mainly due to the methodological concerns related to the statistical analysis, their applicability was satisfactory.
Predictive performance and generalizability of current prediction models on ONM is limited given that these models were generated from studies at high risk of bias and from specific populations/ethnicities. Although in certain settings such models may be useful, efforts to improve their performance are needed as use becomes more widespread.
Menopause, as the complete cessation of the menstrual periods, marks the end of a woman’s natural reproductive lifespan. This event occurs in the age range from 40 to 60 years, with a median age of approximately 49 to 51 years (1). The relatively wide age range for the onset of menopause would seem to indicate that females have a highly variable number of oocytes and/or lose them at a highly variable rate (2). With the aging of the population, especially in the last decades, it is estimated that 1.2 billion women will be menopausal (experiencing menopause) or postmenopausal by 2030 (3). Age at natural menopause is a crucial period for women of reproductive age since both early or late menopause may have some health implications (4). Early menopause is associated with lower bone mass density, osteoporosis, depression, and increased risk of type 2 diabetes, cardiovascular diseases, and all-cause mortality (5-8). On the other hand, late menopause has been associated with increased risk of sex-related cancers including breast, ovarian, and endometrial cancers (9). Thus, predicting onset of natural menopause (ONM) may not only help clinicians regarding contraception (10), assisted reproduction (11), and management of menorrhagia (12), but also may alert women in reproductive ages of health-related complications due to either early or late menopause. With ongoing lifestyle changes and trends, many women postpone childbearing to the end of their reproductive lifespan. Therefore, an accurate estimation of time of menopause could improve the preventive management of unexpected early infertility (13).
While menopause is inevitable, research has indicated that ONM may vary depending on a wide range of factors including genetic factors, lifestyle and environmental exposures, sociodemographic factors, and hormonal mechanisms (14, 15). Thus, considering these known risk factors, in univariable or multivariable models, may provide insight into the prediction of natural menopause precisely. The most studied predictor biomarker is the circulating anti-Müllerian hormone (AMH), which as a single biomarker or combined with age and other variables shows a C-statistics ranging from 0.70 to 0.90 (16, 17). Estradiol and follicle-stimulating hormone (FSH) have also been explored as predictor biomarkers of ONM, showing a C-statistic similar to AMH (18, 19). However, most studies have not performed validation (17, 18, 20) or calibration (17, 18, 21, 22). Calibration is an important step in prediction models because even a good-performing model based on its C-statistics, can over- or underestimate the outcomes risk. In addition, the majority of the current prediction models have not provided a clear time prediction period to predict ONM. Uncertainty on the generalizability of prediction models to different populations and ethnicities exists as well. Thus, there is a need to summarize the risk prediction models for ONM and the understanding of the best predictors of natural menopause as well as current gaps in the literature. In the present study, we aimed to perform a comprehensive systematic review to identify prediction models for forecasting the timing of ONM and age at menopause of premenopausal women.
Methods
This systematic review was conducted according to a guideline on systematic reviews and meta-analysis (23) and reported according to the Preferred Reporting Items for Systematic Review and Meta-Analysis (PRISMA) guidelines (24). The study protocol was registered in the International Prospective Register of Systematic Reviews (PROSPERO) database on May 15, 2021 (CRD42021248771).
Search Strategy
A systematic literature search was conducted by a library information scientist (B.M.) in Embase (Ovid), Web of Science, Medline (Ovid), Cochrane CENTRAL, and Google Scholar up to February 8, 2021, and was updated on March 25, 2022, using the following Medical Subject Headings (MeSH) and non-MeSH keywords: (i) risk prediction, predictive, prediction model, diagnostic, diagnostic model, predictive ability; (ii) menopause, premature menopause, perimenopause, post menopause, age of menopause, early menopause, late menopause, menopause onset; (iii) accuracy, sensitivity, specificity, positive predictive value (PPV), negative predictive value (NPV), likelihood ratio, area under the ROC curve (AUC), Youden’s index, diagnostic odds ratio (DOR), C-statistics. Furthermore, we made a forward citation tracking and also hand-searched the reference list of eligible studies. The selection of studies was not restricted based on date and language. The detailed search strategy is presented in Supplementary Material 1 (25).
Selection Criteria
Published original studies fulfilling the following criteria were included: (i) prospective cohort studies, case-cohort, and nested case-control studies (i.e., studies with prospective data collection); (ii) conducted on premenopausal or perimenopausal women or women in menopausal transition; (iii) had followed women over time for the occurrence of menopause and reported ONM; (iv) reported either the univariable model or multivariable model for risk prediction of ONM; (v) had presented at least one of the following outcomes: accuracy, sensitivity, specificity, positive predictive value (PPV), negative predictive value (NPV), likelihood ratio, area under the curve (AUC), Youden’s index, diagnostic odds ratio (DOR), and C-statistics.
Studies were excluded if they (i) were performed in animals; (ii) were cross-sectional or case-control studies without prospective data collection; (iii) were focused on menopause due to surgery, radiotherapy, or chemotherapy; (iv) provided data about model performance beyond our inclusion criteria like hazard ratios. Titles and abstracts of publications were manually screened by independent reviewers (H.R.-D., S.K., P.F.R., G.D., P.E.T.). Subsequently, the full-text screening was performed. Disagreements in judgment were resolved by discussion with a third reviewer (M.G. or T.M.).
Data Extraction
For each included article, we extracted the following data: study and population characteristics (year of publication, country, study design, funding source, number of participants, follow-up time, exclusion criteria, age, menopause status), variables considered for the prediction (hormones, imaging-like transvaginal ultrasound, menstrual cycle irregularities), number of natural menopause events, definition of menopause and early natural menopause, prediction time and performance of the model (C-statistics, sensitivity, specificity, AUC) using a standardized data extraction form based on the Critical Appraisal and Data Extraction for Systematic Reviews of Prediction Modelling Studies (CHARMS) checklist (26). In the case of multiple publications, the most up-to-date or comprehensive paper was included unless the article investigated different predictors and study outcomes in different time periods within the same study (e.g., 2 years or 1 year before the onset of the last menstruation (22, 27)). Two reviewers (H.R.-D. and S.K.) independently extracted all of the required data. Possible discrepancies were resolved by consulting a third reviewer (M.G. or T.M.).
Quality Assessment
Risk of bias (ROB) and applicability to the intended population and setting was examined by using a prediction model risk of bias assessment tool (PROBAST) (28). PROBAST contains main domains including (participants, predictors, outcome, and analysis) and assesses the ROB for the 4 domains and applicability, except for the analysis domain. Each domain is characterized by specific questions (20 questions overall). Questions may be answered as yes, probably yes, probably no, or no information, depending on the provided information of each included study. A domain is at high ROB when at least one of its items is judged as not appropriate (no or probably no). The overall risk of bias is considered as high ROB when one or more domains are considered to be at high risk.
Results
Study Selection
A flow chart of the study selection process is shown in Fig. 1. A total of 8132 citations were obtained from the initial database search. After removal of duplicates, 4415 unique references remained for screening of the titles and abstracts, of which 95 articles underwent full-text reviewing. Fourteen articles based on 8 unique studies (16-22, 27, 29-34) describing 180 prediction models of ONM satisfied the inclusion criteria and were selected for data extraction and synthesis (Supplementary Table 2) (25).

Study selection procedure.
Study Characteristics
Population
Of the 14 articles included, 6 (16-21) used data from the Netherlands, 4 from the USA (21, 23, 29, 32), 3 (22, 30, 34) from Iran, and 1 (32) article combined data from the Netherlands and Iran. Some cohorts were used multiple times for model development. The Doetinchem Cohort Study was used in De Kat et al (16) and Dolleman et al (2015) (21). The SWAN cohort (The Study of Women’s Health Across the Nation) was used in Finkelstein et al (22) and Greendale et al (27). The article by Depmann et al (2016), is a follow-up study of Broer et al (the Scheffer, van Rooij, de Vet [SRV] cohort study). The article of Dolleman et al (2014) (20) consists of 2 cohorts, one of which is the SRV cohort. The TLGS cohort (Teheran Lipid and Glucose Study) was used in Gohari et al (29), Tehrani et al (2020) (31), and Tehrani et al (2021) (34). The study by Tehrani et al (2014) (32) was performed using data from 2 cohorts, the TLGS and the SRV cohorts. Thus, 14 articles (16-22, 27, 29-34) based on 8 unique study populations (16, 17, 19, 20, 22, 29, 30, 33) were included for final analysis.
All articles included premenopausal women with ages ranging from 18 to 63 years at baseline. Ten articles included women of Caucasian background (16-21, 29, 31, 32, 34), while 2 articles included a Black or White population (30, 33). Two articles included cohorts of The Study of Women’s Health Across the Nation (SWAN) (22, 27), which included different ethnicities (Caucasian, African American, Hispanic, Chinese, Japanese). The proportion of hormone therapy users (either hormone replacement therapy or hormonal contraception) varied from 16% to 33% (16, 21, 30). The ONM was self-reported in all the included studies.
Women who underwent gynecological surgery (oophorectomy, hysterectomy) or regularly took hormones (oral contraception, hormonal replacement therapy) were excluded from most studies. Other exclusion criteria of individual studies were pregnancy, infertility, unproved fertility, other endocrine disorders, or irregular/unpredictable menstrual cycles at the time of first assessment. The exclusion criteria for each study are summarized in Supplementary Table 1 (25).
Prediction Models
Risk prediction models of included articles used biomarkers (AMH, FSH, estradiol, inhibin B), imaging (transvaginal ultrasonography to obtain antral follicle count), menstrual cycle irregularities/climacteric symptoms, or lifestyle factors (body mass index [BMI], smoking). All biomarkers were assessed at a single time point, which was usually at baseline. More than half of the articles (n = 8) developed and validated both the univariable and multivariable model (16-20, 29, 30). For each of these individual studies, at first, the accuracy of prediction was checked for the individual predictors. Next, the predictors with the best accuracy were combined to explore whether it improved the prediction of ONM. Five articles elaborated only multivariable models (22, 27, 29, 32, 34), and 1 article (33) provided a univariable model. With the exception of 1 article (27), all articles had the prediction of ONM as an outcome. Menopause in the included articles was defined as 12 consecutive months without menstruation (3) and was based on self-reporting. Greendale et al (27) validated risk prediction models that predicted the probability of a woman having crossed 2 years before, 1 year before, and the final menstrual period (FMP) itself. Four studies also provided the risk prediction of onset of early menopause (16, 21, 31, 34). Nine articles reported C-statistic (16-18, 20, 21, 30-32, 34), 1 article reported AUC (19) and another one only sensitivity/specificity (33), and 3 articles reported AUC/sensitivity/specificity (22, 27, 29). A 95% confidence interval was reported in 8 articles (16, 19, 20, 22, 31-34).
Prediction Horizon
The majority (8 of 14) of articles (16-18, 20, 21, 31, 32, 34) did not report the prediction time of menopause onset. Finkelstein et al (22) and Greendale et al (27) used prediction times of 1, 2, and 3 years until women became menopausal, whereas Gohari et al (29) provided forecast information in 3, 4, or 5 years. Kim et al (30) and van Rooij et al (19) predicted the time to menopause to be 5 and 4 years, respectively. Taylor et al (33) used a prediction time that ranged within 2 or 4 years.
Study Design
All articles were of prospective cohort design.
Sample Size
The number of participants ranged from 81 to 2434. The mean follow-up period was 10.2 years. During follow-up, a mean of 34.3% of women reached menopause. The number of events (occurrence of menopause) were clearly reported in 10 articles (16-18, 20, 21, 29-32, 34), and ranged from 46 to 1298. Four articles (19, 22, 27, 33) did not report the number of women experiencing menopause during the follow-up.
Outcome Assessment
One model (33) was developed using only self-reported data (menstrual cycle irregularities). However, most of the models (13 of 14) were developed using a combination of self-reported (interview or questionnaire) and biological measurements (e.g., hormones and antral follicle count).
Predictors
There were overall 180 models tested. In total, 20 different predictors were included. Most models included a set of similar predictors, consisting of age, (n = 121), Anti-Müllerian hormone (AMH) (n = 87), and follicle-stimulating hormone (FSH) (n = 44). Other commonly identified predictors are shown in Supplementary Fig. 1 (25).
Predictors of ONM in Risk Prediction Models
Most Common Predictors
The 3 most common predictors were age, AMH, and FSH, and findings on these predictors are summarized in Table 1.
Most common predictors of menopause onset
| Study | Sample size | Number and percentage of women reaching menopause | Follow-up period (years) | Time period | Prediction time (years) | Model | Sensitivity (95% CI) | Specificity (95% CI) | AUC (95% CI) | C-statistics (95% CI) |
|---|---|---|---|---|---|---|---|---|---|---|
| Broer, 2011 | 185 | 48 (25.9%) | 11 | 1996-2010 | n.r. | Age | - | - | - | 87 |
| AMH | - | - | - | 86 | ||||||
| FSH | - | - | - | 70 | ||||||
| De Kat, 2019 | 2434a | 1298 (53%) | 20 | 1987-2019 | n.r. | AMH | - | - | - | 70 (68-72) |
| Depmann, 2016 | 155 | 81 (52.2%) | 14 | 1992-2013 | n.r. | Age | - | - | - | 85 |
| AMH | - | - | - | 78 | ||||||
| FSH | - | - | - | 66 | ||||||
| Dolleman, 2014 (study group 2) | 150 | 46 (30.6%) | 12 | n.r. | n.r | Age | - | - | - | 84 (78-90) |
| AMH | - | - | - | 86 (81-91) | ||||||
| Dolleman, 2015 | 1163b | 527 (45.3%) | 10 | 1993-2007 | n.r | Age | - | - | - | 88 |
| Kim, 2016 | 426 c | n = 55 (13%) | 10 | 2001-2011 | 5 | Age | - | - | - | 83 |
| 359 d | n.r. | Age | - | - | - | 82 | ||||
| 327 e | Age | - | - | - | 81 | |||||
| 306 f | Age | - | - | - | 86 | |||||
| Taylor, 2004 | 326 | n.r. | 4.8 | 1993-1997 | Within 2 years | Age ≥ 50 years | 42.4 (26.8-60.0) | 87.4 (82.9-91.1) | - | - |
| Within 4 years | Age ≥ 50 years | 40 (28.3-52.3) | 94.8 (90.2-97.4) | - | - | |||||
| Van Rooij, 2004 | 81 | N = 14 had cycle fluctuations | 5 | 1996-? | 4 | Age | - | - | 82 (71-93) | - |
| AMH | - | - | 87 (79-96) | - | ||||||
| FSH | - | - | 72 (56-88) | - |
Abbreviations: AFC, antral follicle count; AMH, anti-Müllerian hormone; ANM, age at natural menopause; AUC, area under the curve; FSH, follicle-stimulating hormone; OC, oral contraceptive; n.r., not reported.
aWomen who were using oral contraceptives were also included in the final analysis.
bPregnant women, women who were taking hormonal replacement therapy, and OC users were also included in the final analysis.
cAll women.
dWomen not using estrogen.
eWomen with regular menses only.
fNo women with dominant follicle.
Age
Age was the most common investigated predictor, used in 121 models (from a total of 180 models). Age as the only predictor was used in 7 studies (17-21, 30, 33); in 6 studies age as a sole predictor showed AUC or C-statistics ranging from 0.82 to 0.88 (17-21, 30). Another study performed by Taylor et al (33) showed poor sensitivity and good specificity of age in forecasting menopause within 2 or 4 years (sensitivity 42.4% [95% CI, 26.8-60.0] and 40% [95% CI, 28.3-52.3]; specificity 87.4% [95% CI, 82.9-91.1] and 94.8% [95% CI, 90.2-97.4], respectively) (33).
AMH
AMH was used in 87 predictive models, making it the second most common investigated predictor. AMH as a sole predictor of menopause onset provided a C-statistics ranging from 0.70 to 0.87 (16-19). Adding age into the models using AMH improved predictive ability across all articles (C-statistics/AUC 0.86-0.90) (17-19) (Supplementary Materials 2) (25).
FSH
FSH was used in 44 prediction models (of which 3 in univariable models) (17-19). The univariable models of Broer et al (17) and Depmann et al (2016) (18), using FSH as a predictor (18), showed C-statistics of 0.70 and 0.66, respectively. The AUC of van Rooij et al (19) was 0.72 (95% CI, 0.56-0.88). After adjusting for age, the model performance of all 3 mentioned articles improved (Depmann 0.85, Broer 0.88, and van Rooij 84) (Supplementary Materials 2) (25).
Final Menopause Prediction Models
In the following section, we present the final models reported by the authors and/or the models with the best performance generated from the included studies; the findings and whether these final models were validated and/ or calibrated are summarized in Table 2. Overall C-statistics/AUC ranged from 0.710 to 0.987, while 1 article (33) showed a sensitivity and specificity of 93.9% (95% CI, 80.6-98.9) and 90.8% (95% CI, 86.7-94.0), respectively. Age and AMH were present in most included studies. Of the included studies, only 6 (16, 19, 21, 22, 30, 31) and 1 (32) studies validated their models internally and externally, respectively, and 5 studies performed calibration (16, 27, 29, 31, 32). Of these, while all of the above-mentioned studies performed validation for their final models (16, 19, 21, 22, 30-32), only the study by Gohari et al (29) performed calibration for their final model.
Final menopause prediction models
| Study | Sample size | Number and percentage of women reaching menopause | Follow-up period (years) | Time period | Prediction time (years) | Model | Sensitivity (95% CI) | Specificity (95% CI) | AUC (95% CI) | C-statistics (95% CI) |
|---|---|---|---|---|---|---|---|---|---|---|
| Broer, 2011 | 185 | 48 (25.9%) | 11 | 1996-2010 | n.r. | AMH + age* | - | - | - | 90 |
| De Kat, 2019d | 2434a | 1298 (53%) | 20 | 1987-2019 | n.r. | AMH at age 35* | - | - | - | 71 (69-72) |
| Depmann, 2016 | 155 | 81 (52.2%) | 14 | 1992-2013 | n.r. | AMH + age + smoking* | - | - | - | 87 |
| Dolleman, 2014 (study group 2) | 150 | 46 (30.6%) | 12 | n.r. | n.r | Daughter’s age + mother’s ANM + daughter’s AMH* | - | - | - | 92 88-96 |
| Dolleman, 2015d | 1163b | 527 (45.3%) | 10 | 1993-2007 | n.r | AMH + age + BMI + pack-years of smoking + menstrual cycle status | - | - | - | 91 |
| Finkelstein, 2020d | 1537 | n.r | 2 | 1996-1998 | 3 | AMH + age + BMI* | - | - | 89.6 (88.9-90.3) | - |
| Gohari, 2016f | 266 | 63 (23.7 %) | 6.5 | 1999-2006 | 3 | AMH + Age at making prediction was 43* | - | - | 98.7 | - |
| Greendale, 2013d | 552 | n.r. | 10 | 1996-2007 | 2 years before FMP c | FSH + Estradiol + age + menopause transition stage + race/ethnicity + time of venipuncture (in early follicular phase = cycle days 2-5 = in-window) | - | - | 90.2 | - |
| 1 year before FMP d | FSH + Estradiol + age + menopause transition stage + race/ethnicity + time of venipuncture (in early follicular phase = cycle days 2-5 = in-window) | - | - | 92.6 | - | |||||
| FMP e | FSH + Estradiol + age + menopause transition stage + race/ethnicity + time of venipuncture (in early follicular phase = cycle days 2-5 = in-window) | - | - | 94.5 | - | |||||
| Kim, 2016d | 306 c | n.r. | 10 | 2001-2011 | 5 | Age + AMH + FSH + AFC* | - | - | - | 95 |
| Taylor, 2004 | 326 | n.r. | 4.8 | 1993-1997 | Within 2 years | 60 or more days of amenorrhea during the previous year* | 93.9 (80.6-98.9) | 90.8 (86.7-94.0) | - | - |
| Tehrani, 2014e | 266 | n = 63, 23.7% | 6 | n.r. | n.r. | Age + AMH (TLGS model on TLGS data)* | - | - | - | 88 (83-94) |
| Tehrani, 2020d | 959 | n = 529, 55.2% | 14 | 1998-? | n.r. | Age + AMH + annual AMH decline rate + sample storage time | - | - | - | 81 (79-83) |
| Tehrani, 2021 | 901 | 522 | 18 | 1998-2016 | n.r. | AMH value + Log (annual AMH decline rate)(adjusted for age at baseline and storage time of AMH) | - | - | - | 0.85 (0.83–0.87) |
| Van Rooij, 2004d | 81 | n = 14 had cycle fluctuations | 5 | 1996-? | 4 | Age + AMH + Inhibin B | - | - | 92 (86-99) | - |
Abbreviations: AFC, antral follicle count; AMH, anti-Müllerian hormone; ANM, age at natural menopause; AUC, area under the curve; BMI, body mass index; FMP, final menstrual period; FSH, follicle-stimulating hormone; OC, oral contraceptive; n.r., not reported; TLGS, Teheran Lipid and Glucose Study.
aWomen who were using oral contraceptives were also included in the final analysis.
bPregnant women, women who were taking hormonal replacement therapy and OC users were also included in the final analysis.
cNo women with dominant follicle.
dStudies that performed internal validation for their final models.
eStudies that performed external validation.
fStudies that performed calibration for their final models.
*These models were selected for their best performance. Models without labeling were called final models by the authors.
Best model performance of Broer et al (17) and Tehrani et al (2014) (32), consisting of age and AMH, showed a C-statistics of 0.90 and 0.88 (95% CI, 0.83-0.94), respectively. De Kat et al (16) and Gohari et al (29) models both included AMH at a certain age (35 and 43 years, respectively). The C-statistics and AUC were 0.71 (95% CI, 0.69-0.72) and 0.987, respectively. Addition of AMH decline rate, oral contraception use, or smoking to De Kat’s model did not have any impact on the model performance. Best model performance presented by Depmann et al (2016) (18), included age, AMH, and smoking (C-statistic 0.87). There was no change in performance between the different time points of age or smoking (baseline versus follow-up). Dollemann’s (2014) (20) final model including daughter’s age and AMH and mother’s age of natural menopause (ANM) presented a C-statistic of 0.92 (95% CI, 0.88-0.96). The study showed that AMH was a more accurate menopause predictor than mother’s age at menopause. Dolleman et al (2015) (21) presented a multivariable model with good performance consisting of age, AMH, BMI, pack-years of smoking, and menstrual cycle status (C-statistic, 0.91). A similar model by Finkelstein et al with age, AMH, and BMI presented an AUC of 0.896 (95% CI, 0.889-0.903) (22).
The final model by Greendale et al (27) included FSH, estradiol, age, menopause transition stage, race/ethnicity, and time of venipuncture (in early follicular phase) either 2 years before final menstrual period (FMP), 1 year before FMP, or at FMP. The models with different prediction times showed AUC of 0.902 to 0.945.
Kim et al combined age with different hormones (AMH and FSH) and antral follicle count (AFC) and presented a C-statistic of 0.95.
Taylor (33) used 6 definitions of menstrual variability for predicting time to natural menopause within 2 or 4 years ([i] more than 90 days since the most recent menstrual period; [ii] 60 or more days of amenorrhea during the previous years; [iii] cycle lengths that varied by 19 or more days; [iv] cycle lengths too variable to report a usual length; [v] cycles less regular than they had been at age 40; [vi] change in the duration or heaviness of menstrual flow compared with age 40). The second definition of menstrual variability showed the highest sensitivity (93.9%; 95% CI, 80.6%-98.9%) and specificity (90.8%; 95% CI, 86.7%-94%) within 2 years.
Tehrani et al (2020) (31) showed that prediction of age at menopause could be improved by multiple AMH measurements. Their final prediction model included age, AMH, annual AMH decline rate, and sample storage time, and showed a C-statistic of 0.81 (95% CI, 0.79-0.83). Van Rooij’s (19) prediction model, which included age, AMH, and inhibin B, resulted in AUC of 0.92 (95% CI, 0.86-0.99).
In a recent study done by Tehrani et al (2021) (34), AMH measurement at different time points, baseline age, storage time of AMH, and annual AMH decline rate were included in the final model, resulting in a C-statistic of 0.85 (95% CI, 0.83-0.87).
Detailed explanation of the risk prediction models of the included studies are presented in Supplementary Table/Materials 2 (25).
ROB Assessment
The detailed summary of ROB assessment based on each domain and its related subdomains for the included studies is presented in Supplementary Table 3 (25). All included studies were classified as high ROB (Figs. 2 and 3) (16-22, 27, 29-34). ROB assessment based on each domain showed that all of the included articles had a low ROB for “participants” domain, demonstrating that participants enrolled in the articles were representative for the models’ targeted populations (Fig. 2).
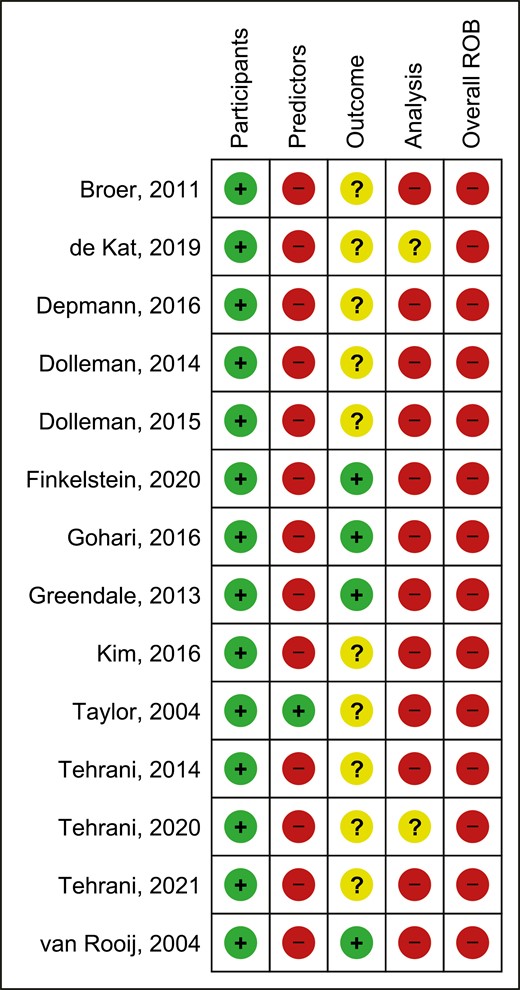
Risk of bias assessment (ROB) summary of the included studies.
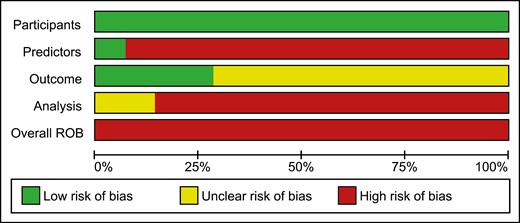
Risk of bias graph of the included studies.
Thirteen articles (16-22, 27, 29-32, 34) had a high ROB for “predictors” domain, as predictors were not defined in a similar way for all participants or different assessment methods were used or since all of the predictors would not be available at the time the model intended to be used for prediction. The study performed by Taylor et al (33) was the only study in which all of its predictors would be available at the time the model is intended to be used for prediction (Fig. 2). The ROB was unclear for 10 articles for “outcome” domain (Fig. 2) (16-18, 20, 21, 30-34); Eight out of 10 articles did not provide any information on the time interval between predictor assessment and outcome determination (16-19, 22, 29, 31, 34). The article done by Kim et al did not provide any information on whether a prespecified or standard outcome definition (onset of menopause) was used or whether predictors were excluded from outcome definition (30). In addition, another article had an unclear ROB for this domain due to the lack of information on whether predictors were excluded from the outcome definition or whether outcome was determined without knowledge of predictors information (33). Twelve of the 14 articles were at high ROB for the “analysis” domain and the 2 remaining articles were scored as unclear ROB for this domain (Fig. 2). Number of participants with the outcome (those who reached menopause) was not provided in 4 articles and subsequently the ROB was considered as unclear for this subdomain (19, 22, 27, 33), while the article performed by Kim et al (30) was at high ROB due to the limited number of participants with the outcome relative to the number of candidate predictor parameters. Three articles did not provide information on whether all enrolled participants were included in the analysis and were scored as unclear for this subdomain (19, 27, 29); nevertheless, the article done by Finkelstein et al (22) was at high ROB for this subdomain due to the inappropriate exclusion of 1108 enrolled women from the final analysis. Only 3 articles presented sufficient information on handling the participants with missing data appropriately and were scored as low ROB (16, 21, 34). Only 1 study was at high ROB due to the selection of predictors based on univariable analysis (33), while the other 13 articles were at low ROB for this subdomain (16-22, 27, 29-32, 34). Although 4 articles did not present information on complexities in the data analysis (21, 29, 31, 33) and 4 articles used inappropriate analytical methods (19, 22, 27, 30) and were scored as unclear or high ROB, respectively, 6 articles accounted for complexities in the data analysis appropriately (16-18, 20, 32, 34). Regarding the complexities in the data analysis, 3 out of 6 articles (17, 18, 32) have used a Weibull survival model analysis, which accounts for the length of follow-up and delayed entry of participants, rather than logistic models in which predictions are not specific to a particular time period and the length of follow-up is being ignored. In addition, 3 other articles (16, 20, 34) have used a time-to-event analysis, such as Cox regression, which accounts for censored participants up to the end of their follow-up rather than logistic regression models which simply exclude participants with incomplete follow-up. Nine articles did not assess calibration and were at high ROB (17-22, 30, 33, 34), indicating that the performance or the ability of their model to provide accurate individuals probabilities is unsatisfactory. Seven articles have used some form of validation and were scored as low ROB (16, 19, 21, 22, 30-32). Of which, 6 studies have performed internal validation methods such as bootstrapping (16, 19, 21, 22, 30, 31) and only 1 study used cross-validation method (32). Only 3 articles reported that the predictors and regression coefficients in the final model correspond to reported results from multivariable analysis and subsequently were scored as low ROB (20, 21, 31).
Concerns regarding applicability of the presented models are presented in Supplementary Figures 2 and 3 (25). Assessment of applicability to “participants,” “predictors,” and “outcome” domains revealed that 4, 2, and 8 articles were rated with high, unclear, and low overall applicability concern, respectively.
Discussion
Summary of Main Findings
This study systematically reviewed the literature and identified 14 articles describing 180 either univariable or multivariable risk prediction models of menopause onset. These models varied significantly regarding participant inclusion, sample size, predictors, endpoints, and model performance. The different predictors included demographics, lifestyle, biomarkers, imaging, and clinical features of menopause transition. In total, 13 of the 14 articles used more than one predictor in their models. The most commonly used predictor was age, followed by AMH and FSH.
While there are some narrative reviews on this topic, they have major limitations. First, they have not performed a systematic appraisal of evidence, which could lead to bias. Our study provides the first comprehensive systematic review on the topic, using well-defined inclusion and exclusion criteria. Second, previous studies have focused on a limited number of predictors like AMH (35) or restricted their results to Western European countries (36). Of the 14 included articles, most were conducted on populations from the Netherlands (n = 7), the USA (n = 4), or Iran (n = 5). Risk prediction models may, however, act differently in populations of different racial or ethnic backgrounds. Systematic efforts to validate models in other populations are essential. Women who were using hormone therapy for medical reasons or as contraceptives or hormonal replacement therapy were in general excluded from the articles. However, De Kat et al, Dolleman et al (2015), and Kim et al included women who were taking estrogen (oral contraception, hormonal replacement therapy) (16, 21, 30). Dolleman et al (2015) also included pregnant women (21). Pregnancy or exogenously supplied hormones affect the level of hormones, which can affect performance of the model.
In addition, more than half of the included studies did not report the time interval between the assessment of predictors and outcome. The interpretation of the results is strongly dependent on the prediction horizon, and among the articles reporting time of prediction, the focus was on short-term prediction of menopause onset. While long-term prediction models can be useful in terms of public health interventions to identify women at risk of developing early menopause, such models are lacking. In addition, predicting the onset of menopause becomes more difficult the longer this time lies in the future and is therefore more prone to error, which needs to be explored and addressed by future studies.
While overall, the presented prediction models were at high ROB, all of the included articles were of low concern regarding inclusion and exclusion of participants and none of them included participants who already had the outcome (menopausal women). Inclusion of participants who already have the outcome may result in biased and overestimated predictive performance. Most of the articles suffer from serious analytical limitations. For instance, 10 articles excluded participants with missing data from the final analysis, which may cause biased predictor-outcome associations and result in misleading model performance. In addition, 3 articles only presented classification measures, including sensitivity and specificity, to show model predictive performance without providing C-statistics (22, 27, 33). It is worth mentioning that the estimation of classification requires the consideration of one or more thresholds in the range of the model-predicted probabilities, which typically leads to misinformation since the whole range of predicted probabilities of the model is not fully considered, and also, the selection of thresholds might be data-driven rather than prespecified clinical cutoffs. The introduction of thresholds helps reporting the performance of predictive models at probability thresholds that may be clinically relevant, which does not include the entire range of the model-predicted probabilities. This approach may result in critical bias in the estimated classification measures, especially when thresholds are selected to show the maximum performance (37, 38). Calibration was not assessed in 9 studies, and it is worth mentioning that only the study by Gohari et al (29) performed calibration for all models, while the remaining 4 studies reported calibration for a limited number of models (16, 27, 31, 32), which indicates that the performance of their prediction models to provide accurate probabilities are doubtful. Poorly calibrated or not calibrated risk prediction models can be misleading and potentially harmful for clinical decision-making guidelines. Moreover, while over half of the included articles presented some form of internal validation that accounts for the overfitting of the developed model and optimism in its predictive performance, the evidence from the external validation of the presented models is still unsatisfactory. Only 1 article, performed by Tehrani et al (2014) (32) replicated their models into another cohort in a cross-validation approach. In addition, most of the presented models did not provide 95% CIs of the estimates. The majority of articles did not test whether the differences between models in predicted estimates (e.g., AUC) were significantly different, thus precluding the interpretation of results.
Strengths and Limitations
To our best knowledge, the current study is the first study summarizing the risk prediction models of menopause onset. Due to a large number of prediction models (n = 180) and the limited number of included articles (n = 14), we were not able to perform a meta-analysis. In addition, only 8 articles reported a 95% CI of sensitivity, specificity, AUC, and C-statistics. While we applied a comprehensive search strategy and screened references of the final included articles to capture all relevant studies, we cannot exclude the possibility there has been underreporting of negative results. Although all of the included studies were at high ROB, their applicability according to PROBAST was satisfactory. Applicability concerns whether the review question and the included studies are a good match regarding its domains (participants, predictors, outcome). Eight out of 14 studies were rated as low concern (16, 19, 21, 22, 27, 29, 31, 34) and 2 (30, 33) and 4 studies (17, 18, 20, 32) were rated as unclear and high concern with regard to applicability, respectively. Reviewing the risk prediction models with high applicability indicates that most of them have included age and AMH in their models. Thus, such predictors can be used by clinicians to get insights on prediction of ONM to make better clinical judgment for health-related consequences of menopause onset. In case of limited resources to measure biomarkers, the models presented by Taylor et al (32) may be used by clinicians to predict ONM, considering that the models were based on simple questions related to menstrual variability, which can be obtained during the physical examination. However, it is important that clinicians and patients understand the limitation of such prediction models when interpreting the results.
Future Prospects
Due to increased longevity, there is a trend of postponing childbearing; therefore, prediction of menopause onset could improve early informed decision-making regarding family planning. Predicted early menopause could emphasize the need for timely prevention of bone demineralization and cardiovascular and neurological disease, whereas the prediction of late menopause would open options for preventive management of breast, endometrial, and ovarian cancer. Future studies should be performed in different countries and include premenopausal women of different ethnicities with wider age ranges (that account for both early and late menopause) to improve the model generalizability. Further, increased knowledge of the variation of menopausal onset and performance of prediction models across different ethnicities and medical history will allow for better personalized prediction, that is, providing an accurate prediction for each single patient. Efforts are required to avoid poor calibration when developing prediction models and evaluate calibration when validating them, and improvement of methods that deal with analysis. Currently, there is limited evidence in the prediction of early onset of menopause, and/or long-term prediction of menopause onset.
Conclusion
This systematic review summarizes the available literature trying to predict the risk of ONM in different settings and highlights numerous methodological deficiencies of the current prediction models. While the predictive performance of the presented models is limited, their applicability is satisfactory. Age and AMH were the most used predictors in the presented models and generally showed high predictability for menopause onset. The current study can help guide future studies to develop methodologically sound predictors of ONM.
Abbreviations
- AMH
anti-Müllerian hormone
- ANH
age of natural menopause
- AUC
area under the curve
- BMI
body mass index
- FMP
final menstrual period
- FSH
follicle-stimulating hormone
- ONM
onset of natural menopause
- PROBAST
prediction model risk of bias assessment tool
- ROB
risk of bias
- SRV
Scheffer, van Rooij, de Vet
- TLGS
Teheran Lipid and Glucose Study
Acknowledgments
H.R.-D. has received funding for his Ph.D. studies by the Swiss National Science Foundation under the “Spirit grant” (SNSF IZSTZ0_190277). P.F.R. has received funding from the European Union’s Horizon 2020 research and innovation program under the Marie Skłodowska-Curie grant agreement No 801076, through the SSPH + Global Ph.D. Fellowship Programme in Public Health Sciences (GlobalP3HS) of the Swiss School of Public Health. The funding agencies had no role in the study (conceptualization, design, data collection, analysis, and writing).
Funding Source
None
Disclosures
The authors have nothing to disclose.
International Prospective Register of Systematic Reviews
PROSPERO registration code CRD42021248771.
Conflict of Interest
The authors declared that they have no potential conflicts of interest.
Data Availability
Data available within the main article and its supplementary materials.
References
Author notes
Authors contributed equally.
