


Abstract
During an asymptomatic prediabetic state, the functional ß-cell mass decreases to a critical threshold, triggering diabetes and related symptoms. To date, there are no reliable readouts able to capture in vivo a potential drop of the ß-cell mass.
Beside its use as a short-term marker of glycemic control, the deoxyhexose 1,5-anhydroglucitol was identified in rodents as a circulating biomarker of the functional ß-cell mass already in the asymptomatic prediabetic stage. The present study investigated the putative corresponding relevance of circulating 1,5-anhydroglucitol in different human cohorts.
We analyzed clinical and blood parameters in patients with established type 2 diabetes and subjects considered at high risk of developing diabetes, as well as patients with no history of diabetes scheduled for pancreaticoduodenectomy.
Circulating 1,5-anhydroglucitol was reduced in type 2 diabetic patients, negatively correlating with fasting plasma glucose (P < 0.0001) and hemoglobin A1c (P < 0.0001). In healthy subjects, 1,5-AG levels positively correlated with body mass index (P = 0.004) and Homeostatic Model Assessment of Insulin Resistance %S (P < 0.03) and was particularly high in nondiabetic obese individuals, potentially accounting for compensatory ß-cell expansion. Patients with no history of diabetes undergoing pancreaticoduodenectomy exhibited a 50% reduction of circulating 1,5-anhydroglucitol levels following surgery leading to an acute loss of their ß-cell mass (P = 0.002), regardless their glucose tolerance status.
In summary, plasma concentration of 1,5-anhydroglucitol follows the ß-cell mass and its noninvasive monitoring may alert about the loss of ß cells in subjects at risk for diabetes, an event that cannot be captured by other clinical parameters of glycemic control.
In both type 1 and type 2 diabetes (T2D), the symptoms appear once a significant fraction of the functional ß-cell mass has been lost (1). T2D typically involves an initial peripheral tissue insulin resistance, to which ß cells initially attend to compensate by increasing their mass and/or function (2-4). Once T2D manifests, it has been shown that a stark decline in the ß-cell mass has been initiated (5, 6), contributed predominantly by the number rather than the size of the ß cells (7, 8). However, this key event is difficult to capture and to demonstrate unequivocally because there is currently no clinical way to measure ß-cell mass in living individuals, most patients remaining undiagnosed until the appearance of symptoms associated with of T2D (3, 9).
Using metabolomics, we previously identified the deoxyhexose 1,5-anhydroglucitol (1,5-AG) as a biomarker associated with the loss of functional ß-cell mass preceding the appearance of hyperglycemia in 2 mouse models with complementary and well-characterized spectra of ß-cell defects (10). Specifically, hepatic and circulating levels of 1,5-AG decrease along with the lowering of functional ß-cell mass through an unidentified mechanism, preceding diabetes onset and progressing further as diabetes manifests through hyperglycemia. This 1,5-AG is a naturally occurring polyol, mainly derived from food, which forms a stable pool in human subjects (11). The interest on this polyol rose when researchers observed reduced concentrations of 1,5-AG in the established diabetic state (11-15). Thus, it was later proposed as an index of short-term glycemic control in diabetic patients (16, 17).
In this study, we show that 1,5-AG is a circulating biomarker of the in vivo loss of functional ß-cell mass in human subjects, independently of altered glycemic control, even ahead of diabetes onset.
Material and Methods
Participants
We analyzed blood fraction samples, stored at –80°C and collected in the fasting state, from participants who were already recruited for several studies in different European medical centers (Geneva, Maastricht, and Rome). Samples were taken from the control arms of the studies. The additives coating the tubes used for collection of blood and the blood fraction used for each of the measurements are detailed in Table S1 (18).
Geneva’s Cohort: Participants With Established T2D and Non-T2D (Healthy)
These patients were recruited at the Geneva University Hospital (Switzerland) and provided informed consent. The designed protocol was reviewed and approved by the institutional medical ethics committee (CER11-015). Patients with type 1 diabetes, latent autoimmune diabetes in adults, steroid-induced diabetes, posttransplant diabetes, hepatitis, corticosteroid therapy, and active neoplasia were excluded from this study. The included participants were 40 to 75 years old. The clinical characteristics are detailed in Table S2 (18). Participants without antidiabetic treatments and with hemoglobin A1c (HbA1c) < 6.0 % (42 mmol/mol) were included in the non-T2D control group (n = 100). Participants with oral antidiabetic treatment or HbA1c ≥ 6.5 % (48 mmol/mol) were included in the T2D group (n = 42) and participants with insulin treatment (Tx) were included in the T2D insulin Tx group (n = 12). All participants were asked to follow a moderate diet without excess fat or alcohol intake 24 hours before the blood sampling day. Blood samples for all study participants were collected between 8 and 10 am, following overnight fasting. Blood samples were immediately analyzed by the Geneva University Hospital laboratory for serum insulin, plasma glucose, blood HbA1c, other plasma hormones, and basic plasma lipid measurements. All clinical data are reported in Table S2 (18) and diabetic medications are reported in Table S3 (18). Homeostatic Model Assessment (HOMA) indexes were calculated in these subjects using the updated HOMA2 method, an improved version of the original HOMA1 method. The disposition index, calculated as the product of HOMA-%S by HOMA-%B, reflects the overall homeostatic ability of an individual using static measurements such as fasting plasma glucose and insulin.
Maastricht’s Cohort: Participants at Increased Risk of Developing Diabetes
Patients at high risk of developing diabetes participated in 3 different studies at Maastricht University: ReFdR study (n = 12) (19); ACCT study (n = 11) (20), and HIIT study (n = 7) (unpublished). Their clinical characteristics are provided in Table S4 (18).
Overall, after an overnight fast, blood samples were drawn in the fasting state for measurements of plasma HbA1c, plasma glucose, and serum insulin; and at times 0, 90, and 120 minutes for measurement of serum insulin and plasma glucose for calculation of glucose clearance as defined by the oral glucose insulin sensitivity model (21).
The increased risk for T2D was defined as follows: (1) in participants from the ReFDR study, it was defined as having at least 1 first-degree relative with T2D, body mass index (BMI) between 27 and 35 kg/m2, and disrupted glucose homeostasis defined as glucose clearance calculated using the oral glucose insulin sensitivity model of ≤ 350 mL/kg/min; (2) in participants from the ACCT study, it was defined as having plasma glucose level between 7.8 and 11.1 mmol/L 2 hours after an oral glucose tolerance test (OGTT); (3) in participants from the HITT study, it was defined as having glucose clearance calculated using the oral glucose insulin sensitivity model of ≤ 350 mL/kg/min and/or a plasma glucose level between 7.8 and 11.1 mmol/L 2 h after an OGTT.
Inclusion and exclusion criteria for the ReFdR study (19) and ACCT study (20) have been described previously. Patients from the HIIT study had low physical activity (< 150 minutes of moderate physical activity per week), a stable body weight over the past 3 months (no more than 3 kg gain or loss), no diagnosed T2D or active cardiovascular disease, no use of beta-blockers, and a limited alcohol consumption (no more than 3 U/d).
Rome’s Cohort: Participants With Partial Pancreas Resection
Subjects (8 females; 6 males; mean age 59.9 years ± 13.1 SE) undergoing pylorus-preserving pancreatoduodenectomy (n = 14) were recruited from the Digestive Surgery Unit and studied at the Centre for Endocrine and Metabolic Diseases unit (both at the Agostino Gemelli University Hospital, Rome, Italy). Clinical characteristics are provided in Table 1. The study protocol (ClinicalTrials.gov Identifier: NCT02175459) was approved by the local ethics committee (P/656/CE2010 and 22573/14), and all participants provided written informed consent, which was followed by a comprehensive medical evaluation.
Clinical and OGTT-derived metabolic characteristics of patients before and after partial pancreaticoduodenectomy
| Subject characteristics | Baseline | After surgery | P value |
|---|---|---|---|
| Gender (M:F) | 6:8 | ---- | --- |
| Mean age (y) | 59.9 ± 13.1 | ---- | --- |
| BMI (kg/m2) | 25.6 ± 1.1 | 23.1 ± 0.9 | .22 |
| Fasting glucose (mmol/L) | 5.21 ± 0.19 | 5.77 ± 0.36 | .16 |
| Fasting insulin (μIU/mL) | 5.56 ± 0.79 | 5.23 ± 1.77 | .92 |
| Mean insulin (IU/L) | 370 ± 46.8 | 87.2 ± 17.7 | .001 |
| Fasting C-peptide (ng/mL) | 2.10 ± 0.37 | 2.02 ± 0.45 | .88 |
| Insulinogenic index | 0.79 ± 0.16 | 0.16 ± 0.06 | .001 |
| Disposition index (Matsuda index * insulinogenic index) | 2.21 ± 0.36 | 1.66 ± 0.57 | .43 |
| HbA1c % (mmol/mol) | 5.41 ± 0.19 (35.6 ± 1.9) | 6.77 ± 0.40 (50.0 ± 4.4) | .008 |
Data are means ± SE or n (gender distribution), P value < .05 is considered statistically significant.
Abbreviations: BMI, body mass index; F, female; HbA1c, hemoglobin A1c; M, male; OGTT, oral glucose tolerance test.
Indications for surgery were: periampullary tumors, pancreatic intraductal papillary tumors, mucinous cystic neoplasm of the pancreas, and nonfunctional pancreatic neuroendocrine tumors. None of the patients enrolled had a known history of diabetes before the preoperative screening. Only patients with normal cardiopulmonary and kidney function, as determined by medical history, physical examination, electrocardiography, estimated glomerular filtration rate, and urinalysis, were included. Altered serum lipase and amylase levels before surgery, as well as morphologic criteria for pancreatitis, were considered exclusion criteria. Patients with severe obesity (BMI > 40), uncontrolled hypertension, and/or hypercholesterolemia were also excluded (22, 23).
Pancreatoduodenectomy was performed according to the pylorus-preserving technique (24). Briefly, the pancreatic head, the entire duodenum, common bile duct, and gallbladder were removed en bloc, leaving a functioning pylorus intact at the gastric outlet. All adjacent lymph nodes were carefully removed. The continuity of the gastrointestinal tract was restored by an end-to-side pancreatojejunostomy. Further downstream, an end-to-side hepaticojejunostomy and an end-to-side pylorojejunostomy were performed. The volume of pancreas removed during the surgery is constant (~50%), as previously reported (25). Thus, this surgery represents a model of acute ~50% reduction of ß-cell mass (22, 26). Because of anatomical reasons (the head/right part of the pancreas is vascularized by branches of the gastroduodenal artery and the tail is vascularized by branches of the splenic artery), all patients undergoing pancreatoduodenectomy received virtually the same partial resection (50%), maintaining almost the same remaining portion of the endocrine pancreas. This surgery is therefore a unique way to examine the effects of a sudden decrease of functional ß-cell mass.
A standard 75-g OGTT was performed in all subjects before and after surgery 40 ± 7 days. The adequacy of the recovery period was determined based on the normalization of inflammatory parameters, such as C-reactive protein, erythrocyte sedimentation rate, stability of weight, absence of symptoms of abnormal intestinal motility, or exocrine pancreatic deficiency. Blood samples were drawn in the fasting state and at 30-minute intervals over the following 120 minutes for the measurements of plasma glucose, insulin, and C-peptide concentrations at 0, 30, 60, 90, and 120 minutes after glucose load.
To better define the relation between 1,5 A-G measurement and glucose metabolism and preexisting metabolic defects, we divided subjects according to their glucose tolerance, as determined by presurgery OGTT. According to the American Diabetes Association classification (27), subjects whose 2-hour postload glucose was below 7.8 mmol/L were defined as normal glucose tolerant, subjects whose 2-hour postload glucose was 7.8 to 11.1 mmol/L were defined as impaired glucose tolerant and subjects whose 2-hour postload glucose was higher than 11.1 mmol/L were defined as diabetic (T2D).
Hyperglycemic Clamp Procedure
Plasma glucose was clamped at a stable level of 125 mg/dL above fasting blood glucose concentration. The hyperglycemic clamp was started with a bolus dose of glucose 200 mg/mL (150 mg/kg) administered into the antecubital vein. Blood was drawn from a cannulated dorsal hand vein on the opposite arm. Every 5 minutes, venous plasma glucose was analyzed with a glucose analyzer and the infusion of 20% glucose was adjusted to achieve a stable glucose level of 125 mg/dL above the fasting value. Serum samples for insulin and C-peptide were drawn at 0, 2.5, 5, 7.5, 10, 15, 30, 60, 90, 120, 130, 140, and 150 minutes. At 120 minutes, a 5-g arginine bolus was administered to measure maximum C-peptide secretory capacity at a steady-state blood glucose concentration of 250 mg/dL. Arginine-stimulated ß-cell secretory capacity was calculated as incremental area under the curve of the insulin levels following arginine bolus (120 min–150 min) (28).
Matsuda indexes were calculated as indexes of whole-body insulin sensitivity based on insulin and glucose values obtained from the OGTT, whereas ß-cell function was evaluated by calculating the insulinogenic index as the change in insulin over the first 30 minutes divided by the change in glucose over the first 30 minutes (29). Integrated ß-cell function was also measured using the oral disposition index, calculated as the product of the insulinogenic index and the Matsuda index (30), which provides an assessment of insulin secretion in relation to insulin sensitivity.
Mouse Model With Progressive Loss of ß Cells
The ß cell-specific prohibitin-2 knockout mouse (ß-Phb2-/-) is a model of monogenic type 2 diabetes with progressive decline of ß-cell function and survival initiated by mitochondrial dysfunction, leading to the spontaneous and gradual development of diabetes, not requiring diabetogenic diets or drug treatments (31). At the age of 4 to 5 weeks, ß-Phb2-/- mice have normal levels of blood glucose and by the age of 6 weeks they develop hyperglycemia, ultimately resulting in severe diabetes by the age of 10 weeks (10, 31).
Immunohistochemical Analysis of Pancreas Samples
For mouse tissues (authorization #GE/128/15) collected on sacrifice from a previous study (10), pancreas was fixed in paraformaldehyde and embedded in paraffin and sections of 5 µm were analyzed by immunohistochemistry for the detection of insulin (RRID:AB_10013624) and glucagon (RRID:AB_259852), as detailed previously (10). The ß-cell area was expressed as the percentage of total pancreas section area.
For human tissue, a pancreatic sample was collected during the surgery from the downstream edge of the surgical cut. Pancreas samples were fixed in formaldehyde and embedded in paraffin for subsequent analysis. Sections of 5 µm were stained by immunohistochemistry for insulin (8). The hematoxylin/eosin slides were examined in all cases by 2 pathologists to exclude cases with pancreatitis, autolysis, and tumor infiltration. Primary antibodies were the following: insulin (guinea pig antibody, Abcam 1:200, RRID:AB_306130) and glucagon (mouse monoclonal, Sigma-Aldrich 1:500, RRID:AB_259852), whereas secondary antibodies were: donkey anti-GP-594 (RRID:AB_1287151) and donkey anti–mouse-AMCA (RRID:AB_2687442), respectively. Regarding morphometric analysis, the ß-cell area was analyzed as described previously (8). Each section was analyzed separately by measuring total insulin positive area, as well as the total pancreas section area, using Image Pro Plus software version 4. 5.1 (Media Cybernetics, Silver Spring, MD).
Measurement of Circulating 1,5-AG Levels in Blood Samples
We measured circulating 1,5-AG in samples that were drawn in the fasting state and stored at -80°C (details on blood collection are given in Table S1 (18)). For the analysis of 1,5-AG, we used a 2-step enzymatic colorimetric assay (GlycoMark, New York, NY) implemented on a FlexStation 3 Multimode microplate reader (Molecular Devices, San Jose, CA) at Geneva University. This method detects hydrogen peroxide following the oxidation of 1,5-AG by pyranose oxidase. Because glucose could interfere with this reaction, the samples were first exposed to glucokinase to convert glucose to glucose-6-phosphate, a dead-end metabolite in this assay. Measurements of 1,5-AG is not affected by meal or exercise; thus, variations in time of the day for sampling does not influence this measurement (16).
Statistics
Data analysis and graphical representations were performed with Graph Pad Prism software version 8.4.2 (San Diego, CA). One-way ANOVA was used in intergroup comparisons of variables with Tukey post hoc test for multiple comparisons, unless otherwise specified. Normality of the variables was assessed according to the D’Agostino and Pearson test. Pearson correlation coefficient (r) was used with Gaussian distribution, whereas Spearman correlation coefficient (r) was calculated when the distribution was not normal. The coefficients that have been used in each case are specified in the figure legends. A P value < 0.05 was considered statistically significant. Receiver operating characteristic (ROC) curve analysis was performed to determine the best discrimination power for 1,5-AG, HbA1c, fasting glucose, and the combination of all into a prediction variable. The prediction variable was established using a multiple regression model. The area under the ROC curve (area under the curve), sensitivity, and specificity, were obtained to assess discriminating accuracy.
Outliers were considered as over 1.5 interquartile ranges below the first quartile (Q1) or above the third quartile (Q3) in the data set.
Results
Plasma 1,5-AG Concentration Correlates With the ß-cell Mass
Mice lacking ß-Phb2−/− exhibit a spontaneous and progressive loss of ß cells, ultimately leading to diabetes by the age of 6 weeks onward (10, 31). Although essentially asymptomatic, the prediabetic stage (4-6 weeks of age) was accompanied by a marked reduction of plasma 1,5-AG concentrations (-39%, P = 0.001; Fig. 1A). In ß-Phb2−/− mice, the critical 3-week period over the age of 4 to 6 weeks is characterized by a gradual loss of the ß-cell mass, as documented previously (10). Taking into consideration the whole cohort of mice, the ß-cell mass assessed by immunohistochemistry positively correlated with circulating levels of 1,5-AG (P = 0.06, Fig. 1B, C). As a proof of concept, 2 human subjects were included showing values in a similar range (Fig. 1B, D).
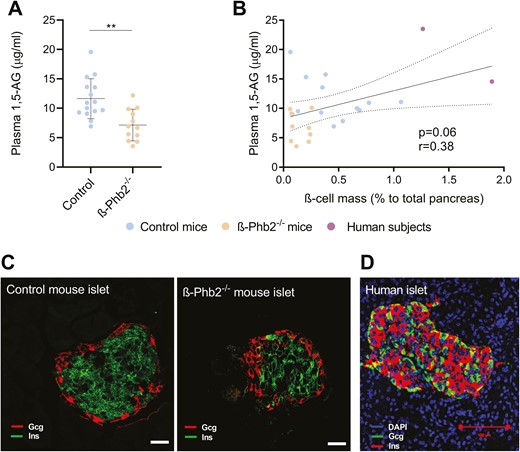
Assessment of the ß-cell mass and plasma concentrations of 1,5-anhydroglucitol (1,5-AG) in mice and humans. (A) Plasma 1,5-AG concentrations of control and ß-Phb2-/- mice of 4 to 6 weeks of age. Values are means ± SD, **P = 0.001 after unpaired t test. (B) Linear correlation between 1,5-AG levels and the ß-cell mass assessed on pancreatic sections by immunohistochemistry and quantified as the percentage of insulin-positive area to total pancreas area in control and ß-Phb2-/- mice (4-6 weeks of age), as well as 2 human subjects with partial pancreas resection (1,5-AG values correspond to the presurgery state); r = Spearman coefficient. (C, D) Representative images of islets on pancreatic sections with immunofluorescence staining for insulin (Ins, green) and glucagon (Gcg, red) for (C) control and ß-Phb2-/- mouse pancreas (scale bar = 20 µm) and (D) a human subject (Ins, red; Gcg, green) with partial pancreas resection (scale bars = 100 µm).
Circulating Levels of 1,5-AG Are Reduced in the Diabetic State Regardless of Glycemic Control
Circulating levels of 1,5-AG were then analyzed in cohorts of participants with established diabetes (T2D, n = 42); in T2D patients on insulin therapy (T2D insulin Tx, n = 12); in participants classified as being at high risk of developing T2D (preT2D, n = 29; see Methods), and in participants with normal glucose control (healthy, n = 100). Tables S2 and S3 provide clinical characteristics of the participants (18).
Circulating levels of 1,5-AG were significantly reduced in patients with established T2D compared with healthy participants (-46%, P < 0.0001). T2D patients requiring insulin therapy exhibited a more pronounced reduction of 1,5-AG (-64%, P < 0.0001), suggesting disconnection between 1,5-AG levels and circulating insulin per se as well as with a tight glycemic control (Fig. 2A). However, participants classified at high risk of developing T2D according to criteria defined previously showed an average level of 1,5-AG similar to healthy control subjects (Fig. 2A). We next explored correlations between circulating 1,5-AG levels and the different metabolic parameters determined in these participants, revealing specific intergroup correlation profiles. Of interest, 1,5-AG levels negatively correlated with HbA1c and fasting plasma glucose in an exponential way (P < 0.0001; Fig. 2B and C, Figure S1 (18)). More specifically, the exponential correlation between 1,5-AG and these 2 variables was contributed by the T2D group (P < 0.0001 and P = 0.002, respectively; Figure S2 (18)).

Markers of diabetes in healthy subjects, participants classified as being at high risk of developing T2D (preT2D), type 2 diabetic patients (T2D), and T2D patients on insulin therapy (T2D insulin Tx) from the Geneva and the Maastricht cohorts. (A) Circulating 1,5-anhydroglucitol (1,5-AG) levels measured in the different subpopulations. Correlations between circulating 1,5-AG and (B) blood HbA1c or (C) fasting plasma glucose. Details on blood collection are provided in Table S1. Abbreviation: DT, diabetes threshold. ***P < 0.001, ****P < 0.0001.
We next analyzed the potential of 1,5-AG to discriminate for T2D compared with the gold standards HbA1c and fasting plasma glucose. ROC curves were calculated for each parameter, as well as a prediction variable calculated by combination of all the other variables by multiple regression (Figure S3 (18)). All of these blood parameters were able to discriminate T2D patients from healthy subjects (P < 0.0001), albeit differing in performance. HbA1c (Figure S3C (18)), fasting plasma glucose (Figure S3D (18)) and the prediction variable (Figure S3E (18)) showed similar discrimination power (area under the ROC curves of 0.90 in all cases; CI, 0.84-0.95; 0.85-0.95; and 0.85-0.96, respectively), which was lower for 1,5-AG (area under the ROC curve of 0.80, CI, 0.72-0.88; Figure S3B (18)). Overall, 1,5-AG could discriminate for established T2D but did not provide an added value vs gold standard criteria commonly used in the clinical practice.
We also explored the relationship between 1,5-AG levels and other parameters such as the BMI and in particular obesity without T2D that may positively affect the ß-cell mass (Fig. 3A-C). Although there was no correlation between the BMI and 1,5-AG levels in T2D patients, there was a positive correlation in healthy overweight participants with normal glucose control (P = 0.004), with the highest 1,5-AG values being measured in non-T2D obese subjects with a BMI above 30 kg/m2 (Fig. 3A). Conversely, patients with a short history of T2D but already requiring insulin therapy tended to cluster in the lower range of circulating 1,5-AG levels (Fig. 3D). This set of data indicates that 1,5-AG levels inversely correlate with the functional ß-cell mass, independently of the actual circulating insulin. In agreement with this observation, 1,5-AG levels strongly correlated with the HOMA index of ß-cell function (HOMA-%B, Fig. 4A); as well as with the disposition index of static measures (P < 0.0001, Fig. 4B). However, 1,5-AG levels did not correlate with the HOMA index of insulin sensitivity (HOMA-%S, Fig. 4C). Of note, specifically and only in non-T2D healthy participants, circulating 1,5-AG negatively correlated with HOMA-%S (P = 0.03, Figure S4 (18)). This points to a compensatory insulin supply (Fig. 4D) supported by increased ß-cell mass, uncovered by higher levels of 1,5-AG.
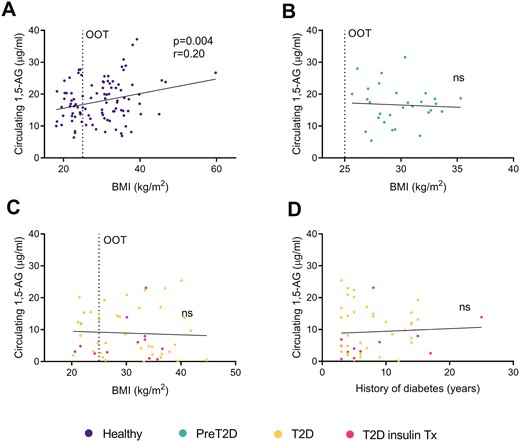
Linear correlations between circulating 1,5-anhydroglucitol (1,5-AG) levels and body mass index (BMI), in (A) healthy subjects, (B) preT2D participants, and (C) T2D patients from the Geneva and the Maastricht cohorts. (D) Linear correlation between circulating 1,5-AG levels and history of diabetes. Details on blood collection are provided in Table S1. Abbreviations: ns, not significant; OOT, overweight + obesity threshold.
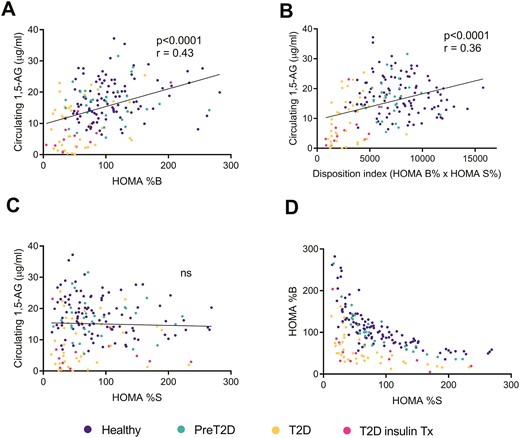
Linear correlation between circulating 1,5-anhydroglucitol (1,5-AG) levels and (A) the estimate of insulin secretion (HOMA %B), (B) the disposition index of static measures (HOMA %B × HOMA %S), and (C) insulin sensitivity (HOMA %S) in healthy subjects, preT2D participants, and T2D patients from the Geneva and the Maastricht cohorts. (D) Estimate of insulin secretion (HOMA %B) plotted against insulin sensitivity (HOMA %S) of the same cohorts. HOMA indexes were calculated using the HOMA2 method integrating fasting plasma glucose and fasting serum insulin values. Details on blood collection are provided in Table S1. Abbreviation: ns, not significant.
Hemipancreatectomy Induced a Marked Reduction in 1,5-AG Levels Regardless of Glycemic Control
Patients without preoperative documented history of diabetes were recruited for pancreatoduodenectomy based on tumor diagnostic (n = 14, Rome’s cohort). Subjects were divided according to their glucose tolerance status as determined by an OGTT performed 1 week before the surgical procedure. The cohort was then stratified as follows: non-T2D (normal glucose tolerant, n = 4), glucose-intolerant (impaired glucose tolerant, n = 7), and newly diagnosed T2D (n = 3) patients (Fig. 5A-B). There was a negative correlation between 1,5-AG levels and fasting plasma glucose (Fig. 5C), which was positive regarding the disposition index (P = 0.04, Fig. 5D) and the insulinogenic index (P = 0.04, Fig. 5E). This suggests that, before the surgical intervention, ß-cell function was impaired in some of the patients, associated with lower 1,5-AG levels. The circulating levels of 1,5-AG also correlated with age (P = 0.01, Fig. 5F), potentially reflecting a progressive age-dependent decline of the ß-cell mass. Further, a direct correlation was found with incremental area under the curve of arginine stimulated insulin secretion (P = 0.01, Fig. 5G) used as an indirect measure of functional ß-cell mass.
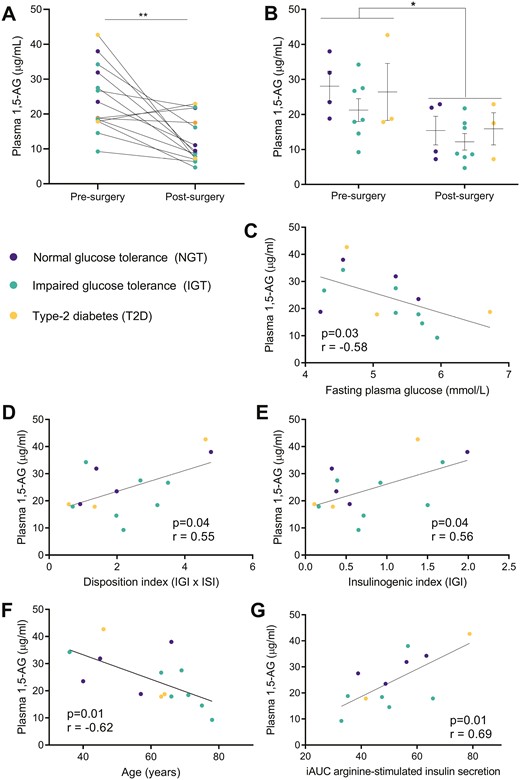
Changes in circulating 1,5-anhydroglucitol (1,5-AG) levels in pancreatectomized patients (Rome’s cohort). Values of plasma 1,5-AG levels before and after partial pancreatectomy plotted (A) for the whole cohort (paired t test) and (B) according to the glucose tolerance status of the patients as determined before surgery (NGT, normal glucose tolerance; IGT, impaired glucose tolerance; T2D, type 2 diabetes) (1-way ANOVA). Linear correlations before surgery between plasma 1,5-AG levels and (C) fasting plasma glucose, (D) insulinogenic index, (E) disposition index of continuous measurements (defined as the product of Matsuda and insulinogenic indexes), (F) age, and (G) iAUC (incremental area under the curve) of arginine-stimulated insulin secretion. Details on blood collection are provided in Table S1; *P = 0.01, **P = 0.002; r = Pearson coefficient for panels D, E, F, and G; r = Spearman coefficient for panel C.
We then compared plasma 1,5-AG levels before and after pancreatoduodenectomy.
All subjects were evaluated 1 week presurgery and 40 ± 7 days (34-48 days) postsurgery. As expected, pancreaticoduodenectomy resulted in lower insulin secretory capacity, as revealed by decreases of the mean insulin levels during OGTT and of the insulinogenic index (Table 1). Importantly, there was a 50% reduction of circulating 1,5-AG levels following pancreaticoduodenectomy (Fig. 5A, 12.2 ± 6.4 vs 24.3 ± 9.6 µg/mL, P = 0.002). This reduction was observed regardless the glucose tolerance status of the patients before the surgical procedure (Fig. 5B).
Discussion
A sensitive and robust biomarker of the functional ß-cell mass is an unmet medical need because the noninvasive imaging of ß-cells is not yet available at the clinical level (32). Using metabolomics, we previously showed in rodents that 1,5-AG blood levels are gradually reduced with the progressive loss of functional ß cells, both the in lean monogenic ß-Phb2−/− mice and the obese db/db (leptin receptor mutant) mice. These 2 distinct mouse models require neither chemical nor dietary treatments to induce a spontaneous and gradual decline of their functional ß-cell mass, ultimately resulting in diabetes development. Importantly, the lowering of circulating 1,5-AG occurs secondary to a reduction of the functional ß-cell mass, although before and independently of signs of diabetes such as hyperglycemia (10).
Based on such rodent evidence, we next sought for a putative corresponding relevance in different human cohorts (ie, patients with established diabetes [T2D] and subjects considered at high risk of developing diabetes [preT2D], as well as patients with no documented history of diabetes who underwent partial pancreatectomy). Plasma 1,5-AG levels were significantly reduced after acute removal of the ß-cell mass accompanying the pancreatectomy, in a proportion similar to the resection and regardless of the glucose tolerance status. In addition, commonly used clinical parameters used to estimate the ß-cell function correlated only before surgery with 1,5-AG, pointing to the latter as a reliable biomarker of the functional ß-cell mass. In patients with established T2D, we confirmed previously reported low levels of circulating 1,5-AG levels (11-15, 17, 33), correlating with fasting plasma glucose and HbA1c. However, compared with the latter gold standards being directly associated with glycemic control, 1,5-AG levels exhibited specific properties (eg, particularly low in T2D patients rapidly requiring insulin therapy and, conversely, high in obese subjects who maintained glucose tolerance). Indeed, 1,5-AG levels positively correlated with BMI and HOMA-%S in healthy participants, with the highest values measured in obese though normoglycemic subjects, whereas no correlation was found with glucose uptake measured during hyperinsulinemic euglycemic clamp (data not shown). This might reflect a compensatory expansion of the ß-cell mass in nondiabetic obese individuals, as previously shown in pancreases obtained by surgical resections or from postmortem specimens (5). In particular, it has been proposed that the ß-cell mass may expand by 10% to 30% for each 10 kg of weight increment (34).
Before diabetes, 1,5-AG values below a specific threshold of 11 to 12 µg/mL (16, 35) may indicate reduced ß-cell mass in preT2D individuals, whereas at this stage none of the classical metabolic parameters, such as fasting plasma glucose or HbA1c, can catch this event. According to an American Diabetes Association expert panel, up to 70% of individuals with prediabetes will eventually develop diabetes in their lifetime (36). Although 1,5-AG absolute values were not significantly different in subjects classified as preT2D compared with healthy participants, a relative lowering of plasma 1,5-AG in a patient at risk of developing diabetes may indicate the active loss of functional ß cell; eventually supporting more drastic prevention measures.
The close relationship between the ß-cell mass and circulating 1,5-AG levels, originally uncovered in mouse models (10), was confirmed through the longitudinal observation of patients undergoing resection of half of their pancreas. Indeed, this imposed loss of ß cells was accompanied with both the lowering of individual 1,5-AG values, regardless of the glucose tolerance of the patients, and a worsening of the secretory capacity, in line with previous reports (37). Further, arginine-stimulated insulin secretion, as an estimate of functional ß-cell mass and measured in the same cohort before surgery (28), was directly associated with increasing levels of 1,5-AG. The correlation between the ß-cell mass and 1,5-AG levels, independent of glucose control, is also illustrated in type 1 diabetes patients having lower 1,5-AG values than T2D patients, while exhibiting similar HbA1c values and euglycemia (15). Moreover, 1,5-AG levels are not recovered by exogenous insulin therapy (38, 39).
The primary route for 1,5-AG disposal is urinary excretion, whereas 99.9% of it is reabsorbed in renal tubules by the SLC5A9-encoded sodium/glucose active cotransporter 4 (40, 41). It was proposed that such a reabsorption is competitively inhibited by glucose when glycemia exceeds the renal threshold for glucosuria (> 10 mmol/L), promoting 1,5-AG urinary excretion and lowering of its circulating levels (14). Of note, low blood 1,5-AG was identified as the most reliable indicator to identify T2D patients being responsive to treatment with SLC5A2/SGLT2 inhibitors and efficient HbA1c reduction, regardless of the estimated glomerular filtration rate (42). This is in line with our observation (ie, a close association between 1,5-AG levels and poor glucose control in patients with established T2D), although not in nondiabetic subjects. In other words, the loss of ß cells was necessary and sufficient to decrease circulating 1,5-AG, not requiring hyperglycemia. The mechanisms underlying the association between ß-cell mass and 1,5-AG levels remain to be uncovered. In prediabetic mice, early changes in hepatic 1,5-AG, which is in equilibrium with plasma 1,5-AG, point to an islet-liver axis regulating hepatic 1,5-AG turnover through communication between pancreatic ß cells and hepatocytes (10).
In conclusion, the present study corroborates in human subjects the original identification in rodents of circulating 1,5-AG as a reliable biomarker of potential changes in the ß-cell mass with a simple blood sampling. Plasma levels of 1,5-AG decrease as a consequence of a reduction of the functional ß-cell mass, already ahead of the onset of diabetes and regardless the glucose tolerance status of the subject.
Abbreviations
- 1,5-AG
1,5-anhydroglucitol
- β-Phb2-/-
ß cell-specific prohibitin-2 knockout mouse
- BMI
body mass index
- HbA1c
hemoglobin A1c
- HOMA
Homeostatic Model Assessment
- OGTT
oral glucose tolerance test
- ROC
receiver operating characteristic
- T2D
type 2 diabetes
- Tx
treatment
Acknowledgments
The authors thank the contribution of several colleagues who made blood samples and clinical data available; in particular, Steven A. Brown (University of Zurich), Ngoc-Hien Du (University of Zurich), Jacques Philippe (University Hospital of Geneva), and Alain Golay (University Hospital of Geneva). The most precious contribution of present and past members of the laboratory is acknowledged. The authors are grateful to the company GlycoMark that provided the kits to measure 1,5-AG in human samples.
Financial Support
The research was funded by the State of Geneva, the Swiss National Science Foundation (#31003A_166625 to P.M., 310030_184708/1 to C.D., and CRSII3_160741 to S.A.B. and J.P.), the Bo & Kerstin Hjelt Diabetes Foundation and Fundación Alfonso Martín Escudero (to C.J.S.), the Young Independent Investigator Grant SGED/SSED (to F.S.), the EFSD/Novo Nordisk Programme for Diabetes Research in Europe 2020 (to C.D.), the Leenaards Foundation and the Vontobel Foundation (to C.D.). The study was also supported by grants from the Università Cattolica del Sacro Cuore, Rome (Fondi Ateneo Linea D.3.2, Fondi Ateneo Linea D.1, anno 2019 and Fondi Ateneo Linea D.1, anno 2020 and 2021); the Italian Ministry of Education, University and Research (GR-2018-12365577 to T.M. and RF-2019-12369293 to A.G.), and the Italian Ministry of University and Research (PRIN 2020SH2ZZA to A.G.).
Disclosures
No potential conflicts of interest relevant to this article were reported.
Data Availability
The datasets generated during and/or analyzed during the current study are available from the corresponding author upon reasonable request.
References
Author notes
These authors contributed equally to this work.
