


Abstract
Conventional prediction models for vitamin D deficiency have limited accuracy.
Using cross-sectional data, we developed models based on machine learning (ML) and compared their performance with those based on a conventional approach.
Participants were 5106 community-resident adults (50-84 years; 58% male). In the randomly sampled training set (65%), we constructed 5 ML models: lasso regression, elastic net regression, random forest, gradient boosted decision tree, and dense neural network. The reference model was a logistic regression model. Outcomes were deseasonalized serum 25-hydroxyvitamin D (25(OH)D) <50 nmol/L (yes/no) and <25 nmol/L (yes/no). In the test set (the remaining 35%), we evaluated predictive performance of each model, including area under the receiver operating characteristic curve (AUC) and net benefit (decision curves).
Overall, 1270 (25%) and 91 (2%) had 25(OH)D <50 and <25 nmol/L, respectively. Compared with the reference model, the ML models predicted 25(OH)D <50 nmol/L with similar accuracy. However, for prediction of 25(OH)D <25 nmol/L, all ML models had higher AUC point estimates than the reference model by up to 0.14. AUC was highest for elastic net regression (0.93; 95% CI 0.90-0.96), compared with 0.81 (95% CI 0.71-0.91) for the reference model. In the decision curve analysis, ML models mostly achieved a greater net benefit across a range of thresholds.
Compared with conventional models, ML models predicted 25(OH)D <50 nmol/L with similar accuracy but they predicted 25(OH)D <25 nmol/L with greater accuracy. The latter finding suggests a role for ML models in participant selection for vitamin D supplement trials.
There is growing evidence from randomized controlled trials (RCTs) that the health benefits of vitamin D supplementation are greatest in (or even limited to) individuals with vitamin D deficiency (1). For example, a meta-analysis showed that vitamin D supplementation reduced the rate of corticosteroid-treated asthma exacerbations in people with blood 25-hydroxyvitamin D (25(OH)D) of <25 nmol/L but not ≥25 nmol/L (2). Other RCT research showed that vitamin D has beneficial effects on bone density that are limited to those with 25(OH)D ≤30 nmol/L (3, 4). This is consistent with Mendelian randomization analyses, which have demonstrated that 25(OH)D is most strongly associated with mortality at levels <25 nmol/L (5).
More research is needed from RCTs focused on people with vitamin D deficiency, with sufficient sample size to ensure adequate statistical power (1). Identifying people for recruitment into such trials is a challenge for multiple reasons. First, measuring blood 25(OH)D on each potential participant is expensive and can be time-consuming—particularly with large sample sizes. Second, using a baseline 25(OH)D test to identify individuals with vitamin D deficiency would make it unethical to include such people into a long-term placebo group. While shorter RCTs might still be permissible, long-term trials would not include a placebo group. Lastly, the common practice of deferring plasma 25(OH)D testing until trial completion permits enrollment of people with vitamin D deficiency, but allows the enrollment of individuals with adequate vitamin D status (6).
Predicting vitamin D deficiency with readily accessible clinical characteristics offers an alternative that circumvents these 25(OH)D testing issues. Equations for predicting vitamin D deficiency have been developed in several studies based on logistic regression (7-15). However, in addition to including variables that are routinely collected in clinical settings and thus accessible from patient databases (eg, season, demographics, and body size), the models include variables that are not routinely available (eg, sun exposure); the latter variables must be attained by recruiting and interviewing participants. Some studies also include genetic factors, which adds another level of complexity (16). These less accessible factors create a practical barrier (by affecting financial cost and time) when applying these models to large groups of people to identify those to be included in RCTs of individuals with vitamin D deficiency. Further, model discrimination performance is moderate overall, with area under the receiver operating characteristic curve (AUC) values being mostly <0.80 and ranging from 0.69 to 0.82 (7-11, 14). Thus, there is need for improved prediction models to help improve the efficiency of recruitment into vitamin D supplement RCTs.
Machine learning (ML) is a statistical method that offers an alternative approach to standard prediction modeling and can yield more stable and improved predictions (17, 18). A distinct advantage of ML models (over commonly used logistic models (7-15)) is their use of hyperparameters: parameters that can be tuned to select models that are optimal prior to their fitting. For example, the hyperparameters of some ML models allow them to inherently perform feature selection, which has been shown to improve prediction (17). To date, 1 study has applied ML to predict vitamin D deficiency (25(OH)D <50 nmol/L) and found that the diagnostic accuracy (AUC = 0.86) was nonsignificantly higher than that with an ordinal linear regression model (AUC = 0.79) (19). However, the improvement relative to logistic regression (the standard method for modeling vitamin D deficiency (7-14)) is unknown as this technique was not reported. Further, that study investigated 1 ML algorithm only (support vector regression), their models comprised a limited number of predictors (n = 12), and there was no assessment of vitamin D deficiency based on a lower 25(OH)D threshold (eg, 25 nmol/L) (19). A small number of other studies modeled vitamin D deficiency using ML (20-22), but did not compare performance with a traditional model.
To address this knowledge gap, we compared the abilities of ML algorithms and a conventional model (logistic regression) to predict vitamin D deficiency. We hypothesized that ML could better predict vitamin D deficiency than predictions based on logistic regression. To build on prior work, we (1) adjusted 25(OH)D for season (instead of the traditional approach of using measured (unadjusted for season) 25(OH)D (7-14, 20-22)) for the vitamin D deficiency outcome, and (2) developed models based solely on information in patient databases (as well as other models with additional variables to improve prediction). We sought to provide a rapid, computer-based, and inexpensive method to accurately identify individuals with vitamin D deficiency for future recruitment into vitamin D supplement trials.
Materials and Methods
Design, Setting, and Participants
We performed a cross-sectional analysis of data collected (between 2011 and 2012) at baseline of participants in the ViDA (Vitamin D Assessment) study. ViDA was a randomized, double-blinded, placebo-controlled trial of the health effects of vitamin D supplementation. Inclusion criteria were men and women from family practice registers (mainly) and community groups, aged 50-84 years, and resident in Auckland at recruitment. Exclusion criteria included (1) diagnosis of a terminal illness or in hospice care; (2) aiming to leave New Zealand during the follow-up period; (3) taking vitamin D supplements (including cod liver oil) of >600 IU daily if aged 50-70 years or >800 IU daily if aged 71-84 years; (4) history of renal stones, hypercalcemia, or medical conditions that can cause hypercalcemia; and (5) baseline serum calcium >2.50 mmol/L. Ethics approval was granted from the New Zealand Multi-region Ethics Committee (MEC/09/08/082). Informed, written consent was obtained from each participant. Full study design details are described elsewhere (23).
Interview
All measurements were performed by trained staff using a standardized protocol. Questionnaires administered by interviewers were used to collect data on sociodemographic status (age, sex, self-reported ethnicity, home setting, marital status, and employment status), perceived general health, medical history told by a physician (including diabetes, hypertension, coronary heart disease, cardiac failure, stroke, carotid stenosis, and hyperlipidemia), current medication prescribed by a physician, intake of vitamin D supplements (≤600 IU/day if aged 50-70 years; ≤800 IU per day if aged 71-84 years), and lifestyle (sun exposure and usual leisure time physical activity during the past 3 months, smoking, and alcohol drinking during the past 12 months). The questions used to capture these data are listed elsewhere (Table 1 (24)). We used each participant’s place of residence to calculate the 2013 New Zealand Deprivation Index (NZDep13), a proxy measure of social deprivation created from the 2013 census data with values ranging from 1 (least deprived) to 10 (most deprived) (25). Without shoes and in light clothing, height (±0.1 cm) was measured with a stadiometer, and weight (±0.1 kg) with digital scales. Body mass index (BMI) was calculated as weight (kg)/height (m)2. After 15 minutes of rest while sitting, blood pressure (BP; ±1 mmHg) was measured 3 times with an Omron T9P oscillometric device (Omron Healthcare, Kyoto, Japan) placed above the cubital fossa of the left arm; the mean of the 2 nearest readings were used for analyses. Hypertension was defined as a systolic BP of ≥140 mmHg, a diastolic BP of ≥90 mmHg, or being on an antihypertensive medication. Blood samples were collected and plasma aliquots were stored frozen at –80°C.
Circulating 25(OH)D, Albumin, and Creatinine
Serum 25(OH)D (combining D2 and D3) concentration was measured in the plasma aliquots by liquid chromatography–tandem mass spectrometry (ABSciex API 4000, Framingham, MA) with 12.7% interassay coefficient of variation at a laboratory participating in the Vitamin D External Quality Assessment Scheme (DEQAS) program (www.deqas.org). Serum albumin was measured by dye binding using bromocresol green reagents on an Advia 2400 analyzer (Siemens Healthcare Diagnostics). Plasma creatinine was measured by the classical Jaffe reaction using Abbott reagents on an Abbott c series analyzer (Abbott, IL, USA).
Statistical Analysis
Deseasonalized (season-adjusted) 25(OH)D was calculated for each participant from the mid-point between the estimated maximum and minimum 25(OH)D over a calendar year, from their individual measured baseline 25(OH)D and date of blood collection, using a sinusoidal model with parameters derived from baseline values for all participants (26). The 2 primary outcomes were defined as a baseline deseasonalized 25(OH)D of <50 nmol/L and <25 nmol/L. Definitions of vitamin D deficiency vary but thresholds are typically within this range (27). For example, the US Institute of Medicine considers <30 nmol/L as being “at risk for vitamin D deficiency” (28).
So that we could predict vitamin D deficiency from patient databases (eg, those of general practice clinics) without needing to actually interview patients (to collect factors in the more complete multivariable models), we developed models based solely on variables in these patient databases. We labelled these as “simple models” and their predictors included age, sex, ethnicity (Maori, Pacific, or South Asian vs European/other), NZDep13, hypertension, urgent treatment for asthma, or chronic bronchitis/emphysema in past 12 months, diabetes mellitus, cardiovascular disease, antihypertensive treatment, smoking status (ex- or current smoker vs nonsmoker), BMI, and systolic BP (7-14, 29). To improve prediction, we developed a second set of models, which we labelled as “augmented models,” based on the abovementioned predictors plus additional ones: marital status (separated/divorced and living alone, widow/widower, or never been married/partnered vs currently married/partnered), self-rated general health (good or fair/poor vs excellent/very good), vitamin D supplementation, sun exposure (hours/day), vigorous physical activity (hours/week), alcohol intake, serum albumin, and plasma creatinine (7-14).
Using an outcome-stratified splitting method, we randomly divided the study sample into a training set (65% of the sample) and a test set (remaining 35% of the sample). In the training set, we developed 6 models for the 2 binary outcomes (deseasonalized 25(OH)D <50 or <25 nmol/L) using the abovementioned predictors—namely a reference model (logistic regression) and 5 ML models.
The 5 ML models were (1) logistic regression with lasso regularization (lasso regression), (2) logistic regression with elastic net regularization (elastic net regression), (3) random forest, (4) gradient boosted decision tree, and (5) dense neural network models. These were selected because of their diversity and use of modern techniques (eg, gradient boosting), and their popularity and good performance in the ML literature (17). Lasso regression is an extension of regression-based models that has an ability to shrink (or regularize) the predictor coefficients toward 0, thereby effectively selecting important predictors and improving interpretability of the model. Lasso regression computes the optimal regularization parameter (lambda) that minimizes the sum of least squares plus L1 shrinkage penalty using a cross-validation method. Elastic net regression is another regression-based model incorporating both lasso regularization and ridge regularization. Elastic net regression calculates the optimal regularization parameter that minimizes the sum of least squares plus weighted L1 shrinkage penalty and weighted L2 shrinkage penalty. We used R glmnet and caret packages for lasso regression and elastic net regression models. Random forest is an ensemble of decision trees generated by bootstrapped training samples with random predictor selection in tree induction. We created a hyperparameter tuning grid to identify the best set of parameters (number of variables randomly selected at each split, minimum size of terminal nodes, and size of sample to draw (30)) using cross-validation methods. We used R randomForest and caret packages to construct random forest models (fitted with 500 trees). Gradient boosted decision tree is another ensemble method that constructs new simple tree models predicting the errors and residuals of the previous model. When adding a new tree, this model uses a gradient descent algorithm that minimizes a loss function. We performed hyperparameter tuning (of number of boosting iterations, maximum tree depth, shrinkage, minimum loss reduction, subsample ratio of columns, minimum sum of instance weight, and subsample percentage (31)) sequentially using a 5-fold cross-validation method. We used R xgboost and caret packages to construct gradient boosted decision tree. Lastly, dense neural network is composed of multiple processing layers. Outcomes are modeled by intermediate hidden units, and each hidden unit consists of linear combination of predictors that are transformed into a nonlinear function. We used a 6-layer feedforward model by using hyperparameter tuning (eg, the number of hidden units, batch size, learning rate, learning rate decay, dropout rate, and number of epochs) with an Adam optimizer using the R Keras package (32). To minimize potential overfitting, we utilized several methods in these ML models—eg, regularizations (or penalizations) in lasso and elastic net regression models, out-of-bag estimation in random forest and gradient boosted decision tree models, drop out, ridge normalization, and batch normalization in dense neural network, and cross-validation in all models.
As for the predictor engineering methods of the ML models, we preprocessed predictors sequentially. First, we created quadratic terms of age, systolic BP, BMI, sun exposure hours, albumin, and creatinine. These quadratic terms were used only for regression-based ML models (ie, logistic regression models with lasso regularization and those with elastic net regularization). Second, we imputed the predictors with missing values using bagged tree imputation. Third, we converted the continuous predictors into normalized scales using Yeo–Johnson transformation. The categorical predictors were coded as dummy variables, and NZDep13 and physical activity variables were coded as ordinal variables. We used the R recipe package for this predictor preprocessing.
The predictive performance of each model was examined in the test set. Discrimination performance was assessed using the AUC with 95% CI. AUC values across models were compared using Delong’s test (33). We calculated integrated discrimination improvement (IDI) to assess differences in discrimination performance across models. IDI is calculated as (ISml – ISref) minus (IPml – IPref), where “IS” is the integral of sensitivity over all possible cut-off points from the (0, 1) interval, “IP” is the corresponding integral of (1 – specificity), “mL” refers to the ML model, and “ref” refers to the reference model (34). Thus, IDI represents the difference in improvement in average sensitivity and any increase in average “1 minus specificity” (34). To evaluate utility of the models in supporting clinical decision-making, we calculated net benefit from decision curve analysis, which incorporates the information on both the benefit of correctly predicting the outcome (true positives) and the relative harm of over-reporting it (false positives) (35). For example, after putting these benefits and harms on the same scale (by adjusting for their relative value), a net benefit of 0.04 means that, per 100 patients, there are 4 more benefits than harms (35). As decision curves, we made a graphical presentation of the net benefit over a range of threshold probabilities (or clinical preferences) of the outcome—for each model, for the default assumption that none are vitamin D deficient (not testing anyone for this outcome), and for the assumption that all are (testing everyone for vitamin D deficiency). As agreement of predictions across models can give greater confidence in predictions (36), we constructed a consensus ensemble model (for each outcome) that predicted “outcome present” when all models predicted the occurrence of the outcome. Across multiple thresholds, we graphically examined mean 25(OH)D in the sample that we predicted to have the outcome using this model and the reference model. We selected input features for models using the Boruta algorithm in the R Boruta package (37). This is an extension of the Random Forest (RF) classifier that iteratively removes features which are shown by a statistical test to be less relevant than random probes (37). A 2-sided P < .05 was considered statistically significant. We performed all analyses with R version 3.6.3.
Results
Table 1 shows the characteristics of the participants (n = 5106) by categories of 25(OH)D. Mean age was 66.3 years and 42% were female, with 1270 (25%) and 91 (2%) having a plasma 25(OH)D of <50 nmol/L and <25 nmol/L, respectively.
Characteristics of participants by categories of serum 25(OH)D concentration
| Characteristica | 25(OH)D, nmol/L | ||
|---|---|---|---|
| <25 (n = 91) | <50 (n = 1270) | ≥50 (n = 3836) | |
| Age (years) | 63.2 ± 9.2 | 66.6 ± 8.1 | 65.4 ± 8.8 |
| Female sex | 36 (40) | 598 (47) | 1540 (40) |
| Ethnicityb | |||
| European/Other | 33 (36) | 829 (65) | 3422 (89) |
| Maori (%) | 7 (8) | 105 (8) | 178 (5) |
| Pacific (%) | 11 (12) | 156 (12) | 167 (4) |
| South Asian (%) | 40 (44) | 180 (14) | 69 (2) |
| Marital statusb | |||
| Married/partnered or widow/widower | 64 (70) | 984 (77) | 3174 (83) |
| Separated/divorced and living without partner | 15 (16) | 193 (15) | 451 (12) |
| Never been married/partnered | 12 (13) | 93 (7) | 211 (6) |
| 2013 NZ Deprivation Index quintileb | |||
| 1 (least deprived) | 15 (16) | 355 (28) | 1592 (42) |
| 2 | 11 (12) | 241 (19) | 730 (19) |
| 3 | 20 (22) | 218 (17) | 648 (17) |
| 4 | 16 (18) | 166 (13) | 411 (11) |
| 5 (most deprived) | 29 (32) | 290 (23) | 455 (12) |
| Self-rated general health | |||
| Excellent or very good (%) | 53 (58) | 823 (65) | 3039 (79) |
| Good or fair/poor (%) | 38 (42) | 447 (35) | 797 (21) |
| Diabetes mellitus (%) | 19 (21) | 228 (18) | 394 (10) |
| Cardiovascular disease (%) | 14 (15) | 208 (16) | 580 (15) |
| Urgent treatment for asthma or chronic bronchitis/emphysema in past 12 months | 5 (5) | 53 (4) | 64 (2) |
| Antihypertensive medication (%) | 32 (35) | 540 (43) | 1360 (35) |
| Taking vitamin D supplements (%) | 2 (2) | 43 (3) | 370 (10) |
| Sun exposure (hours/day) | 1.3 ± 1.4 | 1.6 ± 1.4 | 2.2 ± 1.6 |
| Total physical activity (hours/week) | 21.6 ± 7.4 | 20.2 ± 14.5 | 22.5 ± 15.1 |
| Vigorous physical activity (hours/week) | 0.9 ± 1.8 | 1.6 ± 2.9 | 2.5 ± 3.8 |
| Current smoker (%) | 6 (7) | 108 (9) | 212 (6) |
| No alcohol intake in past 12 months (%) | 53 (58) | 299 (24) | 412 (11) |
| Body mass index (kg/m2) | 29.2 ± 6.5 | 29.6 ± 6.1 | 28.1 ± 4.7 |
| Systolic blood pressure (mmHg) | 135.6 ± 15.9 | 138.9 ± 18.3 | 139.0 ± 18.8 |
| Albumin (g/L) | 43.1 ± 2.4 | 43.5 ± 2.3 | 43.7 ± 2.2 |
| Creatinine (nmol/L) | 94.0 ± 27.4 | 91.7 ± 19.2 | 93.1 ± 16.9 |
Abbreviation: 25(OH)D, deseasonalized 25-hydroxyvitamin D.
aColumn % for categorical variables and mean ± SD for continuous variables.
bSome percentages do not total 100% because of their rounding.
Prediction of 25(OH)D < 50 nmol
Table 2 shows the discriminative performances of models in predicting 25(OH)D <50 nmol/L in the test set. Of the simple models, the 5 ML ones had AUC values similar to the reference model (Figure 1a and Table 2 (24)). The AUC of the reference model was 0.68 (95% CI 0.65-0.71) and those of ML models ranged from 0.67 (3 models) to 0.69 (for random forest and gradient boosted decision tree). Compared with the reference model, nearly all ML models yielded an improvement in discrimination as measured by IDI (maximum IDI = 0.0109; P < .0001). As demonstrated by the decision curve analysis (Figure 1b (24)), over the range of threshold probabilities, the net benefit for the ML models was similar to that for the conventional model.
Discrimination performance in predicting serum 25(OH)D <50 nmol/L and <25 nmol/L in the test set of the reference and machine learning models
| Model | 25(OH)D < 50 nmol/L | 25(OH)D < 25 nmol/L | ||||||
|---|---|---|---|---|---|---|---|---|
| AUC (95% CI) | P value | IDI (95% CI)b | P value | AUC (95% CI) | P value | IDI (95% CI)b | P value | |
| Simple models | ||||||||
| Reference modela | 0.68 (0.65-0.71) | Reference | Reference | Reference | 0.71 (0.59-0.83) | Reference | Reference | Reference |
| Lasso regression | 0.67 (0.64-0.70) | .33 | 10.9 (7.6-14.2) | <.0001 | 0.76 (0.65-0.87) | .02 | 25.2 (–14.6-65.0) | .21 |
| Elastic net | 0.67 (0.64-0.70) | .34 | 10.4 (7.1-13.6) | <.0001 | 0.76 (0.65-0.87) | .02 | 26.2 (–13.1-65.5) | .19 |
| Random forest | 0.69 (0.66-0.72) | .30 | 6.3 (0.3-12.3) | .04 | 0.85 (0.77-0.92) | .005 | 19.1 (–16.5-54.7) | .29 |
| Gradient boosted decision tree | 0.69 (0.66-0.72) | .13 | 5.6 (1.2-10.0) | .01 | 0.77 (0.66-0.87) | .10 | 5.1 (–34.9-45.1) | .80 |
| Dense neural net | 0.67 (0.64-0.70) | .24 | –0.3 (–7.7-7.0) | .93 | 0.76 (0.64-0.87) | .15 | 0.4 (–39.1-39.6) | .99 |
| Augmented models | ||||||||
| Reference modela | 0.72 (0.69-0.75) | Reference | Reference | Reference | 0.81 (0.71-0.91) | Reference | Reference | Reference |
| Lasso regression | 0.73 (0.70-0.75) | .14 | 9.0 (4.8-13.2) | <.0001 | 0.90 (0.82-0.96) | .002 | 8.9 (–20.3-38.1) | .55 |
| Elastic net | 0.73 (0.70-0.75) | .12 | 11.1 (7.0-15.2) | <.0001 | 0.93 (0.90-0.96) | .002 | 18.2 (–36.0-72.3) | .51 |
| Random forest | 0.72 (0.69-0.74) | .64 | 2.1 (–6.4-10.6) | .62 | 0.92 (0.88-0.95) | .009 | 21.4 (–14.0-56.8) | .24 |
| Gradient boosted decision tree | 0.72 (0.70-0.75) | .74 | 4.8 (–1.5-11.1) | .13 | 0.90 (0.85-0.95) | .007 | 13.1 (–34.2-60.3) | .59 |
| Dense neural net | 0.73 (0.70-0.75) | .16 | 4.3 (–2.6-11.2) | .22 | 0.85 (0.78-0.92) | .22 | 4.5 (–17.9-26.9) | .69 |
Abbreviations: 25(OH)D = deseasonalized 25-hydroxyvitamin D (nmol/L); AUC = area under ROC curve.
aLogistic regression.
b×10–3.
When we used augmented models instead, all performance indices were higher (Table 2 and Figs. 1A and 1B). AUC values were similar across models, ranging from 0.72 to 0.73. Lasso regression and elastic net regression yielded improvement in discrimination with respect to the reference model, as measured by IDI (0.009 and 0.0111, respectively; both P < .001). Across a wide range of thresholds, the net benefit was similar for all models but higher than for the assumptions that none or all were vitamin D deficient (Fig. 1B).
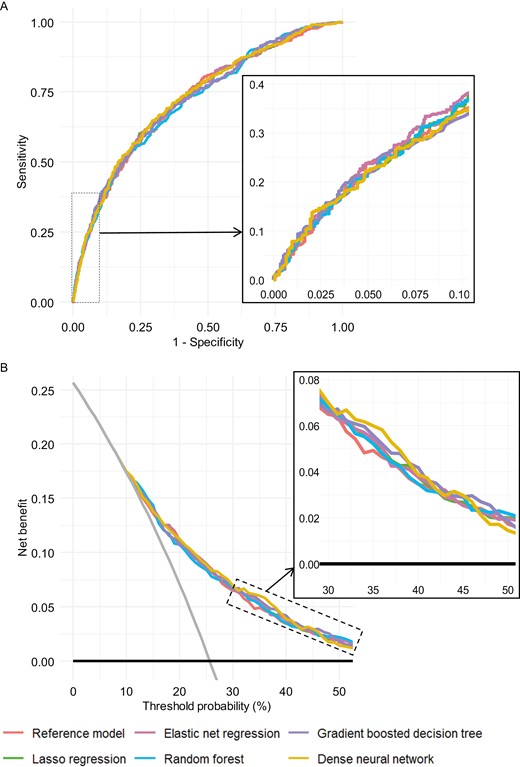
Prediction performance of augmented models for detection, in the test set, of serum 25(OH)D (deseasonalized 25-hydroxyvitamin D) <50 nmol/L: (A) ROC curves. (B) Decision curves. For decision curves, the net benefit associated with not testing anyone for vitamin D deficiency and testing all are given by the black horizontal lines (net benefit = 0) and gray angled lines, respectively. Insets are zooms of the curves.
Prediction of 25(OH)D <25 nmol
When we modeled 25(OH)D <25 nmol/L as an outcome, the discrimination performance was higher for all models (Table 2). Of the simple models, the ML ones had AUC point estimates—ranging from 0.76 (for regression-based models and dense neural network) to 0.85 for random forest—that were all higher than that of the conventional model (0.71) (Figure 2a and Table 2 (24)). Net benefit was highest for random forest at threshold probabilities of <4% (up to 0.004 [4 per 1000] higher than the conventional model) and, for probabilities >4%, was highest for elastic net regression (Figure 2b (24)).
In comparison, the augmented models, especially the ML ones, yielded even more accurate predictions (Table 2 and Figs. 2A and 2B). The elastic net model had the highest AUC (0.93), which was higher than that of the reference model (AUC = 0.81; P = .002 for difference). At every threshold, net benefit was highest for ML (at least 1 ML model; particularly for elastic net regression and random forest; Fig. 2B).
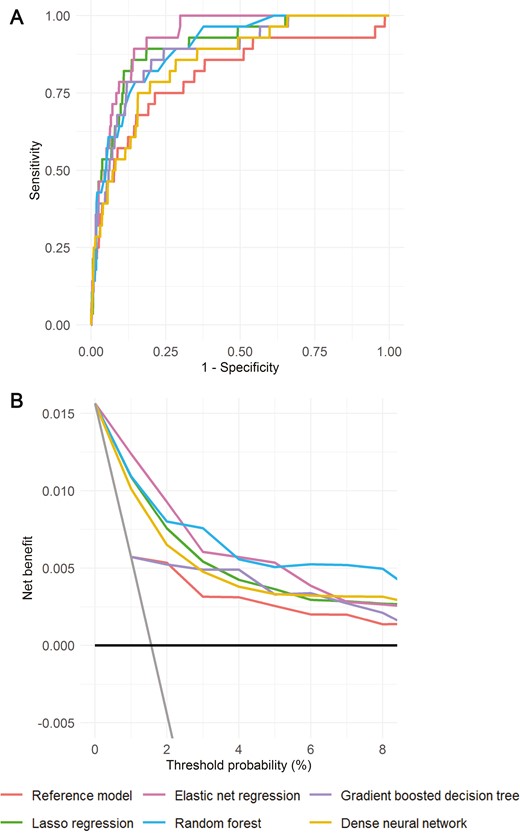
Prediction performance of augmented models for detection, in the test set, of 25(OH)D (deseasonalized 25-hydroxyvitamin D) <25 nmol/L: (A) ROC curves. (B) Decision curves. For decision curves, the net benefit associated with not testing anyone for vitamin D deficiency and testing all are given by the black horizontal lines (net benefit = 0) and gray angled lines, respectively.
Positive Prediction Sample
In the sample that we predicted to have the outcome, mean 25(OH)D was lowest at higher probability thresholds (Figure 3 (24)). For both outcomes, across thresholds, 25(OH)D was lowest for the consensus model, particularly with augmented models. For example, at a threshold of 11% for predicting 25(OH)D <25 with augmented models, mean 25(OH)D was ~31 nmol/L for the consensus model and ~45 nmol/L for the reference model (Figure 3 (24)).
Selected Features of Models
The most important predictors identified by lasso regression, random forest, and gradient boosted decision tree models for each outcome are summarized elsewhere (Figure 4 (24)) for the simple models and Fig. 3 for the augmented models). In all figures, the most important predictor was South Asian ethnicity. For both outcomes, some predictors were consistently of high importance across all 3 augmented models. For the 25(OH)D <50 nmol/L outcome (Fig. 3A), these were sun exposure (second most important in all 3 models), vigorous physical activity (1 of the top 5 features in all 3 models), BMI, and vitamin D supplements. For the 25(OH)D <25 nmol/L outcome (Fig. 3B), these were no alcohol intake in past 12 months (1 of the top 5 features in all 3 models) and creatinine.
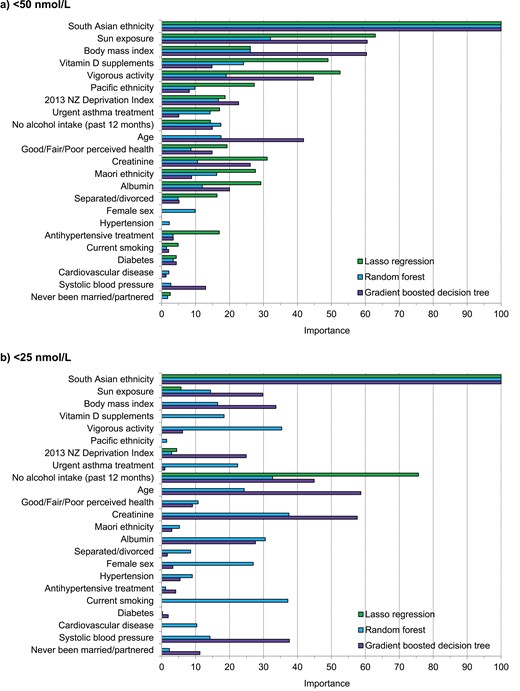
Variable importance of predictors in the augmented models for predicting low serum 25(OH)D (deseasonalized 25-hydroxyvitamin D). (A) <50 nmol/L and. (B) <25 nmol/L. The variable importance is a scaled measure to have a maximum value of 100.
Impact of Feature Selection
We repeated the analyses for Table 2 for the augmented models, but with feature selection: using only the most important predictors identified by Boruta (Fig. 4). For the <50 nmol/L outcome (Fig. 4A), these were all predictors except for 5: systolic BP, hypertension, never been married/partnered, antihypertensive treatment, and diabetes. Compared with using all features (no feature selection), applying feature selection yielded similar AUC values for all models (maximum difference = 0.01), including the reference model.
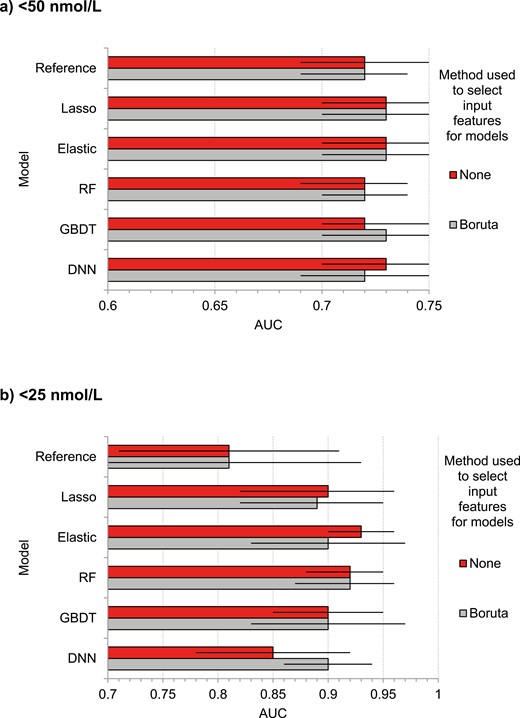
Discrimination performance for predicting low serum 25(OH)D (deseasonalized 25-hydroxyvitamin D) in the test set using augmented models with and without selection of input features using Boruta. (A) <50 nmol/L. (B) <25 nmol/L. AUC, area under curve. Error bars represent 95% CI.
For the <25 nmol/L outcome (Fig. 4B), Boruta selected 10 features: South Asian ethnicity, BMI, albumin, female sex, creatinine, Pacific ethnicity, no alcohol intake in past 12 months, diabetes, hypertension, and antihypertensive treatment. The dense neural network model performed better with feature selection than without it (AUC improvement = 0.05). For other models, AUC was mostly similar with and without feature selection.
Discussion
In 5106 community-resident adults, we predicted vitamin D deficiency using a conventional approach (logistic regression) and 5 modern ML techniques: lasso regression, elastic net regression, random forest, gradient boosted decision tree, and dense neural network. Compared with the conventional approach, these ML models demonstrated a similar performance in predicting 25(OH)D <50 nmol/L. By contrast, the ML models predicted 25(OH)D <25 nmol/L with a higher AUC—indicating an improvement in diagnostic accuracy. For this outcome, the utility of the ML models was reinforced by their greater net benefit across a range of threshold probabilities (or clinical preferences to balance false positives and false negatives). To our knowledge, this is the first study to compare ML and logistic regression for predicting vitamin D deficiency.
The improvement in discrimination with ML in predicting 25(OH)D <25 nmol/L is consistent with that reported in 2 studies that predicted 25(OH)D (not deseasonalized) with linear regression as the conventional model (19, 38). One of these studies modeled 25(OH)D as a continuous variable only (38). The other found that, compared with linear regression, ML (support vector regression) yielded a significantly higher AUC value (by 0.14) for detecting 25(OH)D <50 nmol/L based on Diasorin Liaison assay measurement. When analyses were repeated using liquid chromatography–tandem mass spectrometry, which yielded more accurate measures but a lower prevalence (13%) of 25(OH)D values <50 nmol/L, the AUC increase was 0.07 and not statistically significant (19). This increase is near the middle of the range of improvements we observed for predicting 25(OH)D <25 nmol/L with augmented models of between 0.04 (for dense neural network) and 0.12 (for elastic net regression) (Table 2). Our study corroborates the promise of additive benefit from ML suggested by these earlier studies (19, 38) and extends them by demonstrating higher diagnostic accuracy of a wider range of ML algorithms with a different conventional model (logistic regression), set of predictors, and outcome (low deseasonalized 25(OH)D).
The most likely explanation for the improvement in diagnostic accuracy of ML models is that this statistical method proficiently handles high-order interactions between predictors and nonlinear associations with the outcome (17, 18). If this is a key reason, this implies that, in their associations with 25(OH)D, the predictors of vitamin D deficiency may have a complex interrelationship. Some evidence of this is that the regression coefficients or performance of 25(OH)D models differ by age (consistent with the notion that cutaneous vitamin D production decreases with age) (22) and by sex (10). Another explanation is that our ML models utilized rigorous techniques (eg, regularization, cross-validation, and dropout) to mitigate overfitting, which is often problematic in traditional models.
Another novel feature of our models was that the 25(OH)D variable used to define our outcome was deseasonalized. This is important since 25(OH)D varies by season (26). Considering the influence of latitude-related factors (eg, cloud cover, ozone, and altitude) on 25(OH)D production (39), another original aspect of our study was geographical location. Whereas our study was conducted in northern New Zealand (latitude 37° S), which has a subtropical climate, most adult vitamin D deficiency models (conventional or ML) were based on populations in the United States and Northern Europe (7-14).
Two European studies reported that ML (random forest or feed forward artificial neural network) models predicted 25(OH)D <25 nmol/L (not deseasonalized) with AUC values of 0.677 and 0.835 (21, 22). We build on this prior research by demonstrating that, using a different set of predictors in a subtropical climate, deseasonalized 25(OH)D <25 nmol/L can be predicted with higher AUCs of up to 0.91 (with elastic net regression or random forest models), which constitutes high diagnostic accuracy (40).
As our model algorithms can be stored in computer files and transferred to other computers, they could be applied to identify older adults with vitamin D deficiency in different settings. First, they could help select those to be recruited into RCTs of people with vitamin D deficiency (eg, 25(OH)D <25 nmol/L (1, 2)); useful given the previously noted barriers to 25(OH)D testing (costly, time-consuming, and ethical considerations). To ensure that those selected have a high likelihood of actually being vitamin D deficient, the positive predictive value would need to be high. This could be achieved not only by screening in populations with a relatively high prevalence of vitamin D deficiency but by using a consensus model and selecting a high prediction threshold to identify cases (Figure 3 (24)). At a high threshold, the corresponding sensitivity would be low, indicating that, to compensate for missed cases, many patients would need to be screened to select patients for RCT inclusion. However, doing this is made feasible by implementing our simple models, which can be used to make predictions from large patient databases without needing to collect in-person data. This is another novel aspect of our study, given that the models in past studies contain predictors (eg, sun exposure) that are not routinely collected in clinical practice.
A second setting could be in studies aiming to perform a subgroup analysis of participants with vitamin D deficiency or to use the latter as a variable, but where 25(OH)D testing is a barrier (eg, cost prohibitive or otherwise infeasible).
Although our primary goal is to facilitate vitamin D research, a third setting for using the models is to identify patients in clinical practice who could benefit from vitamin D supplementation (7, 27). Clinician-ordered patient 25(OH)D testing has increased in many countries but much of this has been considered unnecessary, with a sizeable fraction of 25(OH)D assays testing negative for vitamin D deficiency, however defined (27). However, our models would add benefit in making the decision to undergo confirmatory 25(OH)D tests. For example, at a threshold probability of 5%, where the net benefit for our augmented random forest model for predicting 25(OH)D <25 nmol/L is ~0.041 higher than the test all (with 25(OH)D assays) patients’ plan (Fig. 2B), the net avoided false positives per 100 patients would be 100 × ~0.041/odds (0.05) = ~78 (35). That is, to avoid 1 unnecessary 25(OH)D test, the prediction model should be applied to ~1.28 patients. Thus, our model would help to avoid unnecessary testing. Through the adoption of more advanced computerized decision support systems for clinical outcomes (41), the opportunities to predict vitamin D status in this setting may be realized.
Our study participants were recruited from the community, which increases the generalizability of our findings. Another study strength is that we used the criterion standard laboratory method for 25(OH)D measurement (liquid chromatography–tandem mass spectrometry). Third, our decision curve analysis, which assesses clinical utility (in contrast to traditional performance measures) (35), enhances novelty as this analysis has not been incorporated in almost all previous assessments of 25(OH)D models that we reviewed (7-9, 11-14, 19-22, 38). As for limitations, our models had imperfect accuracy. We attribute this, at least in part, to the subjectivity of various predictors (eg, physical activity) and that we did not include some predictors observed in other studies, such as fish consumption, which may be high in vitamin D (8, 11), skin color (7, 42), and genetic factors (16), which are likely to have improved model accuracy. Given the influence of geographical location on 25(OH)D (39), our models have uncertain applicability to people in other geographical locations.
In summary, compared with conventional models, ML models predicted 25(OH)D <50 nmol/L with similar accuracy but predicted 25(OH)D <25 nmol/L with higher discrimination and net benefit. Our models provide a rapid, computer-based, and inexpensive method to accurately identify participants to be included in trials of older adults with vitamin D deficiency. Further, if applied in clinical practice, these improvements should yield fewer missed cases and less over-reporting of severe vitamin D deficiency, which would favorably impact on cost-efficiency of vitamin D testing. We encourage further ML studies in different populations, geographical locations and using a wider range of predictors.
Abbreviations
- 25(OH)D
25-hydroxyvitamin D
- AUC
area under the receiver operating characteristic curve
- BMI
body mass index
- BP
blood pressure
- IDI
integrated discrimination improvement
- IS
integral of sensitivity
- IP
integral of (1 – specificity)
- ML
machine learning
- NZDep13
2013 New Zealand Deprivation Index
- RCT
randomized controlled trial
Acknowledgments
We thank the participants and the ViDA study staff.
Funding
The Health Research Council of New Zealand (HRC; grant 10/400) and Accident Compensation Corporation of New Zealand funded this study. HRC supported J.D.S. with a fellowship (HRC 18/258).
Disclosures
None declared.
Data Availability
No additional data are available. However, the original (de-identified) data that support the findings derived from this analysis can be requested by emailing the corresponding author.
