


Abstract
Vitamin D has been linked with glucose and lipid metabolism. Men with impaired gonadal function have a higher risk of metabolic syndrome and mortality, and vitamin D status may be a reversible modulator.
This work aimed to determine the effect of daily vitamin D and calcium supplementation for 150 days on glucose and lipid homeostasis in infertile men.
A single-center, double-blinded, randomized clinical trial (NCT01304927) was conducted. A total of 307 infertile men were randomly assigned (1:1) to a single dose of 300 000 IU cholecalciferol followed by 1400 IU cholecalciferol + 500 mg of calcium daily (n = 151) or placebo (n = 156) for 150 days. Reported metabolic parameters including fasting plasma glucose, glycated hemoglobin A1c, fasting serum insulin, homeostatic model assessment of insulin resistance (HOMA-IR), fasting plasma cholesterols, and triglycerides were secondary end points. The primary end point semen quality has previously been reported.
Men receiving vitamin D supplementation improved their vitamin D status, whereas vitamin D status was aggravated in the placebo group characterized by higher serum parathyroid hormone. At the end of the trial, men receiving vitamin D supplementation had 13% lower fasting serum insulin concentrations compared with the placebo-treated group (65 vs 74 pmol/L, P = .018) and 19% lower HOMA-IR (2.2 vs 2.7, P = .025). Moreover, men in the vitamin D group had higher high-density lipoprotein (HDL) cholesterol levels (1.38 vs 1.32 mmol/L, P = .008) compared with the placebo group.
High-dose vitamin D supplementation has beneficial effects on glucose homeostasis and HDL cholesterol levels in infertile men.
Several studies have suggested a link between vitamin D deficiency and disturbed glucose metabolism including type 2 diabetes (1, 2). Vitamin D is synthesized in the skin and undergoes 25-hydroxylation in the liver to form 25-hydroxyvitamin D (25OHD), which is 1α-hydroxylated to 1,25-dihydroxyvitamin D (1,25(OH)2D3) in the kidney before it binds to the vitamin D receptor (VDR) and exerts its effect (3). Interestingly, 1α-hydroxylase and the VDR both are expressed in the pancreatic β cells (4, 5), and 1,25(OH)2D3 has a stimulatory effect on insulin production in vitro (6-9). Meta-analyses examining the effects of vitamin D supplementation on glucose homeostasis, insulin sensitivity, and development of diabetes have shown conflicting results (10-14). A recent large-scale, randomized clinical trial showed that vitamin D supplementation in prediabetic individuals with a baseline serum 25OHD level of less than 30 nmol/L significantly lowered the risk of diabetes compared with placebo (15). Other studies have shown that men with impaired semen quality have a higher risk of metabolic syndrome, type 2 diabetes, cardiovascular disease, and overall mortality compared with men with normal semen quality (16-18). Poor gonadal function induces changes in glucose and lipid homeostasis (19), and there is an ongoing search for factors that can improve gonadal function and ultimately the metabolic changes occurring secondarily to impaired gonadal function.
We recently reported a randomized, double-blind, placebo-controlled trial, The Copenhagen Bone-Gonadal Study, demonstrating beneficial effects of high-dose vitamin D supplementation for 150 days on semen quality in infertile men with severely impaired semen quality and vitamin D deficiency (20). Here, we report prespecified secondary end points from The Copenhagen Bone-Gonadal Study including fasting plasma glucose, glycated hemoglobin A1c (HbA1c), fasting serum insulin, homeostatic model assessment of insulin resistance (HOMA-IR), McAuley index of insulin resistance in the general population, and fasting plasma cholesterols and triglycerides.
Materials and Methods
Trial Design and Intervention
The Copenhagen Bone-Gonadal Study was a single-center, double-blind, randomized clinical trial conducted at the Department of Growth and Reproduction, Rigshospitalet, University of Copenhagen, Copenhagen, Denmark (NCT01304927). The detailed study design has been described previously (20). In short, 307 infertile men, all of whom were part of an infertile couple with an average of more than 24 months’ inability to conceive naturally and had impaired semen quality, were referred to our andrological center because they were candidates for intracytoplasmic sperm injection. The men were invited to participate if they had mild-to-moderate vitamin D deficiency (25OHD < 50 nmol/L) and no serious comorbidities including diabetes. Informed consent was obtained from all participants. Eligible men were randomly assigned to receive high-dose vitamin D + calcium or placebo for 150 days. Men randomly assigned to active treatment initially received an oral bolus of 300 000 IU of cholecalciferol dissolved in oil, followed by vitamin D tablets containing 1400 IU cholecalciferol and 500 mg calcium once daily for 150 days (Ferrosan/Pfizer). Men in the placebo group initially received an oral bolus of oil followed by placebo tablets without vitamin D or calcium for 150 days. Instructions were provided to all men to refrain from consuming additional vitamin D supplementation exceeding 400 IU daily. The Central Pharmacy of the Capital Region of Denmark manufactured the initial high-dose cholecalciferol bolus and performed randomization of the placebo and vitamin D treatment. At baseline and end-of-trial, all participants underwent a full dual-energy X-ray absorptiometry (DXA) scan (Lunar Prodigy), had a blood sample taken after an overnight fast, and their abdominal circumference and blood pressure measured. Investigators were blinded during all phases of the trial, and an independent statistician conducted the statistical analysis based on a predefined statistical analysis plan. Intervention compliance was evaluated by measuring serum 25OHD, 1,25(OH)2D3, calcium, and parathyroid hormone (PTH) on day 1 and day 150 and by counting returned tablets at days 90 and 150. The primary end point data on semen quality were published in 2018 (20). In brief, supplementation with vitamin D and calcium had no effect on semen quality in mild-to-moderate vitamin D–deficient infertile men, but serum inhibin B concentration increased in severely vitamin D–deficient men as did the live-birth rate in a subgroup of men with oligozoospermia (sperm concentration < 15 million/mL).
Ethics
The study was approved by the Danish Medicines Agency, the Danish National Committee on Health Research Ethics, and the Danish Data Protection Agency (approval No. 2010-024588-42, H-4-2010-138, and 2010124801). Good clinical practice (GCP) was monitored by the Copenhagen GCP Unit, Copenhagen University Hospitals.
Biochemical Analysis
HbA1c was measured on a Tosho G8 with a coefficient of variation (CV) of 2.8% and serum ionized calcium (CV 3%) was measured on a Konelab 30i (Thermo Fisher Scientific). PTH (CV 7%), total serum calcium (CV 2.5%), fasting blood glucose (CV 4%), fasting insulin (CV 5%), total cholesterol (CV 5%), low-density lipoprotein (LDL; CV 4%), high-density lipoprotein (HDL; CV 4%), and triglycerides (CV 5%) were all measured on a Cobas 8000 (Roche). Indices of insulin resistance were calculated using the formulas: HOMA-IR = (fasting blood glucose [mmol/L] × [fasting insulin [pmol/L]/6.945]/22.5) and McAuley index: = (exp[2.63 − 0.28 × ln[fasting insulin [pmol/L]/6.945] − 0.31 × ln[fasting triglycerides [mmol/L]). Measurements of 25OHD and 1,25(OH)2D3 levels were conducted using isotope-dilution liquid chromatography–tandem mass spectrometry (CV < 10% and < 18%, respectively).
Statistical Analysis
Descriptive statistics are presented as means with SD in Table 1 and mean with 95% CI in Table 2. The primary analysis was performed according to the randomized group assignment, using first crude comparisons of means (t test). Subsequently, all variables were analyzed using a mixed model, adjusted for baseline levels, age, and body mass index (BMI). This allows taking individual differences into account as well as considering that randomization ensures the same baseline means. Variables were logarithmically transformed when required to obtain approximate normality of the residuals. No observations were excluded. Further analysis was performed according to prespecified subgroup analyses. The prespecified subgroups were defined as severe vitamin D deficiency with serum 25OHD less than 25 nmol/L and mild-to-moderate vitamin D deficiency with serum 25OHD level less than 50 nmol/L. The applied dose of cholecalciferol was expected to generate an increase in serum 25OHD concentration of 50 nmol/L, and the dropout rate was expected to be 10%. Power calculations were based on the primary end point, semen quality. A total of 150 men in each group enabled us to detect a 27% change in sperm concentration and 15% change in sperm motility at a level of significance of 5% and with a power of 80% in comparison with the placebo group. Post hoc power calculations based on a significance level of 5% and a power of 80% and a setup with 135 men in each group showed that we would be able to detect relevant differences in fasting plasma glucose (3%), HbA1c (3%), fasting serum insulin (22%), HOMA-IR (25%), McAuley index of insulin resistance (8%), plasma HDL (9%), plasma LDL (10%), and total cholesterol (7%) as well as plasma triglycerides (18%).
Baseline characteristics
| Mean (SD) | Total | No. | Vitamin D + Ca | Placebo |
|---|---|---|---|---|
| Included men, No. | 307 | 307 | 151 (49.2%) | 156 (50.8%) |
| Age, y | 34.8 (6.6) | 307 | 34.5 (6.3) | 35.2 (6.9) |
| Smokers, % | 24 | 67/279 | 26 | 22 |
| Height (m) | 1.81 (0.07) | 299 | 1.82 (0.07) | 1.81 (0.07) |
| Weight (kg) | 86.9 (16.4) | 299 | 87.1 (14.3) | 86.6 (18.2) |
| BMI | 26.4 (4.4) | 299 | 26.3 (4.0) | 26.4 (4.8) |
| Abdominal circumference, cm | 94.6 (12.3) | 300 | 94.8 (11.9) | 94.3 (12.6) |
| Systolic blood pressure, mm Hg | 127 (12) | 300 | 127 (12) | 128 (11) |
| Diastolic blood pressure, mm Hg | 81 (10) | 300 | 80 (10) | 81 (10) |
| 25OHD, nmol/L | 45 (20) | 300 | 46 (20) | 45 (20) |
| 1,25(OH)2D3, pmol/L | 84 (32) | 297 | 83 (31) | 85 (34) |
| PTH, pmol/L | 4.7 (1.5) | 233 | 4.5 (1.4) | 4.9 (1.6) |
| Ionized Ca, mmol/L | 1.20 (0.03) | 287 | 1.20 (0.03) | 1.20 (0.04) |
| Fasting blood glucose, mmol/L | 5.1 (0.5) | 300 | 5.1 (0.4) | 5.1 (0.6) |
| Fasting insulin, pmol/L | 63 (49) | 298 | 62 (45) | 63 (52) |
| HbA1c, mmol/L/mol | 34 (4) | 300 | 34 (3) | 34 (4) |
| HDL, mmol/L | 1.35 (0.30) | 299 | 1.35 (0.35) | 1.35 (0.32) |
| LDL, mmol/L | 3.1 (0.8) | 299 | 3.0 (0.8) | 3.1 (0.8) |
| Total cholesterol, mmol/L | 4.9 (1) | 299 | 4.8 (1) | 5.0 (1) |
| Triglycerides, mmol/L | 1.2 (0.8) | 299 | 1.2 (0.8) | 1.2 (0.8) |
| HOMA-IR | 2.1 (2.2) | 298 | 2.1 (1.6) | 2.2 (2.7) |
| McAuley index | 8.2 (2.2) | 298 | 8.2 (2.2) | 8.1 (2.2) |
| ALT, U/L | 32 (19) | 299 | 32 (16) | 32 (22) |
| GGT, U/L | 31 (28) | 299 | 29 (26) | 32 (29) |
| Albumin, g/L | 45 (3) | 299 | 45 (3) | 46 (3) |
| Amylase, U/L | 58 (22) | 299 | 59 (22) | 57 (22) |
| Fat mass, kg | 22.6 (10.8) | 292 | 22.7 (11.0) | 22.6 (10.7) |
| Fat mass, % of total mass | 26.4 (8.7) | 292 | 26.3 (9.0) | 26.5 (8.4) |
Data presented as means with SD in parenthesis unless otherwise indicated.
Abbreviations: 1,25(OH)2D3, 1,25-dihydroxyvitamin D; 25OHD, 25-hydroxyvitamin D; ALAT, alanine aminotransferase; BMI, body mass index; Ca, calcium; GGT, γ-glutamyltransferase; HbA1c, glycated hemoglobin A1c; HDL, high-density lipoprotein; HOMA-IR, homeostatic model assessment of insulin resistance; LDL, low-density lipoprotein; PTH, parathyroid hormone.
Outcome day 150
| Vitamin D + Ca | Placebo | Difference in % between groups, % | Crude | Mixed model | |||
|---|---|---|---|---|---|---|---|
| No. | Mean (CIa) | No. | Mean (CIa) | P | |||
| Weight, kg | 130 | 86.9 (84.4-89.3) | 138 | 85.5 (83.0-88.0) | 2 | .44 | .46 |
| Abdominal circumference | 130 | 94.8 (92.8-96.8) | 138 | 94.3 (92.4-96.2) | 1 | .75 | .59 |
| Systolic blood pressure, mm Hg | 130 | 127 (125-129) | 138 | 127 (125-129) | 0 | .66 | .77 |
| Diastolic blood pressure, mm Hg | 130 | 81 (80-83) | 138 | 82 (80-83) | –1 | .85 | .43 |
| 25OHD, nmol/L | 129 | 89 (85-92) | 136 | 51 (46-55) | 75 | < .001 | < .001 |
| 1,25(OH)2D3, pmol/L | 129 | 107 (100-114) | 134 | 79 (73-85) | 35 | < .001 | < .001 |
| PTH, pmol/L | 111 | 4.1 (3.9-4.4) | 110 | 5.2 (4.8-5.6) | 20 | < .001 | < .001 |
| Ionized Ca, mmol/L | 126 | 1.21 (1.21-1.22) | 129 | 1.20 (1.20-1.21) | 1 | .010 | .006 |
| Fasting blood glucose, mmol/L | 132 | 5.1 (5.0-5.2) | 135 | 5.2 (5.0-5.3) | –2 | .74 | .79 |
| Fasting insulin, pmol/L | 132 | 65 (57-72) | 135 | 74 (65-84) | –13 | .12 | .02 |
| HbA1c, mmol/mol | 132 | 34 (33-34) | 135 | 35 (34-36) | –3 | .14 | .58 |
| HDL, mmol/L | 134 | 1.38 (1.31-1.44) | 135 | 1.32 (1.26-1.37) | 5 | .14 | .008 |
| LDL, mmol/L | 134 | 3.0 (2.9-3.2) | 135 | 3.1 (3.0-3.3) | –3 | .36 | .26 |
| Total cholesterol, mmol/L | 134 | 4.8 (4.7-5.0) | 135 | 4.9 (4.7-5.1) | –2 | .50 | .15 |
| Triglycerides, mmol/L | 134 | 1.1 (1.0-1.2) | 135 | 1.3 (1.2-1.4) | –12 | .07 | .11 |
| HOMA-IR | 132 | 2.2 (1.9-2.4) | 135 | 2.7 (2.1-3.2) | –19 | .16 | .03 |
| McAuley index | 132 | 8.1 (7.7-8.4) | 135 | 7.6 (7.3-8.0) | 6 | .06 | .010 |
| ALAT, U/L | 134 | 32 (29-35) | 135 | 32 (28-35) | 0 | .82 | .85 |
| GGT, U/L | 132 | 29 (25-33) | 135 | 33 (27-39) | –13 | .25 | .69 |
| Albumin, g/L | 134 | 45 (44-46) | 136 | 45 (44-45) | 0 | .75 | .40 |
| Amylase, U/L | 132 | 61 (57-64) | 135 | 59 (55-63) | 3 | .38 | .46 |
| Fat mass, kg | 129 | 22.2 (20.4-24.0) | 121 | 21.9 (20.0-23.9) | 1 | .84 | .30 |
| Fat mass, % of total mass | 129 | 26.0 (24.5-27.6) | 121 | 25.9 (24.4-27.5) | 0 | .92 | .18 |
Abbreviations: 1,25(OH)2D3, 1,25-dihydroxyvitamin D; 25OHD, 25-hydroxyvitamin D; ALAT, alanine aminotransferase; BMI, body mass index; Ca, calcium; GGT, γ-glutamyltransferase; HbA1c, glycated hemoglobin A1c; HDL, high-density lipoprotein; HOMA-IR, homeostatic model assessment of insulin resistance; LDL, low-density lipoprotein; PTH, parathyroid hormone.
aData presented as mean with 95% confidence interval.
Results
Flow and Safety
This section has previously been described (20). In brief, 1427 infertile men were referred to our andrological department. Out of these, 307 men were included and randomly assigned to receive either vitamin D + calcium or placebo and 269 men completed the study (Fig. 1). There were no cases of serious adverse events, hypercalcemia, or kidney stones in the vitamin D group.
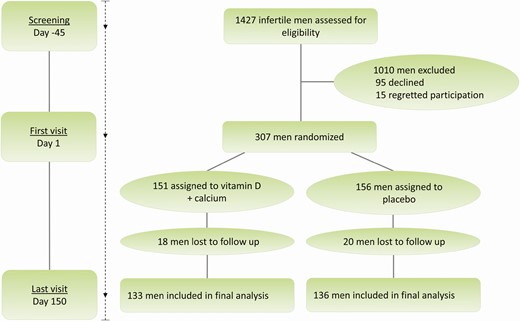
Flow diagram, from initiating participating to attended.
Vitamin D Metabolites, Parathyroid Hormone, and Calcium
At the initial andrological investigation, both groups of men had a mean serum 25OHD concentration of 35 nmol/L. Despite no treatment an increase in 25OHD at day 1 was found in both groups, respectively: 11 nmol/L in the vitamin D group and 10 nmol/L in the placebo group. At day 1 the vitamin D group had a lower serum PTH compared with the placebo group (4.5 vs 4.9; P = .029), while there were no differences in serum 1,25(OH)2D3 or ionized calcium prior to the intervention (see Table 1). After 150 days’ intervention, men randomly assigned to vitamin D and calcium almost doubled their serum 25OHD concentration from 46 to 89 nmol/L. This increase was significantly different from the placebo group, reaching a mean serum 25OHD concentration of 51 nmol/L and not significantly different from vitamin D status at day 1. In accordance, men in the vitamin D group had a 1% increase in ionized calcium (1.20 vs 1.21 mmol/L; P = .011) and 2% increase in total calcium (2.33 vs 2.37 mmol/L; P = .001), while they experienced a 7% decrease in PTH (4.4 vs 4.1 pmol/L; P = .028). Again, this was significantly different from the placebo group experiencing a 7% but statistically nonsignificant increase in PTH (4.9 vs 5.2; P = .078) from day 1 and no change in serum levels of ionized or total calcium, which remained the same (1.20 mmol/L; P = .642, and 2.33 mmol/L; P = .724, respectively). Of note, men in the vitamin D group had a 29% increase in 1,25(OH)2D3 (83 vs 107 pmol/L; P < .001), whereas men in the placebo group had a significant 9% decrease (86 vs 78 pmol/L; P = .047) despite the compensatory increase in the most powerful regulator, CYP27B1 activity, PTH (Fig. 2). Sperm concentration at baseline had no influence on serum 25OHD concentration at day 150. By using predefined subgroup analysis according to baseline sperm concentration (< 5 million/mL; 5-20 million/mL, and > 20 million/mL), we found that men in each subgroup receiving vitamin D had a similar serum 25OHD concentration at day 150 (91, 91, and 85 nmol/L; P = .261, respectively). Likewise, men in each sperm subgroup receiving placebo had a similar serum 25OHD concentration at day 150 (52, 50, and 50 nmol/L; P = .904, respectively).
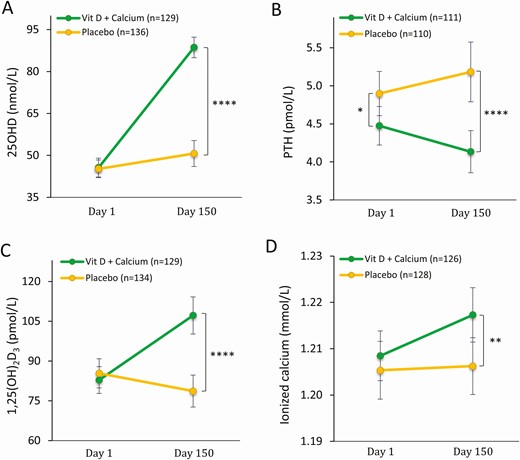
Calciotropic hormones at before and after intervention day 150. A, Serum 25-hydroxyvitamin D (25OHD) at day 1 and day 150; B, serum parathyroid hormone (PTH) at day 1 and day 150; C) serum ionized calcium at day 1 and day 150; and D, serum 1,25-dihydroxyvitamin D (1,25(OH)2D3) at day 1 and day 150. Data are presented as mean ± 95% CI. *P less than .05; **P less than .01; ****P less than .00005. P value: mixed model has been used for all, excepted for PTH day 1, where t test is used.
Glucose Homeostasis, Cholesterol, and Fat Mass
At day 1 there were no differences in glucose homeostasis or cholesterol between the 2 groups (see Table 1). At day 1, BMI was associated with serum 25OHD (β = –.55; P = .036) and serum PTH (β = .08; P < .0005) and normal-weight men (BMI = 18.5-24.9) had a significantly higher mean serum 25OHD concentration (48 nmol/L) compared to obese men (BMI > 30) (39 nmol/L; P = 0=.016) but not different from the overweight men (BMI 25-30) (45 nmol/L; P = .205). Moreover, normal-weight men (BMI 18.5-24.9) had a significantly lower PTH (4.3 pmol/L) than overweight men (BMI 25-30) (4.8 pmol/L; P = .024) and obese men (BMI > 30) (5.2 pmol/L; P = .0002). Vitamin D supplementation prevented an overall deterioration of glucose homeostasis in the vitamin D group unlike what was observed in the placebo group (see Table 2). The placebo group experienced a worsening of their vitamin D status characterized by higher PTH and lower 1,25(OH)2D during the intervention. At the end of the study the vitamin D group had a 13% lower fasting serum insulin concentration compared with the placebo group (65 vs 74 pmol/L; P = .018) and a favorable insulin sensitivity, illustrated by a 19% lower HOMA-IR (2.2 vs 2.7; P = .025) and 6% higher McAuley index (8.1 vs 7.6; P = .010) but no significant differences in fasting blood glucose or HbA1c concentrations (Fig. 3). Moreover, men in the vitamin D group had an increase in mean plasma HDL concentration of 2.2%, thus significantly different from the decrease of 2.2% in the placebo group (1.38 vs 1.32 mmol/L; P = .008). No changes in total cholesterol between the 2 groups were found (Fig. 4).
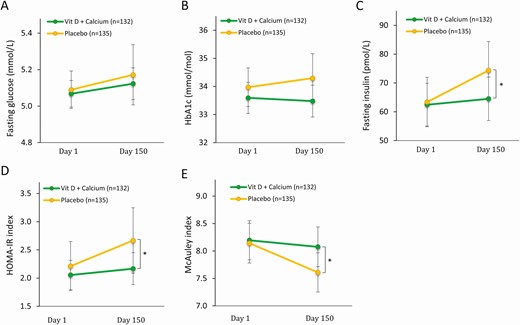
Glucose homeostasis and insulin sensitivity before and after intervention. A, Fasting blood glucose at day 1 and day 150; B, serum hemoglobin A1c (HbA1c) (International Federation of Clinical Chemistry and Laboratory Medicine) at day 1 and day 150; C, serum insulin at day 1 and day 150; D, homeostatic model assessment of insulin resistance (HOMA-IR) at day 1 and day 150; and E, McAuley index at day 1 and day 150. Presented as mean ± 95% CI. *P less than .05. P value: mixed model.

Lipid profile before and after intervention. A, Plasma high-density lipoprotein (HDL) at day 1 and day 150; B, plasma low-density lipoprotein (LDL) at day 1 and day 150; C, total cholesterol at day 1 and day 150; and D, plasma triglycerides at day 1 and day 150. Presented as mean ± 95% CI. **P less than .01. P value: mixed model.
Using predefined subgroup analysis starting with selection of men with severe vitamin D deficiency (25OHD < 25 nmol/L; n = 46) at day 1, the differences between the vitamin D and placebo group were not significant (insulin: 96 vs 103, P = .812; HOMA-IR: 3.3 vs 4.5, P = .567; McAuley: 7.3 vs 7.1, P = .783). Similar analysis in men with mild-to-moderate vitamin D deficiency (25OHD < 50 nmol/L; n = 154) at day 1 were in favor of the vitamin D group but not statistically significant (insulin: 67 vs 79; P = .214, HOMA-IR: 2.3 vs 2.9; P = .223, McAuley: 8.1 vs 7.4; P = .046, HDL: 1.37 vs 1.27; P = .083, and triglycerides: 1.1 vs 1.3; P = .062). In the vitamin D group, the effect of vitamin D supplementation were almost similar between men with 25OHD less than 50 nmol/L and greater than or equal to 50 nmol/L at day 1, whereas in the placebo group, men with 25OHD less than 50 nmol/L at day 1 had a tendency toward a more severe deterioration of their metabolic profile compared to men with 25OHD greater than or equal to 50 nmol/L at day 150 (Fig. 5). There were no significant differences when using predefined subgroup analysis according to baseline sperm concentration (data not shown). No significant differences in body weight, total fat mass determined by DXA, or liver enzymes were identified between the 2 groups after the intervention (see Table 2).
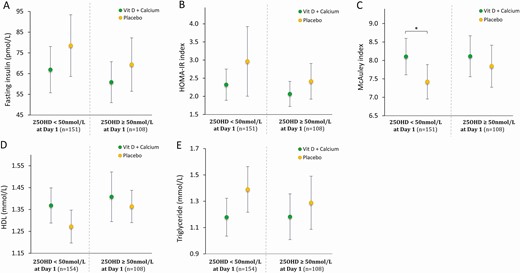
Glucose homeostasis, insulin sensitivity, and lipid profile after intervention stratified according to vitamin D status at baseline: threshold serum 25-hydroxyvitamin D (25OHD) = 50 nmol/L. A, Serum fasting insulin at day 150; B, homeostatic model assessment of insulin resistance (HOMA-IR) index at day 150; C) McAuley index at day 150; D, serum high-density lipoprotein (HDL) at day 150; and E, serum triglycerides at day 150. Presented as mean ± 95% CI. *P less than .05. P value: t test.
Discussion
In this randomized, double-blind clinical trial, vitamin D supplementation as compared to placebo had beneficial effects on insulin sensitivity and circulating lipids in infertile men who have a heightened risk of developing metabolic syndrome and type 2 diabetes (16-18). The observed effect of vitamin D supplementation on HDL, fasting insulin, and insulin sensitivity assessed by HOMA-IR and the McAuley index is small. The differences in fasting insulin and insulin sensitivity were largely driven by a deterioration in the placebo group. This indicates that persistently low vitamin D status with increasing PTH may lead to impaired insulin sensitivity and lower HDL levels. In accordance, the placebo-treated men experienced a prolonged vitamin D insufficiency characterized by a significant decrease in serum 1,25(OH)2D3 and a concomitant but nonsignificant increase in serum PTH. The beneficial effect on plasma HDL cholesterol in the vitamin D group, despite the low potency, could be of importance in populations at high risk of developing metabolic syndrome and type 2 diabetes (16-18).
Numerous studies have shown negative associations between obesity and serum 25OHD (21). One of the proposed explanations for low serum vitamin D in obese individuals is a greater storage capacity through fat sequestration or volumetric dilution (21). Another explanation is a fraction of adipose tissue becomes dysfunctional characterized by a reduced catecholamine-induced release of cholecalciferol and 25OHD and impaired activity of vitamin D-metabolizing enzymes (22). In our study, vitamin D supplementation had no effect on body weight, total fat mass determined by DXA, or liver enzymes. However, recent studies have suggested obesity and fasting as putative regulators of hepatic 25-hydroxylase (CYP2R1) (23-26). Hepatic CYP2R1 has usually been considered to be constitutively active (23), but obesity and 24-hour fasting in mice significantly regulates CYP2R1. This regulatory link between fat mass and 25-hydroxylase activity may explain the difference in 25OHD levels between normal weight and obese men. Still, irrespective of BMI and insulin levels, we demonstrate that high-dose cholecalciferol generates a substantial increase in 25OHD despite the proposed regulation of CYP2R1.
CYP2R1 is also highly expressed in human testis (27). It has been shown that men with severe hypospermatogenesis have a lower testicular-cell expression of CYP2R1 and lower serum 25OHD levels, suggesting a possibly link between the testicular CYP2R1 activity and the serum 25OHD concentration (28). Owing to the impaired testicular expression of CYP2R1, men with hypogonadism may benefit from treatment with calcifediol compared to treatment with cholecalciferol (29). In this study, there were no difference in serum 25OHD levels at day 1 between men with sperm concentration of less than 5 million/mL, 5 to 20 million/mL, and more than 20 million/mL (data not shown) or in the vitamin D group after the intervention period at day 150.
Prolonged vitamin D insufficiency or deficiency will lead to increased serum levels of PTH that is tightly connected to serum levels of calcium, 25OHD, and 1,25(OH)2D3 (3). Most studies have focused only on 25OHD as a determinant of vitamin D status, but it may be more accurate to include PTH to validate and confirm vitamin D status as proposed by others (30). High serum PTH levels combined with serum 25OHD less than 50 nmol/L indicate a more severe and chronic vitamin D deficiency than vitamin D status alone, and PTH may also be involved in the crosslink between vitamin D and insulin sensitivity and glucose metabolism (31, 32). A previous prospective study showed that pregnant women with vitamin D deficiency/insufficiency and high PTH had an impaired insulin sensitivity and β-cell function 12 months post partum, unlike women with vitamin D deficiency/insufficiency and low PTH (33). Furthermore, a recent study showed that PTH alone is a strong predictor of all-cause mortality in patients with type 2 diabetes (34). Together, these studies suggest that part of the deterioration in glucose homeostasis in the placebo group observed in the present study may be due to higher PTH levels and that this increase may be harmful and can to some extend be controlled by vitamin D.
Despite a substantial increase in serum 25OHD following daily supplementation with cholecalciferol and calcium, the changes in serum ionized and total calcium were modest. The modest increase could be due to changes in calcium homeostasis as indicated by the change in 25OHD, 1,25(OH)2D3, and PTH but could also be related to changes in albumin levels. Albumin is the main calcium-binding protein in serum, and vitamin D deficiency has been associated with reduced albumin levels (35), which in addition to a possible hepatic effect may be due to inflammation and capillary loss of albumin and reduced CYP2R1 activity.
The observed small but beneficial effects of vitamin D and calcium are in line with previous randomized clinical trials showing a beneficial effect of supplementation with vitamin D and calcium on insulin sensitivity and HDL cholesterol (36-39). Accordingly, the majority of meta-analyses in the field demonstrate beneficial effects of vitamin D on glucose homeostasis (10-14). A large randomized, controlled trial showed that vitamin D supplementation was unable to delay the onset of type 2 diabetes in individuals with prediabetes, but subgroup analyses showed a borderline significant protection in men (hazard ratio 0.82; 95% CI, 0.66-1.01) and a significant protection in vitamin D–deficient individuals (hazard ratio 0.38; 95% CI, 0.18-0.80) (15).The main limitation of our study is the presentation of secondary outcomes, and therefore this study is an exploratory rather than a confirmatory study. Adjustment for multiple comparisons are therefore of less relevance (40) since these findings need confirmation by prospective studies.
In conclusion, this study shows that vitamin D and calcium supplementation prevent a decline in insulin sensitivity and improve HDL cholesterol in infertile men at increased risk of developing metabolic syndrome and type 2 diabetes.
Abbreviations
- 1,25(OH)2D3
1,25-dihydroxyvitamin D
- 25OHD
25-hydroxyvitamin D
- ALAT
alanine aminotransferase
- BMI
body mass index
- Ca
calcium
- CV
coefficient of variation
- CYP2R1
hepatic 25-hydroxylase
- DXA
dual-energy X-ray absorptiometry
- GCP
good clinical practice
- GGT
γ-glutamyltransferase
- HbA1c
glycated hemoglobin A1c
- HDL
high-density lipoprotein
- HOMA-IR
homeostatic model assessment of insulin resistance
- LDL
low-density lipoprotein
- PTH
parathyroid hormone
- VDR
vitamin D receptor
Acknowledgments
Funding: This work was supported by Rigshospitalet, the Novo-Nordisk Foundation, the Aase and Ejnar Danielsens Foundation, and FSS. The funding entities have not taken part in the study design, trial conduction, sample analyses, nor data interpretation in the present study.
Author Contributions: M.B.J., A.J., and N.J. designed the research; MBJ conducted the study; R.H., E.D., and M.B.J. analyzed the data; J.H.P. conducted the statistical analyses; R.H. and M.B.J. contributed to the statistical analyses; R.H., E.D., F.K.K., and M.B.J. wrote the paper; R.H. and M.B.J. take primary responsibility for the final content; and all authors read and approved the final manuscript.
Clinical Trial Information: Clinicaltrials.gov registration number NCT01304927 (https://clinicaltrials.gov/ct2/show/NCT01304927, registered February 28, 2011).
Additional Information
Disclosures: The authors have nothing to disclose.
Data Availability
Some or all data sets generated during and/or analyzed during the present study are not publicly available but are available from the corresponding author on reasonable request.
