


Abstract
It is unclear how fat mass accretion in early life is related to glucose–insulin homeostasis.
Examine associations of fat and fat-free mass accretion from birth to early childhood with glucose–insulin homeostasis in early childhood in a multi-ethnic cohort.
Observational Healthy Start study with data collection from 2010 to 2020. Air displacement plethysmography at birth and 4.8 (SD 0.7) years estimated fat mass percent (FMP, %), fat mass index (FMI, kg/m2), and fat-free mass index (FFMI, kg/m2). General population recruited from academic obstetrics clinics in Denver, Colorado, consisting of 419 mother/offspring dyads. The main outcome measures were fasting glucose, insulin, homeostasis model assessment-2 insulin resistance (HOMA2-IR), and beta-cell function (HOMA2-B) at 4.8 years.
Greater fat mass accretion from birth to early childhood was associated with higher fasting glucose (ΔFMP β = 0.20 [95% CI 0.06-0.34], ΔFMI β = 0.90 [0.30-1.50]) in participants of Hispanic, Black, and Other races/ethnicities, while greater fat-free mass accretion was associated with higher fasting glucose in non-Hispanic White participants (ΔFFMI β = 0.76 [0.21-1.32]). Overall, greater fat, but not fat-free, mass accretion was also associated with higher insulin (ΔFMP β = 0.14 [0.09-0.18], ΔFMI 0.71 [0.51-0.92]), HOMA2-IR (FMP β = 0.02 [0.01-0.02], ΔFMI β = 0.09 [0.06-0.12]), and HOMA2-B (ΔFMP β = 0.92 [0.18-1.36], ΔFMI β = 4.76 [2.79-6.73]).
Greater fat mass accretion in infancy and childhood is associated with shifts in fasting glucose in children of Hispanic, Black, and Other races/ethnicities at 5 years of age. Body composition beginning in early life is relevant for metabolic health, and precise assessments of adiposity in pediatric research are needed.
In the United States, one-quarter of pediatric diabetes cases are now type 2 diabetes (1). It is well established that rapid growth in early life is associated with adult metabolic disease (2). Comparable evidence for an association of rapid growth with precursors to metabolic disease during childhood (eg, increases in insulin resistance and beta-cell function, or elevated fasting glucose) is also accumulating. Accelerated growth during infancy or early childhood has been associated with decreased insulin sensitivity (3-7), increased insulin secretion (8), and an increased insulinogenic index (7, 8) as early as 4 years of age in some studies, but not consistently within all studies (7, 9).
These findings suggest that early growth is related to alterations in metabolic (glucose–insulin) homeostasis, but more evidence is needed to clarify the specific contribution of growth in fat mass (ie, accretion). Most prior studies examining early growth have used body mass index (BMI), which is a crude proxy for body composition (10). This is particularly problematic for infancy and childhood when gains in BMI are mainly due to fat-free mass, rather than fat mass (11, 12). As such, BMI measurements could fail to identify more than 25% of children with excess adiposity (fat mass percent, FMP) (10), and research utilizing BMI may have limited specificity for examining the relationship between fat mass accretion and metabolic health in this period of life (13). An exception to the published literature in this area is a recent study of body composition that was conducted among Ethiopian children, which reported that neither fat mass nor fat-free mass accretion from birth to 6 months was associated with metabolic outcomes at age 5 years (14). Yet, the generalizability of these results is limited by potential differences in fat accretion, which differ across national or ethnic groups (15), as well as low retention to the 5-year assessment (only 54% of the initial cohort was included in these analyses). In countries with a high prevalence of pediatric obesity and type 2 diabetes, understanding how fat accretion is related to glucose–insulin homeostasis in childhood is critical for informing early life strategies to support pediatric metabolic health.
Thus, we analyzed the relationship between fat and fat-free mass accretion from birth to 5 years of age and markers of glucose-insulin homeostasis at 5 years. We considered fat mass standardized to total mass (fat mass percent, FMP), fat mass standardized to height (fat mass index, FMI), total mass standardized to height (BMI), and fat-free mass standardized to height (fat-free mass index, FFMI). We hypothesized that greater increases in adiposity (indicated by FMP and FMI), but not lean mass (FFMI), in the first 5 years of life would be associated with elevations in fasting glucose, and markers of insulin resistance and beta-cell function at 5 years of age.
Materials and Methods
Participants
The Healthy Start study is an ongoing prebirth longitudinal observational cohort based in Denver, Colorado. From 2009 to 2014, we recruited 1410 women aged ≥16 years who were <24 weeks of gestation with a singleton pregnancy from the obstetric clinics at the University of Colorado Anschutz Medical Campus. Women with chronic disease (pregestational diabetes, cancer, etc.), history of stillbirth, or history of very preterm birth (<25 weeks) were ineligible. Research visits were conducted in early pregnancy (median 17 weeks’ gestation), mid-pregnancy (median 27 weeks’ gestation), delivery (median 1 day), infancy (median 5 months), toddlerhood (median 22 months), and early childhood (median 5 years). The study protocol was approved by the Colorado Multiple Institutional Review Board and registered as an observational study on clinicaltrials.gov (NCT02273297). Women provided written informed consent at prenatal enrollment, and offspring began providing written assent at 7 years of age.
The present analysis excluded Healthy Start participants who withdrew before birth (n = 46), were born <37 weeks of gestation (n = 90) given known differences in body composition and growth relative to full-term infants (16), did not have body composition measured at birth (n = 162), did not complete the early childhood visit as of November 2019 (n = 447), did not have body composition measured at the early childhood visit (n = 77), or did not provide fasting blood samples at the early childhood visit (n = 169 [n = 69 due to nonfasting]), resulting in an analytic sample of 419 participants.
Assessment of Body Composition
Recumbent length (birth) and standing height (childhood) were measured to the nearest 0.1 cm with a stadiometer and weight was measured to the nearest 0.1 kg using an electronic scale. We used weight and length/height to calculate BMI (kg/m2). Body composition was assessed with air displacement plethysmography (PEA POD at birth; BOD POD with Pediatric Option in childhood; COSMED, Italy). These devices use a 2-compartment model to estimate fat mass (adipose tissue) and fat-free mass (water, bone, etc.), with excellent validity/reliability in infants (17) and children (18). FMP is calculated as fat mass/total mass × 100. Trained staff took 2 measurements, with a third measurement obtained when FMP differed by >2%; the average of the 2 closest measurements was used for analyses. FMI, FFMI, and BMI were calculated as the respective mass (kg)/height (m) × height (m). Weight for age (WAZ), height for age, and BMI for age z-scores at birth and in early childhood were calculated using the sex-specific World Health Organization growth charts published in 2006 (for children aged 0-60 months) and 2007 (for children aged 5-19 years).
Assessment of Metabolic Outcomes
Fasting blood samples were obtained at the early childhood visit for measurement of glucose and insulin, and analyzed at the Clinical Laboratory Improvement Amendments (CLIA)-certified Colorado Clinical and Translational Sciences Institute Core Laboratory. The computer-based homeostasis model assessment 2 was used to calculate insulin resistance (HOMA2-IR) and beta-cell function (HOMA2-B) from fasting glucose and insulin values (https://www.dtu.ox.ac.uk/homacalculator).
Covariate Assessment
Offspring race/ethnicity was obtained from self-report at the childhood visit or matched to maternal race/ethnicity when missing (n = 19 of 419). Due to small samples sizes in some racial/ethnic groups, we dichotomized race/ethnicity as non-Hispanic White and Hispanic, Black, or Other. Offspring sex, gestational age at birth, date of birth, and maternal pre-pregnancy weight were obtained from prenatal/delivery medical records. Maternal height was measured at the early pregnancy visit and used to calculate prepregnancy BMI. Smoking in pregnancy (including frequency and number of cigarettes) was assessed via self-report at the prenatal and delivery research visits. Breastfeeding and use of formula were reported at the infancy and toddler visits. We quantified breastfeeding with the breastmilk months metric (19), which reflects both duration and exclusivity of breastfeeding.
Statistical Analyses
Analyses were conducted in SAS v9.4 (SAS Institute, Cary, NC). We used general linear models to assess differences in markers of glucose-insulin homeostasis in early childhood according to body composition metrics. Separate models were conducted for change in each anthropometric predictor (FMP, FMI, FFMI, BMI, WAZ) and each metabolic outcome (glucose, insulin, HOMA2-IR, HOMA2-B), resulting in 20 total models. As predictors, we included the respective birth and change from birth to childhood body composition variables within the same model (eg, FMP at birth and FMP change from birth to childhood entered together as predictors). All models included child sex, race/ethnicity, and age at the childhood visit as covariates. We also included 2-way interaction terms between the birth and change from birth to early childhood body composition variables (eg, FMP at birth × FMP change from birth to childhood) to determine if associations with metabolic outcomes were modified by subsequent growth or size at birth. We further included interaction terms of each body composition metric with child sex or race/ethnicity (eg, FMP at birth x sex) to explore sex- and racial/ethnic-specific associations. Nonsignificant interaction terms (P > .05) were removed from the final models. Stratum-specific parameter estimates are presented when statistically significant, and main effects presented otherwise. Last, we conducted sensitivity analyses that additionally adjusted for maternal prepregnancy BMI, gestational weight gain, gestational diabetes, and breastmilk-months in the subset with complete data (n = 385 [92%] of 419; n = 1 missing gestational weight gain, n = 16 missing gestational diabetes, n = 17 missing breastmilk-months). Jackknifed studentized residuals were examined for all models to confirm assumptions of normality. The distribution of model residuals improved with natural log transformation for insulin, HOMA2-IR, and HOMA2-B; however, results were the same as with untransformed values. For ease of interpretation, we present beta estimates and confidence intervals using untransformed values. A 2-sided alpha of 0.05 defined statistical significance.
Results
Characteristics of all participants in Healthy Start (n = 1410) and those included in this analysis (n = 419) indicate that the analytic sample was representative of the full cohort (Table 1). Anthropometric, body composition, and metabolic characteristics of analyzed participants are presented in Table 2. On average, FMP increased from 9.3% (SD 3.9) at 1.7 (SD 2.2) days after birth to 19.9% (SD 6.6) at 4.8 (SD 0.7) years.
Characteristics of all Healthy Start participants (n = 1410) and those included in this analysis (n = 419)
| Full cohort n = 1410 | Analytic cohort n = 419 | |||
|---|---|---|---|---|
| Maternal characteristics | ||||
| Age at delivery (years) | 28.3 | (6.2) | 29.1 | (6.1) |
| Race (n) | ||||
| Hispanic | 351 | (25%) | 101 | (24%) |
| Non-Hispanic White | 751 | (53%) | 233 | (56%) |
| Non-Hispanic Black | 219 | (16%) | 62 | (15%) |
| Non-Hispanic Other | 89 | (6%) | 23 | (5%) |
| Pre-pregnant BMI (kg/m2) | 25.7 | (6.2) | 26.1 | (6.4) |
| Gestational weight gain (kg) | 13.2 | (6.9) | 13.7 | (5.6) |
| Gestational diabetes (n) | 55 | (4%) | 17 | (4%) |
| Prenatal smoking (n) | 124 | (9%) | 26 | (6%) |
| Maternal family history of type 2 diabetes | 149 | (11%) | 50 | (12%) |
| Father of offspring has type 2 diabetes | 17 | (1%) | 4 | (1%) |
| Offspring characteristics | ||||
| Female (n) | 646 | (48%) | 205 | (49%) |
| Gestational age at birth (weeks) | 39.2 | (2.0) | 39.6 | (1.1) |
Data are presented as mean (SD) or n(%). For offspring, full cohort data are based on 1342 live births retained to delivery.
Offspring anthropometrics, body composition, and metabolic characteristics (n = 419)
| Birth | Childhood | Change from birth to childhood | ||||
|---|---|---|---|---|---|---|
| Age (birth = days, childhood = years) | 1.7 | (2.2) | 4.8 | (0.7) | ||
| Length (cm) | 49.4 | (2.0) | 108.4 | (6.3) | 59.0 | (6.1) |
| Length for age z-score | –0.24 | (1.03) | 0.03 | (0.97) | 0.26 | (1.11) |
| Total mass (kg) | 3.2 | (0.4) | 18.3 | (3.2) | 15.1 | (3.2) |
| Total mass (weight) for age z-score | –0.01 | (0.90) | 0.14 | (0.97) | 0.15 | (1.10) |
| Body mass index (kg/m2) | 12.9 | (1.1) | 15.5 | (1.6) | 2.5 | (1.7) |
| Body mass index z-score | 0.06 | (0.93) | 0.18 | (1.02) | 0.11 | (1.18) |
| Fat mass (kg) | 0.3 | (0.1) | 3.7 | (1.7) | 3.4 | (1.6) |
| Fat mass index (kg/m2) | 1.2 | (0.6) | 3.4 | (1.4) | 2.2 | (1.5) |
| Fat-free mass (kg) | 2.9 | (0.3) | 14.6 | (2.5) | 11.7 | (2.4) |
| Fat-free mass index (kg/m2) | 11.7 | (0.8) | 13.4 | (1.6) | 1.7 | (1.7) |
| Fat mass percent (%) | 9.3 | (3.9) | 19.9 | (6.6) | 10.6 | (7.2) |
| Fasting glucose (mg/dL) | 82.5 | (7.2) | ||||
| Fasting insulin (µIU/mL) | 6.3 | (3.2) | ||||
| HOMA2-IR | 0.8 | (0.4) | ||||
| HOMA2-B | 97.2 | (27.5) |
Data are mean (SD).
There was no evidence of effect modification between size at birth and change to childhood for any body composition metric for the outcomes of glucose and HOMA2-B (all P values for interaction >.10). A significant interaction between size at birth and change to childhood for FFMI was evident for the outcomes of insulin (P = .01) and HOMA2-IR (P = .03). We also observed significant interactions of change in FMP, FFMI, and WAZ with race/ethnicity for the outcome of fasting glucose (P value for interaction = .048, .005, and .001, respectively). To facilitate interpretation across body composition metrics, we retained the interaction terms when FMI and BMI were predictors even though they did not reach statistical significance (P value for interaction = .18 and .08, respectively), and present the association between change from birth to childhood and fasting glucose separately for participants with Hispanic, Black, or Other versus non-Hispanic White race/ethnicity.
Associations of body composition metrics at birth and markers of glucose-insulin homeostasis at 4.8 years of age are presented in Fig. 1 (white bars). Only WAZ at birth was associated with fasting glucose levels in childhood (WAZ β = 1.02 [0.08-1.96]), but this was attenuated to nonsignificance in the sensitivity analysis adjusting for prepregnancy BMI, gestational weight gain, gestational diabetes, and breastfeeding (WAZ β = 0.81 [–0.23-1.85]). Greater fat mass at birth was associated with higher insulin (FMP β = 0.19 [95% CI 0.11-0.28], FMI β = 0.92 [0.38-1.45]), higher HOMA2-IR (FMP β = 0.02 [0.01-0.03], FMI β = 0.10 [0.03-0.18]), and higher HOMA2-B (FMP β = 1.66 [0.84-2.48], FMI β = 7.99 [2.88-13.10]) in childhood; these associations did not change in sensitivity analyses (data not shown). Conversely, greater fat-free mass at birth was associated with lower insulin (FFMI β = –0.79 [–1.35 to –0.23]) and lower HOMA2-IR (FFMI β = –0.09 [–0.17 to –0.02]) in childhood, although we observed a significant interaction between FFMI at birth and change to early childhood (detailed below). BMI at birth was not associated with any metabolic markers in childhood for both the main analyses and sensitivity analyses. WAZ at birth was associated with higher insulin (WAZ β = 0.68 [0.28-1.08]), HOMA2-IR (WAZ β = 0.08 [0.03-0.13]), and HOMA2-B (β = 3.74 [0.03-7.45]). The insulin and HOMA2-IR findings were not affected by further adjustment in sensitivity analyses (data not shown), but the HOMA2-B association was attenuated to non-significance (WAZ β = 3.81 [–0.23-7.86]).
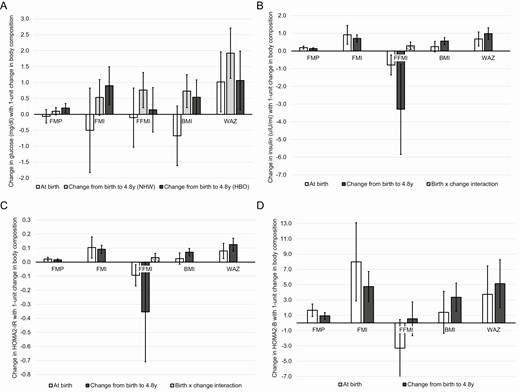
Associations of body composition metrics with fasting glucose (A, n = 380), insulin (B, n = 400), HOMA2-IR (C, n = 361), and HOMA2-B (D, n = 361) at 4.8 years. Each panel depicts associations for 5 body composition metrics (fat mass percent, fat mass index, fat-free mass index, body mass index, and weight for age z-score) with the respective glucose–insulin homeostasis outcomes, presenting both the metric at birth and the change in the metric from birth to 4.8 years. FMP, fat mass percent; FMI, fat mass index; FFMI, fat-free mass index; BMI, body mass index; WAZ, weight-for-age z-score; NHW, non-Hispanic White race/ethnicity; HBO, Hispanic, Black, or Other races/ethnicities. Data reflect β (95% confidence interval) of change in the outcome with a 1-unit change in the body composition measure, adjusted for sex, race/ethnicity, and age at the childhood visit.
Associations of the change in body composition metrics from birth to 4.8 years with markers of glucose-insulin homeostasis at 4.8 years of age are also presented in Fig. 1 (gray bars). Among participants with Hispanic, Black, or Other race/ethnicity, greater fat mass accretion was associated with higher fasting glucose in childhood (ΔFMP β = 0.20 [95% CI 0.06-0.34], ΔFMI β = 0.90 [0.30-1.50]), which did not change with further adjustment in sensitivity analyses (data not shown). Greater change in WAZ was also associated with higher fasting glucose for these participants in the main analysis (ΔWAZ β = 1.06 [0.14-1.98]), but this was attenuated to nonsignificance in the sensitivity analysis (ΔWAZ β = 0.93 [–0.09 to 1.94]). Change in FFMI and BMI were not associated with childhood glucose (ΔFFMI β = 0.14 [–0.56-0.84], ΔBMI β = 0.54 [–0.01-1.08]). In participants with non-Hispanic White race/ethnicity, greater change in FFMI, BMI, and WAZ were associated with higher fasting glucose in childhood (ΔFFMI β = 0.76 [0.21-1.32], ΔBMI β = 0.73 [0.21-1.25], ΔWAZ β = 1.92 [1.13-2.71]); with further adjustment, the estimates for change in FFMI and BMI were attenuated to nonsignificance (ΔFFMI β = 0.59 [–0.02 to 1.20], ΔBMI β = 0.51 [–0.06 to 1.07]). Fat mass accretion was not associated with childhood glucose in these participants (ΔFMP β = 0.10 [–0.02 to 0.21], ΔFMI β = 0.53 [–0.03 to 1.09]). Across all participants, greater fat mass accretion was associated with higher insulin (ΔFMP β = 0.14 [0.09-0.18], ΔFMI 0.71 [0.51-0.92]), ΔHOMA2-IR (FMP β = 0.02 [0.01-0.02], ΔFMI β = 0.09 [0.06-0.12]), and ΔHOMA2-B (ΔFMP β = 0.92 [0.18-1.36], ΔFMI β = 4.76 [2.79-6.73]), while greater fat-free mass accretion was associated with lower insulin (ΔFFMI β = –3.29 [–5.84 to –0.74]), and a trend towards lower HOMA2-IR (ΔFFMI β = –0.35 [–0.71 to 0.001]). The interaction term between FFMI at birth and change to early childhood was statistically significant for the outcomes of insulin (ΔFFMI β = 0.30 [0.08-0.51]) and HOMA2-IR (ΔFFMI β = 0.03 [0.003-0.06]), indicating that with each 1 kg/m2 increase in FFMI at birth, the inverse association between change in FFMI and insulin or HOMA2-IR was attenuated by 0.30 or 0.03 units, respectively. However, this interaction term for HOMA2-IR was attenuated to non-significance in sensitivity analyses (ΔHOMA2-IR β = 0.03 [–0.01 to 0.06]). Last, greater increase in BMI and WAZ from birth to childhood was associated with higher insulin (ΔBMI β = 0.56 [0.36-0.76], ΔWAZ β = 0.98 [0.65-1.32]), HOMA2-IR (ΔBMI β = 0.07 [0.04-0.10], ΔWAZ β = 0.12 [0.08-0.17]), and HOMA2-B (ΔBMI β = 3.36 [1.51–5.20], ΔWAZ β = 5.14 [2.01-8.27]), which were all robust to further adjustment (data not shown).
Discussion
We observed shifts in multiple markers of glucose–insulin homeostasis in early childhood according to body composition at birth and change in body composition from birth to early childhood. Greater fat mass accretion in the first 5 years of life was associated with a less optimal metabolic profile including elevations in fasting glucose, most evident among participants with Hispanic, Black, or Other races/ethnicities. Our study suggests that fat mass at birth and greater fat mass accretion in early life is specifically relevant for pediatric metabolic homeostasis, and highlights the importance of assessing fat mass from birth onward in etiologic studies of pediatric metabolic dysfunction.
Prior studies have reported that rapid gains in total body size during infancy and childhood is associated with type 2 diabetes in adulthood (2). Similar evidence for insulin resistance and impaired insulin secretion in childhood following rapid growth is also available (3-8), yet shifts in fasting glucose at such a young age have not previously been reported (4, 5, 14). In this study, we had direct measures of fat mass at birth and in early childhood and were able to assess change in fat mass versus lean mass over time. In participants of Hispanic, Black, and Other races/ethnicities, fat mass accretion, but not fat-free mass accretion, was associated with higher fasting glucose levels in childhood, even after adjustment for maternal BMI, gestational weight gain, gestational diabetes, and breastfeeding. Conversely, in participants of non-Hispanic White race/ethnicity, fat-free mass accretion, but not fat mass accretion, was associated with higher glucose levels in childhood, although this was attenuated to nonsignificance upon further adjustment for maternal and infant feeding characteristics. Results of total weight standardized to height (i.e., BMI) or standardized to similarly aged same-sex peers (ie, WAZ) similarly indicated relatively greater increases in fasting glucose among non-Hispanic white participants than Hispanic, Black, or Other racial/ethnic participants following greater change, affirming that BMI and WAZ reflect changes in fat-free mass more than fat mass, as previously noted (11, 12). Together, these results suggest that early life fat mass accretion, independent of maternal obesity and infant feeding, is particularly relevant for metabolic homeostasis in children, especially among those of Hispanic, Black, and Other races/ethnicities. We acknowledge that the estimated effects are modest, equating to differences of 3 mg/dl of glucose with respect to a 1 SD difference in fat accretion in this study population. Yet fasting glucose tracks from childhood to adolescence and adulthood (20), suggesting that the differences we observed at 5 years could persist. A prior study reported that individuals who had the highest fasting glucose at 4-18 years of age were 3 times as likely to develop type 2 diabetes in young adulthood (21), highlighting the potential significance of glucose levels in early life. The variation in glucose at 5 years in response to fat mass accretion in early childhood of age suggests that progression toward pediatric metabolic dysfunction likely begins very early in life. Continued follow-up of our participants will reveal whether the early differences in fasting glucose levels in response to fat and fat-free mass accretion observed here are involved in racial/ethnic disparities in youth-onset dysglycemia and type 2 diabetes (22).
For the other outcomes, our data indicated a consistent positive association between fat mass accretion and markers of insulin resistance or beta-cell function, along with a consistent inverse association between fat-free mass accretion and such markers. These associations did not vary by race/ethnicity or sex, were evident for both body composition at birth and change in body composition to early childhood, and were consistent regardless of whether fat mass was standardized to total mass (FMP) or total height (FMI). The significant interaction that we observed between fat-free mass at birth and change in fat-free mass to early childhood for the insulin resistance outcome suggests that the inverse association is attenuated as fat-mass accretion increases. On the other hand, the associations between change in fat mass and metabolic outcomes were not modified by starting size. Further, no such association was evident for total body mass (neither BMI nor WAZ), in contrast to prior studies that reported that individuals with lower birth weights have shifts in metabolic function at ages 7-9 especially when in combination with excessive postnatal weight gain (6-8, 23-25). This discrepancy may be due to limited power in our study relative to prior larger studies (n = 419 versus >850 (6-8, 23-25)), or differences in age of assessment, as our participants are still entering the adiposity rebound years (5-7 years (26, 27)) and have yet to commence pubertal accelerations in growth (beginning as early as 8-9 years (28)). Regardless, our present study extends prior reports of shifts in childhood metabolic function following accelerated growth (3-8) by highlighting the integral role of fat mass, rather than fat-free or total mass, in the physiology of glucose-insulin homeostasis at this young age.
Our study has strengths and limitations. A key strength was our ability to directly assess adiposity via air displacement plethysmography, which is a more rigorous method than height/weight-based calculations or skinfold measurements (17). We also examined a diverse sample of offspring, unlike prior studies enrolling >90% of participants of a single race/ethnicity (3-5, 7-9, 14), who were followed from before birth, allowing for rich phenotyping of early life exposures relevant to the present analysis. A limitation was excluding almost two-thirds of the Healthy Start cohort from this analysis, mainly because the early childhood visit was not completed or children were unwilling to provide a fasting blood sample at that time. However, similarity in the maternal/offspring characteristics of the analytic sample and the original sample confirm that the subset is a representative sample of the full cohort. The metabolic outcomes were based on a single fasting measure of glucose and insulin, as opposed to repeated testing that is often used for clinical diagnoses, and may have increased variability for the metabolic outcome measurements. We did not assess beta-cell function with glucose stimulation, and thus could not evaluate insulin secretion or beta-cell response adjusted for insulin resistance in relation to early life changes in body composition. There is a possibility of residual confounding by unmeasured variables (eg, maternal/offspring microbiota (29, 30)), which should be considered in future studies.
In conclusion, we report that greater fat mass accretion, but not fat-free mass accretion, in the first 5 years of life is associated with shifts in glucose–insulin homeostasis, including elevations in fasting glucose detectable as early as 5 years of age. These associations are particularly observed among youth of non-White race/ethnicity, who are at increased risk for early onset type 2 diabetes (22). This study underscores the relevance of body composition beginning in early life for metabolic health, and highlights the need to move beyond measurements of total body size to include more precise assessments of adiposity in pediatric research. Primordial prevention programs for pediatric metabolic dysfunction should consider adiposity as target outcome, with interventions and assessments designed accordingly. Special considerations for racial/ethnic minorities may also be warranted to better understand differential profiles of glucose-insulin homeostasis in response to early growth and changes in body composition.
Abbreviations
- BMI
body mass index
- FFMI
fat-free mass index
- FMI
fat mass index
- FMP
fat mass percent
- HOMA2-B
homeostasis model assessment-2 of beta-cell function
- HOMA2-IR
homeostasis model assessment-2 insulin resistance
- WAZ
weight for age z-score
Acknowledgments
The authors are grateful to the study coordinator Mrs. Mercedes Martinez, the study staff, and the participants for their contributions to this work.
Funding: This work was supported by the National Institutes of Health (R01DK076648, UL1TR00108, R01GM121081). Contents are the authors’ sole responsibility and do not necessarily represent views of the sponsor. The sponsor had no role in the design, conduct, or reporting of this work.
Additional Information
Disclosures: The authors have nothing to disclose.
Data Availability
Some or all datasets generated during and/or analyzed during the current study are not publicly available but are available from the corresponding author on reasonable request.
References
