


Abstract
To investigate the association between stuttering in adolescence and incident type 2 diabetes in young adulthood.
This nationwide population-based study included 2 193 855 adolescents of age 16 to 20 years who were assessed for military service between 1980 and 2013. Diagnoses of stuttering in adolescence were confirmed by a speech-language pathologist. Diabetes status for each individual as of December 31, 2016, was determined by linkage to the Israeli National Diabetes Registry. Relationships were analyzed using regression models adjusted for socioeconomic variables, cognitive performance, coexisting morbidities, and adolescent body mass index.
Analysis was stratified by sex (Pinteraction = 0.035). Of the 4443 (0.4%) adolescent men with stuttering, 162 (3.7%) developed type 2 diabetes, compared with 25 678 (2.1%) men without stuttering (adjusted odds ratio [OR] 1.3; 95% CI, 1.1-1.6). This relationship persisted when unaffected brothers of men with stuttering were used as the reference group (adjusted OR = 1.5; 95% CI, 1.01-2.2), or when the analysis included only adolescents with unimpaired health at baseline (adjusted OR = 1.4; 95% CI, 1.1-1.7). The association was stronger in later birth cohorts, with an adjusted OR of 2.4 (1.4-4.1) for cases of type 2 diabetes before age 40. Of the 503 (0.1%) adolescent women with stuttering 7 (1.4%) developed type 2 diabetes, compared with 10 139 (1.1%) women without stuttering (OR = 2.03; 95% CI, 0.48-2.20).
Adolescent stuttering is associated with an increased risk for early-onset type 2 diabetes among men.
The burden of early-onset type 2 diabetes is increasing among young adults (1). The clinical course in this population is more aggressive and associated with a higher risk for cardiovascular complications and mortality (2, 3). Identifying risk markers for early-onset type 2 diabetes is important to define populations at risk accurately (4).
Stuttering is a speech disorder that affects normal fluency, and that is characterized by repetitions of sounds, syllables, or short words (5). Its prevalence at adolescence ranges from 0.3% to 1.2% with male predominance in most countries (6, 7). There is little data regarding the risk for incident diabetes among adolescents with stuttering, possibly due to avoidant behavior of these individuals (8) and limited information regarding comorbidities. Notably, both type 2 diabetes and stuttering were linked to alterations in the hypothalamic-pituitary-adrenal axis (9, 10) and dopamine metabolism dysregulation (5, 11).
There is a unique possibility to elucidate this association in Israel. Male and female adolescents undergo a comprehensive medical and cognitive evaluation prior to mandatory military service, and a national diabetes registry exists. Using a linkage between these 2 registries, we investigated the association between stuttering at adolescence and incident type 2 diabetes in young adulthood in a nationwide cohort of 2.2 million adolescents.
Methods
Study Design and Participants
In this population-based cohort study, we included all Israeli adolescents of age 16 to 20 years who were medically evaluated for eligibility for military service between January 1, 1980, and December 31, 2013. We excluded participants with missing anthropometric data, extreme body mass index (BMI) values (below 12 or above 48 kg/m2), history of dysglycemia, or death before 2012 (the establishment of the diabetes registry) (Fig. 1). Overall, there were 1 224 494 men and 889 311 women in the final study target population. Analyses focused on the relationship between stuttering and the hazard of diabetes were restricted to the subset of people who entered the study from 1996 onwards, as this period had nearly complete (>95%) data regarding the date of diabetes onset (12). The Institutional Review Board of the Israel Defense Forces Medical Corps approved this study and waived the requirement for informed consent on the basis of preserving participants’ anonymity.
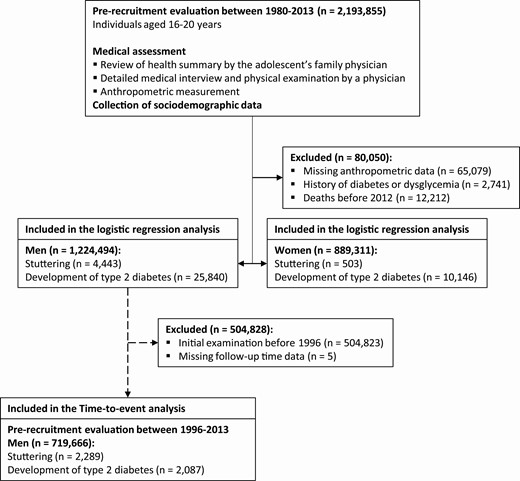
Study design and cohort buildup.
Definition of Adolescent Stuttering
Each person’s military medical assessment is performed by a physician and includes a detailed interview, a review of previous medical history, and a physical examination. This review includes all available medical records and a comprehensive health history provided by each recruit’s family physician. A concerning history or examination finding is generally followed by additional tests or consultation by a board-certified specialist to establish the diagnosis and determine medical fitness. The diagnosis of stuttering was assigned by a specific diagnostic code (ICD-10 F80.81) and confirmed by a speech-language pathologist.
The Israeli National Diabetes Registry
The primary study outcome was incident type 2 diabetes according to the Israeli National Diabetes Registry (INDR) by December 31, 2016. The INDR is a national registry of the Israeli Ministry of Health that collects demographic and treatment-related data. Since 2012, all health maintenance organizations in Israel have been required by law to report prevalent cases of diabetes every year, including the date of diagnosis for people diagnosed after January 1, 2000. Data collected at the time of military medical assessment have been linked to the INDR database using the unique civilian identification number (12). The sensitivity of the registry is 95% (13).
Diabetes was defined in cases with 3 purchases or more of glucose-lowering medications in addition to either glycated hemoglobin (HbA1c) ≥6.5% (48 mmol/mol) or serum glucose concentrations of ≥200 mg/dL (11.1 mmol/L) in 2 tests performed at an interval of at least 1 month apart. Persons who did not meet these criteria were assumed not to have diabetes. The registry captures nearly all diabetes diagnoses among permanent residents in Israel based on these criteria. Although the INDR does not receive formal data regarding the types of diabetes, it includes data regarding prescribed diabetes medications. Using this information, we defined cases of type 1 diabetes as active treatment with short-acting insulin with one of the following: (i) insulin treatment was initiated within 1 year of diabetes onset, or (ii) insulin treatment was prescribed, but not oral antidiabetic drugs. If the information on antidiabetes medications was missing, the diagnosis was referred to as diabetes of uncertain type. The remaining were classified as having type 2 diabetes. Gestational diabetes is not reported to the INDR. The INDR also includes the weight and height measurements obtained during routine clinic visits at the year diabetes diagnosis was made. Residential socioeconomic status (SES) at the year of diagnosis was reported as well using the same scale as at study entry. Post-baseline SES and BMI data were not obtained for people who were not diagnosed with diabetes. BMI that was measured at the year of diabetes diagnosis was grouped into nonobese (≤30 kg/m2) and obese (>30 kg/m2).
Study Variables
The adolescent BMI at study entry was calculated based on measured weight and height (weight in kg divided by squared height in cm). BMI categories were defined by age- and sex-matched percentiles according to the United States Centers for Disease Control and Prevention (14) and were classified into lean (<85 percentile) and high BMI categories (overweight and obese; ≥85 percentile). Residential SES based on location of residence at study entry and for participants who developed diabetes also at the date of diabetes diagnosis were obtained from records of the Israeli Ministry of Interior, which stratifies all municipalities on a 1 to 10 scale devised by the Israeli Central Bureau of Statistics according to certain economic measures (Supplementary Appendix S1) (15, 16). SES at study entry was dichotomized into low (SES 1–4) and high (SES 5–10).
Data on the number of formal years of schooling was received from the Israeli Ministry of Education and was classified into complete (12 years) or partial education. The country of birth was dichotomized into those born in and out of Israel based on data from the Israeli Ministry of Interior. Cognitive performance level was assessed by general intelligence score, a measurement strongly associated with intelligence quotient (IQ) (17) and was dichotomized by the cutoff that represents an IQ score of 100 (Supplementary Appendix S2) (16). Unimpaired health was defined as the absence of chronic morbidities, any chronically prescribed medications, history of cancer, major surgery, or any chronic disease that required a medical follow-up (18). Psychiatric disorders included personality disorders, affective disorders, psychoses, neuroses, somatoform disorders, eating disorders, pervasive developmental disorders, combat stress reaction, posttraumatic stress disorders, drug or alcohol addiction, and psychoactive substance use. The documentation of these diagnoses was made based on a preexisting diagnosis or following a proactive psychological screening that was delivered to all examinees by social workers or psychologists, as previously described (19). A board-certified psychiatrist approved all psychiatric comorbidities.
Statistical Analysis
Separate analyses were conducted for men and women because of the very different prevalence of stuttering by sex. All tests used were 2-tailed, and P < 0.05 was considered statistically significant. Logistic regression models were used to determine the odds ratios (OR) for type 2 diabetes in adolescents with and without stuttering. The adjusted model included the following variables that were assessed at study entry: age, year, BMI, country of birth, SES, cognitive performance, education, presence of chronic morbidities, and presence of psychiatric comorbidities.
Given the small number of events among women, several additional analyses were conducted selectively in men: (i) we limited the analysis to those without chronic morbidities or any psychiatric morbidities to reduce confounding by coexisting illnesses; (ii) we stratified the analysis by adolescent overweight and obesity status, demographic (country of birth, SES, education), and cognitive performance to explore possible interactions; (iii) we considered several possibilities of misclassification of type 2 diabetes—cases of unspecified type of diabetes were added to the outcome and to minimize misclassification of cases of type 1 as type 2, the definition of type 2 was limited to patients that were not treated with insulin and a stricter definition of type 2 diabetes that has over 98% positive predictive value was used (13), in which cases of type 2 diabetes were only considered if they were reported in at least 2 different years to the INDR; (iv) to reduce unmeasured confounding, we conducted a subanalysis in which unaffected brothers of men with stuttering were the reference group; and (v) to assess the role of a change in SES in adulthood, we compared changes in SES between men with and without stuttering who developed diabetes. We also conducted a subgroup analysis in which the outcome was defined as type 2 diabetes only if those men had no or only a minimal change (±1 unit in SES scale). In these subanalyses SES was modeled as a continuous variable.
Time-to-event analysis of early-onset type 2 diabetes
Cox proportional hazards models were used to determine the hazard ratio (HR) for type 2 diabetes in adolescents with and without stuttering for the subset of people who entered the study from 1996 onwards (who were therefore all diagnosed before age 40 years). The date of diabetes diagnosis was available for 1479 (70.7%) and could be imputed for an additional 608 (29.1%) of the cases as described in previous studies (12, 13) and detailed in Supplementary Appendix S3 (16). We assured that the imputation of date of diabetes diagnosis did not bias the association (Supplementary Table S1 and Fig. S3) (16). Follow-up started at the time of medical assessment and ended at diabetes onset, death, or December 31, 2016 (whichever came first). Life tables were plotted, and the proportional hazards assumption was visually confirmed. The same prespecified adjusted model was applied, and the abovementioned sensitivity analyses were conducted as appropriate. We additionally conducted a Cox adjusted model with the outcome set as type 2 diabetes before age 35 years.
Data analysis was performed using R version 3.6.0 (R Core Team, Vienna, Austria).
Results
The study target population included 4443 (0.4%) men and 503 (0.06%) women with stuttering. The annual prevalence of adolescents who stutter was stable throughout the study period (Supplementary Fig. S1) (16). Among men, age at study entry, distribution of SES, height, weight, and BMI were comparable between men with and without stuttering (Table 1). The fraction of men who scored an average IQ level or above was lower among those with stuttering than those without (71% vs 80%; P < 0.0001). There were lower fractions among men with stuttering than those without in attaining maximal education (73% vs 79%; P < 0.0001), being born in Israel (76% vs 84%; P < 0.0001), having unimpaired health at baseline (71% vs 83%; P < 0.0001), and having no history of psychiatric disorders (89% vs 96%; P < 0.0001). These differences were overall consistent in women.
Baseline Characteristics (n = 2 113 805)
| Men | Women | |||||
|---|---|---|---|---|---|---|
| Characteristic | No stuttering (n = 1 220 051) | Stuttering (n = 4443) | P value | No stuttering (n = 888 808) | Stuttering (n = 503) | P value |
| Age at examination (years) | 17.4 (0.5) | 17.5 (0.5) | 3.02 × 10–77 | 17.3 (0.4) | 17.5 (0.5) | 1.73 × 10⁻²¹ |
| Born in Israel | 1 025 382 (84.0%) | 3364 (75.7%) | 1.15 × 10–51 | 757 739 (85.3%) | 373 (74.2%) | 2.27 × 10⁻¹² |
| Socioeconomic status | 2.12 × 10⁻¹ | 2.16 × 10⁻¹ | ||||
| Low | 356 786 (29.2%) | 1349 (30.4%) | 189 436 (21.3%) | 103 (20.5%) | ||
| High | 854 127 (70.0%) | 3065 (69.0%) | 691 370 (77.8%) | 399 (79.3%) | ||
| Unknown | 9138 (0.7%) | 29 (0.7%) | 8002 (0.9%) | 1 (0.2%) | ||
| Complete high school education | 967 129 (79.4%) | 3231 (73.0%) | 1.47 × 10⁻²⁶ | 798 704 (89.9%) | 433 (86.1%) | 2.06 × 10⁻³ |
| Cognitive performance | 1.19 × 10–46 | 6.85 × 10⁻⁸ | ||||
| Below average | 234 852 (19.2%) | 1215 (27.3%) | 263 557 (29.3%) | 208 (41.4%) | ||
| Average and above | 976 018 (80.0%) | 3171 (71.4%) | 617 287 (69.5%) | 291 (57.9%) | ||
| Unknown | 9181 (0.8%) | 57 (1.3%) | 7964 (0.9%) | 4 (0.8%) | ||
| Height (cm) | 174 (6.8) | 174 (7.0) | 8.24 × 10⁻³ | 162 (6.2) | 162 (6.9) | 6.36 × 10⁻¹ |
| Weight (kg) | 66 (12.2) | 66 (12.6) | 3.65 × 10⁻³ | 57 (10.2) | 57 (10.6) | 9.82 × 10⁻¹ |
| Adolescent BMI (kg/m2) | 21.8 (3.6) | 21.7 (3.8) | 4.65 × 10⁻² | 21.8 (3.5) | 21.8 (3.7) | 8.82 × 10⁻¹ |
| BMI percentile | 46.9 (29.6) | 44.6 (30.9) | 3.46 × 10⁻⁷ | 50.2 (27.4) | 49.6 (27.7) | 6.58 × 10⁻¹ |
| BMI category | 4.26 × 10⁻¹ | 1.47 × 10⁻¹ | ||||
| Lean | 1 045 033 (85.7%) | 3787 (85.2%) | 770 319 (86.7%) | 447 (88.9%) | ||
| High | 175 018 (14.3%) | 656 (14.8%) | 118 489 (13.3%) | 56 (11.1%) | ||
| Period of birth | 1.74 × 10⁻²⁴ | 1.19 × 10⁻¹ | ||||
| 1960-1969 | 195 159 (16.0%) | 904 (20.3%) | 132 386 (14.9%) | 87 (17.3%) | ||
| 1970-1979 | 364 029 (29.8%) | 1458 (32.8%) | 262 149 (29.5%) | 158 (31.4%) | ||
| From 1980 onwards | 660 863 (54.2%) | 2081 (46.8%) | 494 273 (55.6%) | 258 (51.3%) | ||
| Period of study entry | 1.55 × 10⁻³¹ | 4.84 × 10⁻² | ||||
| 1980-1989 | 275 105 (22.5%) | 1301 (29.3%) | 190 422 (21.4%) | 127 (25.2%) | ||
| 1990-1999 | 388 310 (31.8%) | 1410 (31.7%) | 284 993 (32.1%) | 166 (33.0%) | ||
| 2000-2009 | 392 345 (32.2%) | 1142 (25.7%) | 297 986 (33.5%) | 142 (28.2%) | ||
| 2010-2013 | 164 291 (13.5%) | 590 (13.3%) | 115 407 (13.0%) | 68 (13.5%) | ||
| No chronic morbidities | 1 013 794 (83.1%) | 3152 (70.9%) | 5.44 × 10–103 | 726 624 (81.8%) | 339 (67.4%) | 7.88 × 10⁻¹⁷ |
| No psychiatric disorders | 1 168 806 (95.8%) | 3946 (88.8%) | 4.98 × 10⁻¹¹ | 873 168 (98.2%) | 478 (95.0%) | 4.45 × 10⁻⁸ |
Abbreviation: BMI, body mass index.
Stuttering and Incident Type 2 Diabetes Among Men
There was a significant interaction between stuttering, sex, and type 2 diabetes (P = 0.035). Among men with and without stuttering, there were 162 (3.6%) and 25 678 (2.1%) incident cases of type 2 diabetes, respectively (Fig. 2A), and comparable incident cases of type 1 diabetes (0.1% in both groups, P = 0.9). Stuttering was associated with type 2 diabetes with ORs of 1.76 (95% CI, 1.50-2.06) in the unadjusted model, and 1.32 (95% CI, 1.12-1.56) in the adjusted model. This association persisted when the analysis was limited to men without chronic or psychiatric morbidities (Fig. 2B).
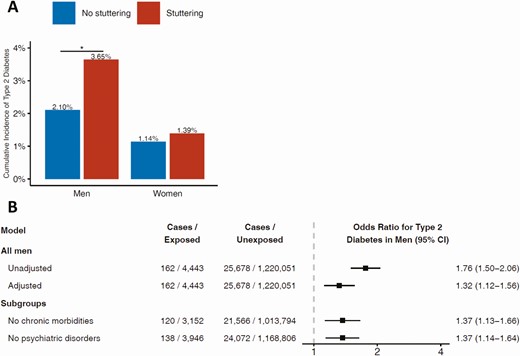
A, Incidence of type 2 diabetes among men and women with and without stuttering. B, Odds ratios of stuttering in adolescence and incident type 2 diabetes in men. The full model was adjusted for age; year; BMI; level of education; residential socioeconomic status; cognitive performance; presence of chronic morbidities; presence of psychiatric comorbidities – all at study entry, and to country of birth. The subgroups models were adjusted for all of the above besides the presence of chronic morbidities or psychiatric comorbidities, respectively.
There was no interaction between stuttering and any of the model covariates, and the association remained significant after most stratifications (Supplementary Fig. S2) (16). Importantly, results persisted in men with stuttering who were lean (OR = 1.23; 95%CI, 1.01-1.50) and in those with high BMI (OR = 1.48; 95% CI, 1.08-2.00); low (OR = 1.29; 95% CI, 1.03-1.63) and high cognitive performance (OR = 1.37; 95% CI, 1.07-1.74); low and high SES; and partial and complete school education. Results also persisted when several possibilities of type 2 diabetes misclassification were accounted for (Supplemental Fig. S4) (16) and when unaffected brothers of men with stuttering were used as the reference group (OR = 1.49; 95% CI, 1.01-2.21; for a detailed description of these nested cohort characteristics and analysis, see Supplementary Fig. S6, Table S3, and Fig. S7) (16). When the study population was stratified by birth decades, there was a gradual increase in the adjusted ORs toward more recent calendar decades; 1.21 (0.97-1.50) for men who were born in the 1960s; 1.53 (1.18-2.24) for men who were born in the 1970s; and 2.37 (1.15-5.19) for men who were born from 1980 onwards (maximal attained age at the end of study period 36 years).
Among men who developed type 2 diabetes, the changes in SES were comparable among those with and without stuttering (P = 0.26; Supplementary Fig. S8) (16). When the outcome was defined as type 2 diabetes only if those men had equal or minimal change in SES, the adjusted OR was 1.27 (1.05-1.54) (Supplementary Fig. S9) (16). Similarly, post-baseline BMI data revealed comparable levels of adulthood obesity at the year of diabetes diagnosis among those with and without stuttering (53% vs 47%, respectively; P = 0.32).
Time-to-Event Analysis of Early-Onset Type 2 Diabetes Among Men
There were 719 666 men, of whom 2289 were men with stuttering, who entered the study from 1996 and were included in the Cox analysis (Fig. 1 and Supplementary Table S2) (16). During 9 145 933 person-years and a mean follow-up of 12.7 years (SD ± 5.3), there were 20 (0.87%) and 2067 (0.29%) incident cases of type 2 diabetes among men with and without stuttering, respectively (Fig. 3A). These corresponded to an incidence of 6.82 vs 2.27 cases per 10 000 person-years, respectively. In a Kaplan-Meier analysis (Fig. 3B), the separation between the study groups was apparent after 15 years of follow-up (corresponding to an age range of 31 to 35 years). The HR for incident type 2 diabetes among men with stuttering was 2.91 (1.87-4.51) in the unadjusted model and 2.32 (1.49-3.61) in the adjusted model (Fig. 3C). There was no interaction between stuttering and any of the study variables. The hazard ratio, in general, remained similar in all strata, when accounting misclassification of type 2 diabetes, and when imputation was disregarded (Supplementary Fig. S3 and Supplementary Fig. S5) (16). Setting the outcome as incident type 2 diabetes by 35 years yielded a HR of 2.34 (1.41-3.90). When the outcome was defined as type 2 diabetes only if those men had equal or a minimal change in SES, the adjusted HR was 2.19 (1.32-3.64) (Supplementary Fig. S10) (16).
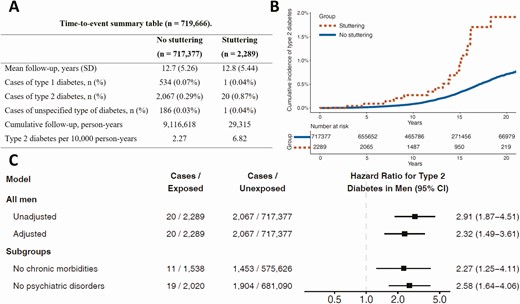
A, A time-to-event summary table of the cohort of men available between 1996-2013. B, Time-to-type-2-diabetes among men with and without stuttering. C, Hazard ratios of stuttering in adolescence and incident type 2 diabetes in men. The full model was adjusted for age; year; BMI; level of education; residential socioeconomic status; cognitive performance; presence of chronic morbidities; presence of psychiatric comorbidities – all at study entry, and to country of birth. The subgroups models were adjusted for all of the above besides the presence of chronic morbidities or psychiatric comorbidities, respectively.
Stuttering and Incident Type 2 Diabetes Among Women
Among women with and without stuttering, there were 7 (1.4%) and 10 139 (1.1%) incident cases during the entire study period, respectively. These resulted in an insignificant association between stuttering and type 2 diabetes in the unadjusted (OR = 1.22; 95% CI, 0.58-2.58) and adjusted models (OR = 1.03; 95% CI, 0.48-2.20).
Discussion
In this nationwide study, we identified an association between men with stuttering and incident type 2 diabetes with an OR of 1.3. The ORs increased gradually to approximately 2.4 as the outcome was limited to the onset of type 2 diabetes at younger ages. The strength of association persisted following adjustment and stratification to obesity status, cognitive level, coexisting morbidities, sociodemographic confounders including Israel as the country of birth, and when unaffected brothers of men with stuttering were used as the reference group. Cox proportional analysis yielded very similar point estimates to logistic regressions.
This association was not evident in women. However, considering the low prevalence of stuttering and the low incidence of type 2 diabetes in women, our study was underpowered to examine this hypothesis. Therefore, we cannot conclude whether or not an association exists in women, and this should be investigated in future studies.
The population prevalence of stuttering peaks in early childhood to about 2% to 5% (7, 20) and decreases to about 0.3% in late adolescence (6) with a 4:1 male-to-female ratio in adults who stutter (21). The stable prevalence of stuttering in our study (0.4% in men and 0.1% in women) concurs with these estimates. Notably, the prevalence of stuttering is similar across countries, cultures, and languages (22-24), from Australia with 0.3% (25) through Europe with 0.3% (6) to the United States with 0.5% to 1.2% (7, 26). Moreover, it was reported that people who stutter in Hebrew, American English, Dutch, and other languages self-perceive stuttering similarly (27). This supports the potential of the current study to be generalized to other populations.
We are unaware of previous studies investigating the association between stuttering or other speech disorders in adolescence and future risk for type 2 diabetes. Although stuttering is a prevalent medical condition, there is a paucity of data regarding the metabolic risk of adolescents and adults who stutter. This could be attributed to the common perception of adolescent stuttering as a nonmedical condition (28), a tendency of people who stutter to avoid medical encounters (8), and to the fact that treatment is delivered by speech-language pathologists (29, 30). Our results, therefore, suggest that while speech-language pathologists conduct stuttering treatment, it could be enhanced, supported, and perhaps individually tailored by a multidisciplinary collaboration with relevant medical professionals.
Various mechanisms can be speculated as potential contributors to the association between stuttering and type 2 diabetes. People with stuttering often experience social anxiety, especially in late adolescence and young adulthood (31), and were shown to have higher cortisol concentration in the saliva in reaction to stress (9). Chronic stress and increased secretion of cortisol could increase the risk for type 2 diabetes independently from obesity (32, 33). Such a pathway concurs with our observations that the association between stuttering and type 2 diabetes occurred in those with lean or excessively high BMI and that the proportions of obesity among those who developed diabetes were comparable among study groups. Second, dysregulation of brain dopamine metabolism has been tightly linked to stuttering (34), as well as the risk of developing type 2 diabetes (35). Specifically, striatal dopamine plays a role both in stuttering (36) and in the regulation of glucose metabolism (37). Third, in people who stutter, reduced cerebral blood flow and metabolism of glucose in several brain regions (eg, Broca’s region, left caudate), accompanied by an increased blood flow in other regions (38, 39), might impair glucose sensing neuronal networks in the hypothalamus that were linked to the development of type 2 diabetes mellitus (40). Fourth, structural abnormalities in the left Rolandic operculum appear in stuttering (41) and type 2 diabetes (42). These abnormalities may lead to overactivation of the right cerebral hemisphere (43, 44) and concur with a right cerebral hemisphere dominance and left-handedness observed in higher rates among people with stuttering and type 2 diabetes (45, 46). Fifth, the association between stuttering and type 2 diabetes may be mediated by sociodemographic factors. Nevertheless, residential SES at study entry and the change in residential SES were similar between the study groups; the strength of the association between stuttering and type 2 diabetes was similar in both SES strata and this association persisted when the SES changes were minimal. Regardless of the exact underlying mechanism, our findings suggest that stuttering is a risk factor or a risk marker for early-onset type 2 diabetes.
This study has several limitations. First, we lacked longitudinal clinical and lifestyle data for the entire cohort, such as stress, smoking, and physical activity which limited our ability to account for their contribution to diabetes hazard throughout young adulthood. Second, clinical data regarding familial history of diabetes and the treatment history of people with stuttering were unavailable to us. Third, as the study was not part of an intentional screening for stuttering, misclassification of the exposure is possible. However, considering evidence from the literature that misclassification of stuttering is unlikely regardless of the method of diagnosis (21, 47), the alignment of our estimates with estimates from other countries, and the consistent prevalence of stuttering throughout the years, we believe that the contribution of such misclassification is small. Finally, we lacked adequate measures to determine the severity of stuttering.
The strengths of this study include its nationwide nature with a systematic screening of a young population for stuttering, the inclusion of both sexes, systematic collection of medical, psychiatric, cognitive, and socioeconomic data, and sufficient statistical power to detect in men an association with the onset of diabetes that occurred before age 35 years. Importantly, the mandatory nature of the screening process eliminates selection bias and behaviors that favor avoidance from medical encounters. The confirmation of findings with unaffected brothers as the reference group reduces possible residual confounding.
Conclusion
This study suggests that stuttering is a risk marker for early-onset type 2 diabetes in men, but not in women. These patients, therefore, require an aggressive control of other diabetes risk factors and tighter medical follow-up. Future studies are required to confirm these results in other populations and test the role of early therapeutic interventions to prevent or delay diabetes onset.
Abbreviations
- BMI
body mass index
- HbA1c
glycated hemoglobin
- HR
hazard ratio
- INDR
Israeli National Diabetes Registry
- OR
odds ratio
- SES
socioeconomic status
Acknowledgments
Performed in part of Avishai M Tsur PhD requirements. We thank Mr. Meir Shechter, Mr. Ilan Yanov, Ms. Aliza Rosenberg, and Ms. Rebecca Sprung from Hadassah Medical Center for their thoughtful and helpful comments on the final draft of this paper.
Financial Support: No funding was received for this study.
Author Contributions: All authors meet all 4 criteria for authorship in the ICMJE recommendations. AMT and GT designed the study. AMT, GT, MF, SH, and OA conducted the literature review. AMT, GT, IZ, ML, ED, and DT acquired the data. AMT, GT, ED, and DT analyzed the data. AMT, SH, IZ, ML, OPH, AV, MF, OA, JR, HCG, TCY, LF, OM, AT, AA, IR, and GT interpreted the results. AMT and GT drafted the manuscript. All authors critically revised the manuscript. All authors and contributors approved the final version of this manuscript. All authors agree to be accountable for all aspects of the work.
Additional Information
Disclosures: All authors report there are no conflicts of interest.
Data Availability
The current manuscript was based on a military database with limited access. Summaries and aggregated data may be made available upon request; requests should be directed to [email protected].
References
Mayo Foundation for Medical Education and Research (MFMER).
