


Abstract
Type 2 diabetes is associated with a greater risk for musculoskeletal disorders, yet its impact on joint function remains unclear.
We hypothesized that patients with type 2 diabetes and osteoarthritis would exhibit musculoskeletal impairment, which would associate with insulin resistance and distinct microRNA profiles.
Participants of the German Diabetes Study with type 2 diabetes (T2D, n = 39) or normal glucose tolerance (CON, n = 27), both with (+OA) or without osteoarthritis (-OA) underwent intravenous glucose tolerance and hyperinsulinemic-euglycemic clamp tests. Musculoskeletal function was assessed by isometric knee extension strength (KES), grip strength, range of motion (ROM), and balance skills, while neural function was measured by nerve conductance velocity (NCV). Arthritis-related symptoms were quantified using the Western Ontario and McMaster Universities Osteoarthritis Index (WOMAC) questionnaire, serum arthritis-related microRNA using quantitative polymerase chain reaction.
Insulin sensitivity was lower in T2D+OA vs T2D-OA (4.4 ± 2.0 vs 5.7 ± 3.0 mg* kg–1*min–1) and in CON+OA vs CON-OA (8.1 ± 2.0 vs 12.0 ± 2.6 mg*kg–1,*min–1, both P < .05). In T2D+OA, KES and ROM were 60% and 22% lower than in CON+OA, respectively (both P < .05). Insulin sensitivity correlated positively with KES (r = 0.41, P < .05) among T2D, and negatively with symptom severity in CON and T2D (r = –0.60 and r = –0.46, respectively, P < .05). CON+OA and T2D+OA had inferior balance skills than CON-OA, whereas NCV was comparable in T2D+OA and T2D-OA. Expression of arthritis-related microRNAs was upregulated in T2D compared to CON, but downregulated in CON+OA compared to CON-OA (P < .05), and did not differ between T2D+OA and T2D-OA.
Musculoskeletal impairment and osteoarthritis-related symptoms are associated with insulin resistance. Type 2 diabetes can mask changes in arthritis-related microRNA profiles.
Osteoarthritis, a leading cause of disability, is not only a consequence of aging and mechanical stress on cartilage, but is also associated with metabolic diseases (1, 2). Recent studies have shown that type 2 diabetes is an independent risk factor predisposing to osteoarthritis (3). The deleterious impact of diabetes on joints could be linked to oxidative stress and inflammation, diabetic neuropathy, sarcopenia, and/or loss of proprioception (2-4), but is still controversially discussed.
Chronic exposure of cartilage structures to high glucose concentrations, high insulin levels, and systemic subclinical or low-grade inflammation, as typical for type 2 diabetes (5), can cause debilitation of the joint structures (6). Insulin can increase collagen and proteoglycan synthesis, yet excessive insulin levels might disrupt the integrity of musculoskeletal structures (7). Hyperglycemia and insulin resistance are additional risk factors associated with the progression and severity of arthritis in patients with diabetes, independent of obesity (8). Insulin resistance and type 2 diabetes feature chronic upregulation of oxidative stress (9). However, few studies have used in-depth metabolic phenotyping to elucidate the roles of underlying mechanisms. Despite recent advances with respect to altered cartilage metabolism, the complex interplay between metabolic factors and musculoskeletal function remains unknown (10, 11).
Furthermore, there is a paucity of data regarding specific biomarkers of early detection of joint diseases in patients with diabetes. Specific changes in biomarkers of inflammation and microRNA transcription levels have been linked to the development and progression of musculoskeletal diseases. Studies on circulating microRNAs during aging and sarcopenia detected an overlap with arthritis-related microRNA, suggesting that certain microRNAs are susceptible to different musculoskeletal-affecting conditions (12). The impact on the presence of type 2 diabetes on circulating microRNA levels is yet unclear.
In this study, we assessed metabolic characteristics as well as functional and clinical features of the musculoskeletal system of patients with type 2 diabetes and glucose-tolerant humans using comprehensive gold-standard methods in a subgroup of patients of the German Diabetes Study (GDS) (13). We hypothesized that in patients with type 2 diabetes and arthritis, musculoskeletal impairment is associated with insulin resistance, dysregulated insulin secretion, and impaired peripheral nerve function.
Methods
Volunteers
This study comprised 39 type 2 diabetes patients and 27 glucose-tolerant healthy humans (CON) with and without osteoarthritis (+OA, -OA) defined according to the criteria of the American College of Rheumatology (14). All participants were recruited from the GDS (13) following their written informed consent. The GDS is approved by the ethics committee of the Medical Faculty of Heinrich Heine University of Düsseldorf (reference No. 4508, amendments 14 and 14.1), registered at clinicaltrials.gov (identifier No. NCT01055093) and performed according to the Declaration of Helsinki as reported previously (13). Diagnosis of diabetes was based on criteria of the American Diabetes Association (15). Participants in the control group underwent oral glucose tolerance tests to exclude impaired glucose tolerance. Exclusion criteria comprise poorly controlled diabetes (glycated hemoglobin A1c [HbA1c] > 9%, 75 mmol/mol); pregnancy; acute or severe chronic heart, kidney, or liver diseases; acute systemic inflammation (clinical signs, high-sensitivity C-reactive protein [hsCRP] > 1 mg/dl); and/or ongoing immunosuppressive or immunomodulating treatments.
Modified Botnia clamp test
The modified Botnia clamp test was performed as described previously (16). Briefly, the test comprises an intravenous glucose tolerance test (IVGTT) followed by a one-step hyperinsulinemic-euglycemic clamp test with frequent measurements of blood glucose, C-peptide, and insulin (13). The IVGTT was started by injecting a 30% glucose bolus (1 mg/kgbody weight) with subsequent seriated blood sampling for 60 minutes. A priming insulin dose was then applied for 10 minutes (10 mU*kgbody weight–1*min–1) continued by constant infusion of 1.5 mU* kgbody weight–1,*min–1 (Insuman Rapid; Sanofi). Blood glucose concentration was maintained at 90 mg/dL by a variable 20% glucose infusion. Total C-peptide secretion was determined from the incremental area under the curve for C-peptide levels during the 1-hour IVGTT, and whole-body insulin sensitivity (M-value) was assessed from mean glucose infusion rates during the steady state period of the clamp.
Glucagon stimulation test
The glucagon stimulation test was performed as described previously (17). Fasting blood glucose, fasting insulin, and C-peptide levels were measured. At 0 minutes, a bolus of 1-mg glucagon (GlucaGen; Novo Nordisk) was injected intravenously and a second blood sample was obtained after 6 minutes for measurements of C-peptide (13). The difference of C-peptide concentrations between 0 minutes and 6 minutes was calculated to assess glucagon-stimulated C-peptide secretion capacity (ΔC-peptide) as a measure of β-cell function (18).
Laboratory analyses
Routine laboratory parameters were analyzed in a centralized laboratory as described previously (13). Serum concentrations of specific biomarkers were measured using commercially available Quantikine (adiponectin, interleukin-1 receptor antagonist [IL-1ra], leptin) or Quantikine HS (IL-6, tumor necrosis factor α [TNF]α) enzyme-linked immunosorbent assay kits following the manufacturer’s instructions (Bio-Techne/R&D Systems) (19, 20). Intra-assay coefficients of variation for IL-6, adiponectin, IL-1ra, TNFα, and leptin were 6.6%, 5.1%, 3.1%, 11.4%, and 5.1%, respectively. 25-OH-vitamin D3 was measured by immunoassay, which was standardized for the reference method liquid chromatography–tandem mass spectrometry. The season-independent reference value was set at 30 ng/mL (21).
Circulating microRNA quantification
The analyses were performed by TaMiRNA. The qPCR was performed on a Roche LightCycler 480 II machine with 45 amplification cycles, followed by melting curve analysis and calculation of Cq-values using the second derivative maximum method (22, 23). Total RNA was extracted using miRNEasy Mini Kit (Qiagen), and 200-µL serum were homogenized with 1000-µL Qiazol. After 10 minutes’ incubation, 200-µL chloroform was added to the lysate and a centrifugation step for 15 minutes at 12 000g at +4 °C was performed. Subsequently, 650 µL of the upper aqueous phase were mixed with 7-µL glycogen. Samples were transferred to a miRNeasy mini column, and RNA was precipitated with ethanol followed by automated washing in a Qiacube liquid-handling robot. RNA was eluted in 30-µL nuclease-free water. Synthesis of complementary DNA was performed with a miRCury LNA RT Kit (Qiagen) according to the manufacturers’ instructions. Homogeneous efficiency of all steps in the workflow was validated using spike-in controls Uni-Spike-In (UniSp) 2, 3, 4, 5, and Cel-miR-39 (22, 23). Raw Cq-values were normalized to the RNA spike-in control level (UniSp4) by subtracting the individual miRNA Cq-value from the RNA Spike-In Cq, thus obtaining δ-Cq (dCq) values that were used for the analysis.
Questionnaires
Participants were asked to complete the Western Ontario and McMaster Universities Osteoarthritis Index (WOMAC) questionnaire, a validated tool for assessing arthritis-related symptoms (24). Self-reported physical activity levels over the preceding 12 months were assessed by the German version (25) of the modified Baecke questionnaire, validated for patients with diabetes (26). The combined Baecke score was calculated as the sum of the sports, leisure, and work scores.
Joint mobility and muscle strength
The knee range of motion was measured with a goniometer in the supine position at maximum voluntary flexion and extension of both knees (27). Isometric handgrip strength was measured twice for each hand using a handgrip dynamometer (Jamar Plus+ Digital Hand Dynamometer, Jamar Technologies) in the sitting position (28). For the subsequent analysis, the computed mean of the readings from each hand was used. Knee extension strength (KES) was assessed isometrically at 90° knee flexion (Proxomed Compass 600 leg-extension device). Joint position was confirmed with a goniometer. Participants were instructed to perform 2 maximal voluntary isometric contractions for 5 seconds. The peak force of 2 trials for the right and left leg was recorded.
Balance
Balance was measured bipedal on a balance-board (S3-Check, TST), with an unstable tilting between the left/right and anterior/posterior. Postural control was defined by the Stability Index and Sensorimotor Index as previously described (29), and balance was quantified as a percentage of predicted values according to validated norms (30).
Spiroergometry
Participants performed an incremental exhaustive exercise test for recording maximum aerobic capacity (VO2max). Exhaustion was defined according to the statement of the American Thoracic Society and the American College of Chest Physicians on cardiopulmonary exercise testing (31).
Bioimpedance analysis
Bioimpedance analysis (BIA) was used for the estimation of fat mass and fat-free mass (BioElectrical Impedance Analyzer System, RJL Systems).
Peripheral nerve function testing
Motor nerve conduction velocity (NCV) was measured in the peroneal nerve, sensory NCV, and sensory nerve action potentials were determined in the sural nerve at a skin temperature of 33 °C to 34 °C using surface electrodes (Nicolet VikingQuest, Natus Medical).
Magnetic resonance imaging of the hand
Images of the dominant hand and wrist were obtained on a whole body 3-T magnetic resonance scanner (Philips Achieva 3T; Philips Electronics Healthcare) by using a surface coil. The patients were positioned prone with the arm extended overhead toward the midline. First, wrist magnetic resonance imaging (MRI) with the field of view restricted from the carpus extending to the metacarpal bases was performed. Then the coil was moved distally, and the hand MRI with the field of view including the metacarpophalangeal joints the phalanges was performed (32, 33). All images were acquired without use of contrast substances.
The imaging protocols included axial and coronal T1–weighted and T2-weighted fat-suppressed images of the hand and wrist as well as 3-dimensional imaging with high cartilage signal using low flip angles for wrist MRI. Images were evaluated using MRI scoring (RAMRIS) (32) by 2 trained independent, blinded assessors. Tenosynovitis was scored in 10 wrist tendon compartments on a scale from 0 to 3 (33).
Bone mineral density
Measurements were performed in a subgroup of patients (n = 36) at the lumbar spine (L2-L4, LS) and at the femoral neck bilaterally, by dual-energy x-ray absorptiometry using a Lunar DPX-NT (GE Healthcare) bone densitometer. T-scores were calculated and evaluated according to World Health Organization criteria (osteoporosis [T-score < −2.5 SD], osteopenia [T-score from − 1 to − 2.5 SD], and normal (T-score > −1 SD]) (34).
Statistics
This study represents a cross-sectional analysis of data from a subgroup of participants in an ongoing observational study (GDS). Data are presented as mean (SD) or median (first quartile and third quartile) for continuous variables and percentages for categorical variables. Skewed data were log-transformed before analysis when appropriate. To account for multiple group comparisons, the Bonferroni correction was applied. Associations between parameters have been evaluated using Spearman and adjusted (partialized) Spearman correlation coefficients (r), and corresponding P values are given. Statistical adjustments for age, sex, and BMI were performed using general linear regression models. Statistical analyses for qPCR data comprised hierarchical clustering using Euclidean distance and complete linkage was performed. For the analysis of differentially regulated circulating microRNAs, normal distribution was confirmed using the Shapiro-Wilk test. Subsequently, 2-sided t tests were performed and P values were adjusted for multiple testing using the Benjamini-Hochberg method for false-discovery rate calculation. P values less than 5% were considered to indicate significant differences or correlations. Statistical analyses were performed with SAS (version 9.3; SAS Institute). Graphs were generated using GraphPad Prism 8.
Results
Patients’ characteristics
The main anthropometric and metabolic characteristics of the study population are presented in Table 1. Patients with type 2 diabetes had a higher body mass than glucose-tolerant individuals (P < .05). Further stratification for OA (Table 2) shows that patients with OA did not differ with regard to age between the control group and the diabetes group. All subsequent statistical analyses were adjusted for age, sex, and BMI.
Participants’ characteristics stratified by glucose tolerance status
| CON | T2D | |
|---|---|---|
| No. | 27 | 39 |
| Male/female, No. | 16/11 | 19/20 |
| Age, y | 53.1 ± 15.4 | 58.7 ± 10.9 |
| Known diabetes duration, y | – | 4.1 ± 3.5 |
| BMI, kg/m2 | 27.5 ± 4.7 | 33.3 ± 6.7a |
| Fat-free mass, kg | 58.1 ± 12.7 | 57.9 ± 11.7 |
| Fat mass, % | 31.9 ± 6.6 | 38.6 ± 7.7a |
| Fasting blood glucose, mg/dL | 86.6 ± 6.3 | 147 ± 38a |
| HbA1c, % | 5.2 ± 0.2 | 6.9 ± 0.9a |
| M-value, mg*kg–1,*min–1 | 10.8 ± 3.2 | 5.2 ± 2.7a |
| ΔC-peptide, ng/mL | 4.2 ± 1.7 | 3.0 ± 1.3a |
| IVGTT C-peptide secretion, iAUC, a.u. | 175 ± 64 | 89 ± 62a |
| hsCRP, mg/dL | 0.17 ± 0.20 | 0.47 ± 0.80a |
| Vitamin D, ng/mL | 27 ± 13 | 22 ± 12 |
| IL-1ra, pg/mL | 465 ± 266 | 819 ± 387a |
| IL-6, pg/mL | 1.8 ± 1.4 | 4.3 ± 3.5a |
| TNFα, pg/mL | 0.6 ± 0.6 | 1.0 ± 1.0 |
| Leptin, pg/mL | 13 805 ± 12 463 | 27 342 ± 21 774a |
| Adiponectin, ng/mL | 8145 ± 4031 | 5340 ± 2730a |
Data are shown as absolute numbers or mean ± SD.
Abbreviations: a.u., arbitrary units; BMI, body mass index; CON, glucose-tolerant control group; ΔC-peptide, glucagon-stimulated C-peptide secretion; HbA1c, glycated hemoglobin A1c; hsCRP, high-sensitivity C-reactive protein; iAUC, incremental area under the curve; IL-6, interleukin-6; IL-1ra, interleukin-1 receptor antagonist; IVGTT, intravenous glucose tolerance test; T2D, type 2 diabetes; TNFα, tumor necrosis factor α.
aP less than .05 vs CON adjusted for age, sex, and BMI.
Participants’ characteristics stratified by glucose tolerance status and osteoarthritis
| CON | T2D | |||
|---|---|---|---|---|
| CON-OA | CON+OA | T2D-OA | T2D+OA | |
| No. | 17 | 10 | 22 | 17 |
| Male/female, No. | 8/9 | 8/2 | 14/8 | 5/12 |
| Age, y | 48.8 ± 12.9 | 60.2 ± 6.3 | 58.3 ± 12.4 | 60.3 ± 9.2a |
| Known diabetes duration, y | – | – | 3.4 ± 3.3 | 4.9 ± 3.5 |
| BMI, kg/m2 | 26.3 ± 4.4 | 29.5 ± 4.1 | 31.7 ± 6.4a | 35.6 ± 6.6a,b |
| Fat-free mass, kg | 52.4 ± 10.6 | 63.1 ± 14.7 | 59.1 ± 10.1 | 56.4 ± 13.6 |
| Fat mass, % | 30.1 ± 7.6 | 32.8 ± 4.3 | 35.5 ± 8.3 | 42.4 ± 4.6a,b,c |
| Fasting blood glucose, mg/dL | 87.1 ± 6.0 | 87.7 ± 4.6 | 146 ± 42a,b | 156 ± 34a,b |
| HbA1c, % | 5.2 ± 0.2 | 5.3 ± 0.2 | 6.9 ± 1.1a,b | 6.8 ± 0.5a,b |
| M-value, mg*kg–1,*min–1 | 12.0 ± 2.6 | 8.1 ± 2.0a | 5.7 ± 3.0a,b | 4.4 ± 2.0a,b,c |
| ΔC-peptide, ng/mL | 3.8 ± 1.6 | 4.9 ± 1.7 | 3.0 ± 1.4a,b | 3.1 ± 1.3a,b |
| IVGTT C-peptide secretion, iAUC, a.u. | 163 ± 58 | 200 ± 71 | 100 ± 68a,b | 75 ± 53a,b |
| hsCRP, mg/dL | 0.13 ± 0.14 | 0.26 ± 0.26 | 0.40 ± 0.25 | 0.32 ± 0.40 |
| 25-OH Vitamin D, ng/mL | 29 ± 14 | 21 ± 14 | 21 ± 10 | 23 ± 15 |
Data are shown as absolute numbers or mean ± SD.
Abbreviations: a.u., arbitrary units; BMI, body mass index; CON, glucose-tolerant control group; ΔC-peptide, glucagon-stimulated C-peptide secretion; HbA1c, glycated hemoglobin A1c; hsCRP, high-sensitivity C-reactive protein; iAUC, incremental area under the curve; IVGTT, intravenous glucose tolerance test; OA, osteoarthritis; T2D, type 2 diabetes.
aP less than .05 vs CON-A.
bP less than .05 vs CON+A.
cP less than .05 vs T2D-A.
Metabolic characteristics
As expected, the type 2 diabetes group had higher fasting blood glucose and HbA1c levels compared to glucose-tolerant patients (P < .05). Furthermore, the degree of insulin resistance and β-cell dysfunction was also higher in patients with type 2 diabetes compared to glucose-tolerant participants. Glucose-tolerant individuals with OA presented with 31% lower insulin sensitivity than glucose-tolerant individuals without OA (P < .05). Similarly, insulin sensitivity was 25% lower in patients with type 2 diabetes and OA compared to those without OA (P < .05). These differences remained significant after adjustments for age, sex, and BMI. The levels of 25-OH vitamin D3 were similar between groups. However, 76% of all patients had 25-OH vitamin D3 levels below the recommended lower threshold of 30 ng/mL. Furthermore, 25-OH vitamin D3 correlated negatively with the waist-to-hip ratio (r = –0.41, P < .01) in patients with type 2 diabetes.
Musculoskeletal parameters
As expected, the severity of symptoms related to musculoskeletal disease as expressed by the WOMAC score was higher in participants with OA compared to those without (Fig. 1A). The WOMAC score was negatively associated with insulin sensitivity among both control and diabetes groups (r = –0.60, P < .01 and r = –0.46, P < .01, respectively) as well as with fasting blood glucose levels (r = 0.25, P < .05). The Sensorimotor Index and the Stability Index both were higher in the control group without OA compared to all other groups (Fig. 1B and 1C, all P < .05). Muscle strength, KES (Fig. 1D), as well as hand grip strength (Fig. 1E) was lower in patients with type 2 diabetes and osteoarthritis compared to controls with osteoarthritis. KES and hand grip strength were positively correlated across all groups (r = 0.72, P < .01). KES was positively associated with insulin sensitivity in the diabetes group (r = 0.41, P < .05). We further observed a reduced range of motion in patients with type 2 diabetes with and without OA compared to healthy controls (Fig. 1F). To exclude main possible confounders, all analyses were adjusted for age, sex, and BMI.
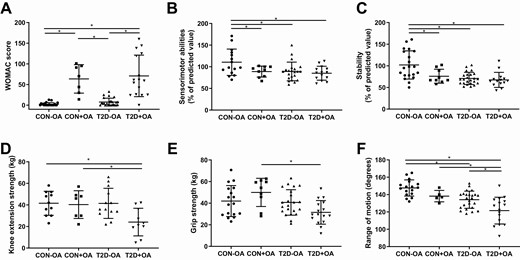
Musculoskeletal function. Parameters of musculoskeletal function in individuals with normal glucose tolerance and no osteoarthritis (CON-OA, circles), with osteoarthritis (CON+OA, squares), patients with type 2 diabetes without osteoarthritis (T2D-OA, triangles), and with osteoarthritis (T2D+OA, inverted triangles) showing osteoarthritis-related symptoms quantified by the A, Western Ontario and McMaster Universities Osteoarthritis Index (WOMAC) score; B, sensorimotor abilities; C, stability; D, knee extension strength; E, grip strength; and F, knee range of motion. Data shown as individual values and bars for mean and SD. P values refer to comparison of data adjusted for age, sex, and body mass index. Data were ln-transformed where applicable. *P less than or equal to .05.
Self-reported habitual physical activity levels did not show any differences between groups. Similarly VO2max was 2914 ± 724 mL/min in glucose-tolerant participants and 1859 ± 563 mL/min in patients with diabetes (P > .05). Further stratification did not reveal any differences between individuals with and without osteoarthritis with regard to VO2max.
Among glucose-tolerant individuals, patients with OA showed lower NCV of the peroneal nerve (Fig. 2A, P < .05). Furthermore, the NCV of the median nerve was reduced in both groups of patients with type 2 diabetes compared to the control group without OA (Fig. 2B, both P < .05). On adjustment for sex- and age-referenced values, a similar trend was observed (P < 0.1) with regard to differences in the prevalence of diminished NCV between groups.
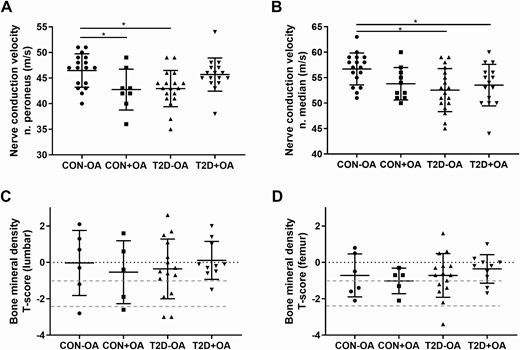
Parameters of nerve function and bone mineral density. Parameters of nerve and bone function in individuals with normal glucose tolerance and no osteoarthritis (CON-OA, circles), with osteoarthritis (CON+OA, squares), patients with type 2 diabetes without osteoarthritis (T2D-OA, triangles), and with osteoarthritis (T2D+OA, inverted triangles) showing nerve conduction velocity in the A, peroneus nerve, and the B, median nerve; C, bone mineral density in the lumbar spine; and D, the femoral neck. Dotted red lines correspond to the World Health Organization criteria for osteoporosis (T-score < −2.5 SD), osteopenia (T-score from − 1 to − 2.5 SD), and normal (T-score > −1 SD). *P less than or equal to .05.
There was no difference in the BMD between groups, even after adjustments for age, sex, and BMI. Of note, about 30% of patients were newly diagnosed with osteopenia or osteoporosis (Fig. 2C and 2D). Furthermore, in glucose-tolerant individuals, lumbar BMD correlated positively with insulin sensitivity and negatively with βcell function (r = 0.66, P < .05 and r = –0.75, P < .05, respectively), but no association was observed for patients with type 2 diabetes.
The RAMRIS score showed a great interrater reliability (κ coefficient for synovitis κ = 0.94, osteitis κ = 1.00, and erosions κ = 0.87) but high individual variation between patients in all groups, showing no overall differences between groups (data not shown).
Biomarkers of adipose tissue function and inflammation
The data on adiponectin, TNFα, IL-6, IL1ra, and leptin (Fig. 3A-3E) revealed a tendency toward upregulation in participants with type 2 diabetes and OA, especially with regard to IL-1ra and leptin even adjusting for age, sex, and BMI. Leptin was associated with higher HbA1c and lower muscle strength (Fig. 3F and 3G), whereas IL-1ra correlated with OA-related symptom severity (Fig. 3H). Adiponectin was negatively associated with HbA1c and fasting blood glucose (r = –0.40 and r = –0.39, respectively; both P < .01).
![Biomarkers of adipose tissue function and inflammation. A, Adiponectin; B, tumor necrosis factor α (TNF)α; C, interleukin (IL)-6; D, IL-1 receptor antagonist (ra); and E, leptin levels in individuals with normal glucose tolerance and no osteoarthritis (CON-OA, circles), with osteoarthritis (CON+OA, squares), patients with type 2 diabetes without osteoarthritis (T2D-OA, triangles), and with osteoarthritis (T2D+OA, inverted triangles). Correlation analyses (Spearman correlation coefficient r and respective P value) between biomarkers of inflammation (leptin and IL-1ra) and F, glycemic control (glycated hemoglobin [HbA1c]); G, muscle strength; as well as H, symptom severity (Western Ontario and McMaster Universities Osteoarthritis Index [WOMAC] score). *P less than or equal to .05 adjusted for age, sex, and body mass index.](https://oup.silverchair-cdn.com/oup/backfile/Content_public/Journal/jcem/106/4/10.1210_clinem_dgaa912/4/m_dgaa912_fig3.jpeg?Expires=1750213031&Signature=bpEmzJWyvbyJ-sdLNRDpFRaCaLyq5uIOpciqOd3zncGdaD5~NfzHHaAAw-QTOTjzvKuCrSq0zJPUPDtCIGH1Fh1xCPsi0LF5hf6Saj5PqPGDWWTL1ZgRqHMj-kcMXPefLOhthiqocBX7j6ZeuoG4J1e4VR2bPGCJfKTL5lzACmz~98-8C4zIBgmTl3ZEvqWQUqRkKKTqHALMIWn2h8USFAhM30fS~V9EXYalDaE~-dyLN1BV9KF60cgResBLl5wrJivKgh9yfjrtCG-cr3H50jEjRHEAuwr8~d~TJ8LQ9yWvvNuu4bxblm2oAypPw-4Zoqg-kOxUaRLkciNa6PRjNQ__&Key-Pair-Id=APKAIE5G5CRDK6RD3PGA)
Biomarkers of adipose tissue function and inflammation. A, Adiponectin; B, tumor necrosis factor α (TNF)α; C, interleukin (IL)-6; D, IL-1 receptor antagonist (ra); and E, leptin levels in individuals with normal glucose tolerance and no osteoarthritis (CON-OA, circles), with osteoarthritis (CON+OA, squares), patients with type 2 diabetes without osteoarthritis (T2D-OA, triangles), and with osteoarthritis (T2D+OA, inverted triangles). Correlation analyses (Spearman correlation coefficient r and respective P value) between biomarkers of inflammation (leptin and IL-1ra) and F, glycemic control (glycated hemoglobin [HbA1c]); G, muscle strength; as well as H, symptom severity (Western Ontario and McMaster Universities Osteoarthritis Index [WOMAC] score). *P less than or equal to .05 adjusted for age, sex, and body mass index.
MicroRNA profiles
A total of 374 microRNAs were analyzed per individual. Overall, 66 microRNAs showed an adjusted P value of less than .05 when comparing patients with type 2 diabetes and controls. In general, we observed a strong trend toward upregulation of microRNAs in patients with type 2 diabetes (Fig. 4A). A total of 88 microRNAs showed an adjusted P value of less than .05 for comparison between patients with OA and those without, irrespective of glucose tolerance status. In general, there was a trend toward downregulation of the measured microRNAs in OA (Fig. 4B). Surprisingly, in the diabetes group, no microRNA was different between patients with OA and those without (all P > .05) after Benjamini-Hochberg correction of multiple testing.
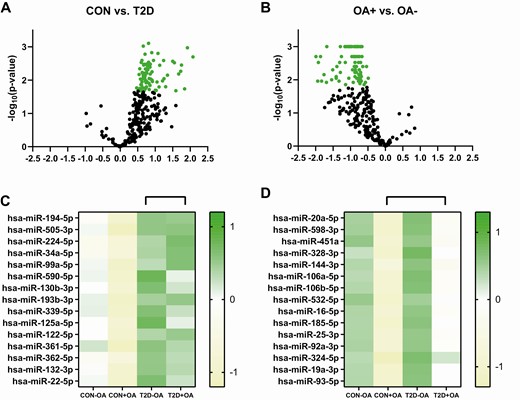
microRNA expression levels. Differences in microRNA expression levels between individuals with normal glucose tolerance (CON) and patients with type 2 diabetes (T2D) are depicted as a volcano plot with statistically significant different microRNAs marked as A, green circles showing a tendency for upregulation in patients with type 2 diabetes. Further stratification of the top 15 statistically different microRNAs is presented in a heat map for individuals with normal glucose tolerance without osteoarthritis (CON-OA), with osteoarthritis (CON+OA), patients with type 2 diabetes without osteoarthritis (T2D-OA), and with osteoarthritis (T2D+OA). Differences in microRNA expression levels between individuals with osteoarthritis (+OA) and patients without osteoarthritis (-OA) are depicted as volcano plot with statistically significant different microRNAs marked as B, green circles showing a tendency for downregulation in individuals with normal glucose tolerance without osteoarthritis. Further stratification of the top 15 statistically different microRNAs is presented in a heat map for individuals with normal glucose tolerance without osteoarthritis (CON-OA), with osteoarthritis (CON+OA), patients with type 2 diabetes without osteoarthritis (T2D-OA), and with osteoarthritis (T2D+OA). Green shades depict upregulation, whereas yellow shades depict downregulation.
Discussion
This study shows that (i) glucose-tolerant individuals with OA are more insulin resistant and have a lower NCV and inferior balance skills than glucose-tolerant individuals without OA; and (ii) patients with type 2 diabetes and OA have lower insulin sensitivity and lower range of motion compared to both patients with type 2 diabetes without OA and glucose-tolerant individuals with or without OA. Furthermore, this study confirms that (iii) microRNA profiles previously associated with arthritis are downregulated in glucose-tolerant participants with OA compared to participants without OA, but do not differ between type 2 diabetes patients with OA and without OA.
Previous reports in adults age 18 to 64 years showed that the prevalence of OA was 52% in those with type 2 diabetes compared to 27% in those without type 2 diabetes (35, 36). Because OA and type 2 diabetes share common risk factors such as obesity, inactivity, and aging, these features may explain the higher prevalence of OA in the patients with type 2 diabetes. In the present cohort of recent-onset patients with type 2 diabetes and metabolically healthy individuals, the overall prevalence of self-reported OA (13% vs 7%) was lower than previously reported (36). This is most likely due to the very short diabetes duration and the good state of health of this study population (13).
Insulin resistance in patients with type 2 diabetes has been suggested to promote the progression of OA regardless of body mass (37, 38). Recent studies attribute the association between insulin resistance and OA to increased expression of proinflammatory cytokines, as well as the production of tissue-degrading enzymes and downregulation of the synthesis of structural proteins of the articular cartilage (39). We expand on these observations, showing that in our study population the severity of OA symptoms is associated with insulin resistance irrespective of the glucose tolerance. In both the type 2 diabetes and the control group, patients with OA exhibited a reduced insulin sensitivity by more than 25% compared to individuals without OA. Compared with only 1 in 27 patients from the glucose-tolerant group, 20 of 39 patients with diabetes had an M-value below the threshold of 3.5 mg*kg–1,*min–1, reflecting insulin resistance (40).
There is evidence that vitamin D may be involved in the regulation of adipose tissue mass and metabolism, whereas vitamin D deficiency might contribute to obesity (41), and studies have suggested that vitamin D supplementation might exert a protective effect both on diabetes and OA (42). Along these lines, we observed that individuals with low 25-OH vitamin D3 levels have the highest waist-to-hip ratios. Nevertheless, previous studies on the effects of vitamin D supplementation in diabetes yielded conflicting results, with recent interventions showing no effect on insulin sensitivity or glycemic control in patients with well-controlled diabetes (43). Currently, evidence is lacking that vitamin D supplementation would prevent OA or benefit already diagnosed OA patients beyond standard of care treatment (44). Levels of 25-OH vitamin D3 also did not correlate with BMD in our study. The noteworthy rate of undiagnosed osteopenia and osteoporosis, which was in line with previously reported studies (45), warrants intensified screening programs and corresponding treatment in patients with diabetes.
Previous studies have shown a correlation between limited joint mobility and the risk of major complications such as the diabetic foot in type 2 diabetes patients (46). The afflictions of individual joints can reflect a global joint disability with severe consequences on mobility and functionality of the limbs and are associated with impaired quality of life (47). We observed a reduced range of motion in the knee joints in patients with type 2 diabetes, independent of OA. This association was present even after adjusting for BMI, suggesting that the differences have a metabolic link beyond body mass and could be related to the impact of hyperglycemia on collagen structure and function (48). Furthermore, selected biomarkers (IL-1ra, adiponectin, and leptin) correlated with parameters of glycemic control. Along these lines, previous studies suggested that mechanical overload and systemic inflammatory mediators derived from adipose tissue and dysregulated metabolic mediators such as adipokines, free fatty acids, advanced glycation end products, and glucose toxicity may increase the risk of obesity-induced OA (2). Furthermore, patients with OA (49) and type 2 diabetes (9) likely share increased oxidative stress as a common feature. In our study, some biomarkers showed a trend toward an increase in type 2 diabetes compared to metabolically healthy individuals, but no such differences were observed between those with and without OA within the respective groups. Solely leptin was higher in type 2 diabetes patients with OA compared to those without OA. In line, recent preclinical studies suggest that leptin exerts a novel peripheral effect on the regulation of chondrocyte metabolism and may play an important role in the pathophysiology of OA (50). Also along these lines, previous studies showed that leptin and IL-1ra levels, but not adiponectin, were associated with OA progression and severity, and partially contributed to the association between obesity and OA (51, 52). Taken together, these findings point to dysglycemia and inflammation as aggravating factors of musculoskeletal manifestation of OA.
microRNAs play essential roles in the regulation of various biological processes involved in the pathogenesis of OA, including differentiation of bone cells and bone formation, resorption, and remodeling (53). It has further been suggested that combinations of microRNAs that reflect different tissue-specific physiologic conditions might serve as valuable signature biomarkers for the early diagnosis of multifactorial diseases such as OA (54). Therefore, we used microRNA analyses to identify novel biomarkers related to OA specifically in patients with type 2 diabetes. Previous studies identified decreased miR-140-3p, miR-33b-3p, and miR-671-3p as potential biomarkers for the evaluation of OA risk and progression in patients with diabetes (55). In our exploratory analysis, however, the expression of microRNA was decreased overall in patients with OA. There was an upregulation of microRNA in patients with type 2 diabetes that contrasted with the downregulation observed in patients with OA. Subsequent stratified analyses showed there was no difference between patients with type 2 diabetes with and without OA in any of the arthritis-related microRNAs. This suggests that diabetes-related metabolic alterations could possibly mask changes in arthritis-associated microRNA expression profiles.
The strength of our study lies in combining deep phenotyping of metabolic and musculoskeletal parameters and state-of-the-art microRNA analyses to allow for a comprehensive view of the metabolic impact on OA. This approach naturally limits the sample size of the study population. Furthermore, the inclusion of patients with well-controlled diabetes and exclusion of patients with immunosuppressive treatment, used in severe cases of arthritis, leads to a selected patient sample that may not be representative of the general diseased population. The lack of radiographic quantification of the OA constitutes a limitation of this study. Furthermore, OA can be affected by aging and increased BMI, which cannot be completely excluded as confounding factors to the observed differences between groups despite appropriate statistical adjustments applied in the present study. Nevertheless, the present study expands the mechanistic insights on the interplay between type 2 diabetes and OA, diseases which are frequently concomitant.
In conclusion, our study shows that insulin resistance is associated both with musculoskeletal function and arthritis-related symptoms in patients with type 2 diabetes and metabolically healthy individuals. These results suggest that treating musculoskeletal disorders in patients with diabetes should also aim at treating the metabolic components of the disease.
Abbreviations
- BIA
bioimpedance analysis
- BMD
bone mineral density
- BMI
body mass index
- CON
glucose-tolerant healthy humans
- GDS
German Diabetes Study
- HbA1c
glycated hemoglobin A1c
- hsCRP
high-sensitivity C-reactive protein
- IL-6
interleukin-6
- IL-1ra
interleukin-1 receptor antagonist
- IVGTT
intravenous glucose tolerance test
- KES
knee extension strength
- MRI
magnetic resonance imaging
- NCV
nerve conductance velocity
- OA
osteoarthritis
- qPCR
quantitative polymerase chain reaction
- ROM, range of motion; TNFα
tumor necrosis factor α
- VO2max
maximum aerobic capacity
- WOMAC
Western Ontario and McMaster Universities Osteoarthritis Index.
Acknowledgments
The authors wish to thank the staff of the Clinical Research Center, Institute for Clinical Diabetology at the German Diabetes Center, for their excellent work. The GDS group consists of M. Roden (speaker), H. Al-Hasani, A.E. Buyken, B. Belgardt, V. Burkart, G. Geerling, C. Herder, A. Icks, K. Jandeleit-Dahm, J. Kotzka, O. Kuß, E. Lammert, J.H. Hwang, W. Rathmann, J. Szendroedi, S. Trenkamp, D. Ziegler, and their colleagues who contributed to the design and conduct of the GDS. Furthermore, we thank Dr J. Grillari and Dr M. Hackl from TaMiRNA Laboratory and their staff for their excellent support.
Financial Support: The GDS was initiated and financed by the German Diabetes Center (DDZ), which is funded by the German Federal Ministry of Health and the Ministry of Culture and Science of the State of North Rhine-Westphalia and from the German Federal Ministry of Education and Research (BMBF) to the German Center for Diabetes Research (DZD), SFB 1116, German Research Foundation (DFG), and the Schmutzler Stiftung, Germany. The BMBF further financed this project as part of the Consortia Investigating the Metabolic Impact on Joint Disease (01EC1407E).
Clinical Trial Information: Clinicaltrials.gov (identifier No. NCT01055093) (registered January 25, 2010).
Author Contributions: O.P.Z. wrote the manuscript and researched the data. D.H.P., Y.Ku., Y.Ka., G.J.B., J.K., D.S., A.K., and D.F.M. contributed to the acquisition, analysis, and interpretation of the data. P.B. performed the statistical analyses. C.H., J.H.H., G.S., D.Z., K.M., V.B., J.S., and M.R. researched the data, contributed to the discussion, and reviewed/edited the manuscript. All authors critically reviewed the manuscript. J.S. is the guarantor of this work and, as such, had full access to all the data in the study and takes responsibility for the integrity of the data and the accuracy of the data analysis. All authors read and approved the final manuscript.
Additional Information
Disclosures: The authors have nothing to disclose.
Data Availability
The data sets generated during and/or analyzed during the present study are not publicly available because they are subject to national data protection laws and restrictions imposed by the ethics committee to ensure the data privacy of the study participants. However, they can be applied for through an individual project agreement with the principal investigator of the GDS. The study protocol as well as the individual methods have been published in the cohort profile (13) and are unrestrictedly available.
References
