


Abstract
Oral once-daily dual-release hydrocortisone (DR-HC) replacement therapy has demonstrated an improved metabolic profile compared to conventional 3-times-daily (TID-HC) therapy among patients with primary adrenal insufficiency. This effect might be related to a more physiological cortisol profile, but also to a modified pattern of cortisol metabolism.
This work aimed to study cortisol metabolism during DR-HC and TID-HC.
A randomized, 12-week, crossover study was conducted.
DC-HC and same daily dose of TID-HC were administered to patients with primary adrenal insufficiency (n = 50) vs healthy individuals (n = 124) as controls.
Urinary corticosteroid metabolites were measured by gas chromatography/mass spectrometry at 24-hour urinary collections.
Total cortisol metabolites decreased during DR-HC compared to TID-HC (P < .001) and reached control values (P = .089). During DR-HC, 11β-hydroxysteroid dehydrogenase type 1 (11β-HSD1) activity measured by tetrahydrocortisol + 5α-tetrahydrocortisol/tetrahydrocortisone ratio was reduced compared to TID-HC (P < .05), but remained increased vs controls (P < .001). 11β-HSD2 activity measured by urinary free cortisone/free cortisol ratio was decreased with TID-HC vs controls (P < .01) but normalized with DR-HC (P = .358). 5α- and 5β-reduced metabolites were decreased with DR-HC compared to TID-HC. Tetrahydrocortisol/5α-tetrahydrocortisol ratio was increased during both treatments, suggesting increased 5β-reductase activity.
The urinary cortisol metabolome shows striking abnormalities in patients receiving conventional TID-HC replacement therapy, with increased 11β-HSD1 activity that may account for the unfavorable metabolic phenotype in primary adrenal insufficiency. Its change toward normalization with DR-HC may mediate beneficial metabolic effects. The urinary cortisol metabolome may serve as a tool to assess optimal cortisol replacement therapy.
In developed countries, primary adrenal insufficiency is most often the result of autoimmune destruction of the adrenal cortex. Before the availability of glucocorticoid (GC) therapy, about 80% of patients with primary adrenal insufficiency died within several months of diagnosis. Adrenal extract, then purified GCs, and finally the availability of synthetic hydrocortisone (HC) have dramatically changed the prognosis of the disease (1). Because of a short half-life, conventional HC therapy requires several doses to achieve sufficient coverage during the day: It usually involves a higher dose in the morning, a lower dose around midday, and, if necessary, a third dose in the late afternoon (2). However, patients with both primary (3, 4) and secondary (5, 6) adrenal insufficiency still demonstrate increased morbidity and mortality resulting from cardiovascular diseases and infection. It has been postulated that this could be induced by current modes of GC replacement and depends on various factors including excess weight, central adiposity, impaired glucose tolerance, dyslipidemia, and immunosuppression (7-11).
In the absence of suitable biomarkers for optimizing GC replacement, supraphysiological doses are often used to achieve sufficient clinical control while focusing on the patients’ subjective health status (12). Moreover, a strategy of dose reduction in patients with hypopituitarism and adrenal insufficiency did not improve blood pressure or glucose metabolism, whereas effects on weight reduction were inconsistent (13, 14). The supraphysiological GC maintenance dose may not therefore fully explain the adverse metabolic profile observed in patients (9). Furthermore, conventional GC treatment does not allow the restoration of a normal circadian rhythm of cortisol exposure. Evening exposure to cortisol leads to adverse changes in glucose metabolism compared to morning exposure (15). The nonphysiological cortisol exposure-time profile with conventional therapy may also contribute to the adverse metabolic profile observed in patients. Therapeutic trials with continuous subcutaneous infusion of HC using a pump with a flow rate mimicking a normal circadian rhythm have shown an improvement in the quality of life of patients; however, the duration of the trials was limited and, to date, no improvement of metabolic parameters has been clearly shown (16-18).
Two new HC formulations with modified release have been designed to obtain a more physiological circadian cortisol exposure: a once-daily dual-release HC (DR-HC) tablet based on an immediate-release coating with an extended-release core (19, 20); and a twice-daily modified-release HC tablet based on a multilayer design with an external coat providing delayed and sustained release of HC before final release of an inner HC coat, which is under development for the management of congenital adrenal hyperplasia (21, 22). The DR-HC formulation has been studied in primary and secondary adrenal insufficiency with improvement observed in cardiovascular risk factors (eg, glucose metabolism, body weight, waist circumference) as well as in quality of life (11, 23-25). It was conjectured that the reduction in late afternoon and 24-hour cortisol exposure might, in part, explain this observation but other mechanisms may be involved.
The tissue-specific metabolism of GC plays a critical role in the control of GC hormone action. Apparent mineralocorticoid excess arises when the renal metabolism of cortisol by 11β-hydroxysteroid dehydrogenase type 2 (11β-HSD2) is impaired. Conversely, local activation of cortisol from cortisone by 11β-hydroxysteroid dehydrogenase type 1 (11β-HSD1) in key GC target tissues (eg, liver, adipose tissue, bone) can augment local GC effects (26, 27). Because 11β-HSD1 is induced by cortisol itself, it is reasonable to postulate that some of the consequences of current GC replacement therapies may relate to altered tissue 11β-HSD1 activity. Other cortisol metabolic pathways, notably involving 5α-reductase and 5β-reductase, have been postulated to play similar roles (28). Urinary steroid profiling offers an opportunity to assess these pathways in large populations.
The aim of our study was to define alterations in cortisol metabolism in patients receiving immediate-release HC and DR-HC treatment compared to healthy controls. We also assessed the possibility that modifications in cortisol metabolism might have an impact on the metabolic outcome of patients with adrenal insufficiency.
Materials and Methods
Participants and design
This study was an open, controlled, randomized, 2-armed, 2-period, 12-week, crossover, multicenter trial comparing once-daily DC-HC and the same daily dose delivered as 3-times-daily conventional HC (TID-HC) in patients with primary adrenal insufficiency (EudraCT: 2006-0007084-83; clinicaltrials.gov ID: NCT00915343). The method as well as the pharmacokinetic and metabolic results of this study have been published previously (23). Briefly, patients with primary adrenal insufficiency diagnosed more than 6 months before study entry were included. Any medication or agents that could interfere with cortisol metabolism within 14 days before the start of the study and ongoing treatment with dehydroepiandrosterone or oral estrogens were not allowed. Mineralocorticoid or levothyroxine replacement therapy was stable for 3 or more months before inclusion. Patients were on a stable HC dose for 3 or more months before entering the study, which was kept constant throughout the study. Patients on twice-daily therapy were transferred 4 weeks before random assignment to a TID-HC oral regimen with the same total daily dose.
Patients underwent standardized in-house pharmacokinetic sampling including either reduced sampling after 7 to 8 days into the 12-week crossover periods (blood samples collected at 0, 5, 10, 15, 20, 25, 30, 45, 60, and 90 minutes and 2, 3, 4, 5, 6, 8, and 24 hours) or full sampling at the start of each 12-week period (in addition to the reduced sampling, blood samples collected at 10, 12, 14, 16, and 18 hours) and reduced sampling at the end of each treatment period. Area under the concentration-time curve (AUC) for serum cortisol was calculated using WinNonlin software version 5.2 (Pharsight Corp). The AUC0-10h and AUC10-24h reflects the cortisol exposure during the first 10 hours after the morning HC intake (morning and afternoon exposure) and the last 14 hours (evening and night exposure) of the 24-hour period, respectively. Only patients affected by autoimmune primary adrenal insufficiency were selected for this analysis; those with a history of bilateral adrenalectomy for Cushing disease were excluded.
Ethical committee approval at the Sahlgrenska Academy, Gothenburg, by the Swedish Medical Product Agency, and patients’ informed consent were obtained before entering the study.
Control data for the urinary steroid profile were obtained from a cohort of healthy volunteers that has been previously published (29).
Assays
Urinary samples (used for 24-hour free cortisol measurement) were available after each 12-week treatment period in one arm (full pharmacokinetic profile) including 15 patients. Urinary samples were available after 1 week of each treatment period in the second arm (reduced pharmacokinetic profile) including 35 patients.
Excretion of steroids and cortisol metabolism were assessed using gas chromatography/mass spectrometry measurement of urinary steroids at the Centre for Endocrinology, Diabetes and Metabolism, University of Birmingham using previously reported methodology (30). Briefly, steroids were extracted from urine via solid-phase extraction, followed by deconjugation and derivatization to produce methyloxime-trimethylsilyl-ethers. Gas chromatography/mass spectrometry analysis was performed using an Agilent 5973 instrument. Steroids were quantified based on selected-ion-monitoring transitions relative to calibration steroid standards. Thirty-two steroids are targeted for selected-ion-monitoring analysis including metabolites of androgens, mineralocorticoids, GCs, and their precursors. In this study, we focused on the main metabolites of cortisol (F): 6β-hydroxy-cortisol (6β-OH-F), cortisone (E), tetrahydrocortisol (THF), 5α-tetrahydrocortisol (5α-THF), tetrahydrocortisone (THE), α-cortol, β-cortol, α-cortolone, and β-cortolone.
The summation of urinary cortisol and its main metabolites (THF, 5α-THF, α-cortol, β-cortol, E, THE, α-cortolone, and β-cortolone) was defined as 24-hour total cortisol metabolites (TCMs) and used as a marker of the daily cortisol excretion rate (31). The activity of enzymes involved in cortisol metabolism was evaluated by calculation of ratios between products and substrates (Fig. 1). The ratios of (THF + 5α-THF)/THE and the urinary free E/urinary free F (UFE/UFF) were used as markers of 11β-HSD1 and 11β-HSD2 activity, respectively, as previously reported and validated (32-34). Activity of 5α-reductase and 5β-reductase were evaluated by the absolute value of 5α-THF and THF, respectively, in urine and the balance between the 2 enzymes by the ratio THF/5α-THF (35). The activity of the 20β-hydroxydehydrogenase (20β-HSD) and the 20α-hydroxydehydrogenase (20α-HSD) were evaluated by the ratios α- and β-cortols/THF and α- and β-cortolones/THE.
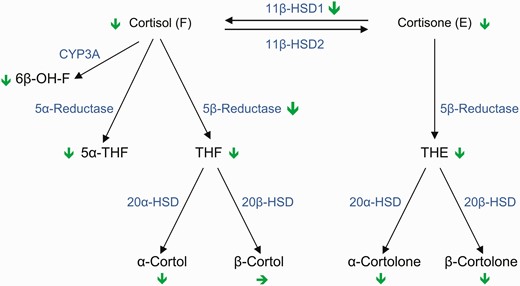
Cortisol metabolism and its modification by DR-HC compared to TID-HC. Schematic representation of the different enzymatic steps of cortisol metabolism and metabolites changes as well as the changes of main enzyme activities (indicated by green arrows: pointed down indicates decrease and to right in no change) comparing TID-HC to DR-HC. 5α-THF, 5α-tetrahydrocortisol; 6β-OH-F, 6β-hydroxy-cortisol; 11β-HSD1, 11β-hydroxysteroid dehydrogenase type 1; 11β-HSD1, 11β-hydroxysteroid dehydrogenase type 2; 20α-HSD, 20α-hydroxysteroid dehydrogenase; 20β-HSD, 20β-hydroxysteroid dehydrogenase; CYP-3A, cytochrome P450A; DR-HC, dual-release hydrocortisone; THE, tetrahydrocortisone; THF, tetrahydrocortisol; TID-HC, 3-times-daily hydrocortisone.
Statistical analysis
Quantitative variables were summarized using means and SDs if parametrically distributed or medians and interquartile range if nonparametrically distributed. Parametric and nonparametric data were compared between controls and patients using a paired t test and a Mann-Whitney test, respectively. Adjusted P values (for weight, age, and sex) were calculated using logistic regression with control/patient as the dependent variable. The Wilcoxon signed-rank test was used to compare quantitative variables between patients in the 2 treatment groups. Period-adjusted P values were calculated by analyzing the change from treatment period 1 to period 2 (standard crossover analysis method) using the Mann-Whitney U test with treatment during the first period as the group variable. Associations between variables were analyzed using the Pearson correlation for parametric data and Spearman rank correlation for nonparametric data. The level for statistical significance was set at P less than .05. Statistical analysis and plots were performed using SAS (version 9.4 SAS Institute Inc) and R (version 3.4.2) software.
Results
Clinical characteristics and outcome of treatment
Fifty patients (22 women and 28 men) with primary adrenal insufficiency were included in the analysis. Their mean (± SD) age was 46.9 ± 13.4 years (range, 19-71 years). The control group included 124 healthy individuals (73 women and 51 men) with mean age 47.6 ± 17.2 years (range, 20-81 years) (Table 1). After 12 weeks’ treatment, body weight and systolic blood pressure decreased with DR-HC compared to TID-HC with no difference in diastolic blood pressure (see Table 1). There was no difference between the steroid changes between weeks 1 and 12 (data not shown) so these data were therefore pooled.
Characteristics for controls and patients with primary adrenal insufficiency and change in patients vs baseline or cortisol area under the curve values
| Baseline | Change in patients vs baseline or cortisol AUC values | P | |||
|---|---|---|---|---|---|
| Controls (n = 124) | Patients (n = 50) | DR-HC | TID-HC | ||
| Age, y | 47.6 (17.2) | 46.9 (13.4) | – | – | .8 |
| Sex | .11 | ||||
| Male | 51 (41.1%) | 22 (44%) | – | – | |
| Female | 73 (58.9%) | 28 (56%) | – | – | |
| Weight, kg | 70.4 (12.7) | 77.5 (14.3) | 0.014 (1.85) | –0.56 (1.95) | .041a |
| BMI, kg/m2 | 24.8 (3.1) | 25.5 (3.97) | |||
| SBP, mm Hg | 128.8 (16.8) | 122.3 (18.9) | 1.15 (9.42) | –2.84 (10.74) | < .001a |
| DBP, mm Hg | 76.8 (11.8) | 75.5 (11.0) | 1.04 (7.69) | 0.18 (6.62) | .24a |
| Replacement dose, mg/d | – | – | 30.1 (5.5) | 30.4 (5.6) | .15 |
| Cortisol AUC0-10h, nmol/L ∙ h | – | – | 3840 (1032) | 3503 (916) | .011 |
| Cortisol AUC10-24h, nmol/L ∙ h | – | – | 1095 (763) | 517 (544) | < .001 |
Results are presented as n (%) for categorical variables and mean (± SD) for continuous variables.
Abbreviations: AUC0-10h, area under the serum concentration-time curve from baseline to 10 hours; AUC10-24h, area under the serum concentration-time curve from 10 to 24 hours; BMI, body mass index; DBP, diastolic blood pressure; DR-HC, dual-release hydrocortisone; SBP, systolic blood pressure; TID-HC, 3-times-daily hydrocortisone.
aPeriod-adjusted P value.
Excretion of steroids in patients receiving 3-times-daily hydrocortisone therapy compared to controls
With conventional TID-HC, UFF and UFE excretion were 3-fold higher in patients than in controls (both P < .001 after adjustment for sex, age, and weight). However, TCMs were similar in both groups. Among the F and E metabolites, only THF and 6β-OH-F were increased with TID-HC compared to controls, whereas THE, α-THF, α-/β-cortols, and α-/β-cortolones were similar or lower (Table 2). The UFE/UFF ratio was decreased in the TID-HC group compared to controls (P < .01). The increased (THF + 5α-THF)/THE ratio in the TID-HC group (P < .001) suggested increased activity of 11β-HSD1. The increased THF/α-THF ratio (P < .001) together with the increased THF level (P < .001) and the normal α-THF (P = .03) indicated increased β-reductase activity rather than decreased α-reductase activity (see Table 2). Ratios between THF and α- or β-cortols or THE and α- or β-cortolones were increased in patients receiving TID-HC, suggesting decreased activity both of 20α-HSD and 20β-HSD, respectively (see Table 2).
Urinary cortisol metabolites and ratios in controls and patients receiving dual-release hydrocortisone and 3-times-daily hydrocortisone
| Controls | Patients | Adjusted P | |||||
|---|---|---|---|---|---|---|---|
| TID-HC | DR-HC | Difference TID-HC–DR-HC | Controls vs TID-HCa | Controls vs DR-HCa | TID-HC vs DR-HCb | ||
| Steroids, μg/24 h | |||||||
| UFF | 48 (36 to 66) | 149 (93 to 239) | 84 (56 to 127) | 59 (26 to 125) | < .001 | < .001 | < .001 |
| THF | 1259 (838 to 1615) | 2558 (1758 to 3178) | 1617 (1229 to 2128) | 913 (425 to 1360) | < .001 | .02 | < .001 |
| 5α-THF | 1000 (553 to 1481) | 1202 (755 to 1891) | 859 (473 to 1334) | 280 (99 to 466) | .3 | .001 | < .001 |
| α-Cortol | 242 (177 to 317) | 271 (228 to 366) | 181 (139 to 256) | 101 (38 to 158) | .77 | < .001 | < .001 |
| β-Cortol | 408 (259 to 574) | 352 (229 to 526) | 285 (200 to 650) | 19 (–75 to 110) | .85 | .92 | .74 |
| UFE | 76 (60 to 100) | 225 (156 to 280) | 144 (97 to 195) | 66 (25 to 124) | < .001 | < .001 | < .001 |
| THE | 2364 (1735 to 3231) | 2445 (1995 to 3142) | 1817 (1398 to 2291) | 656 (151 to 1214) | .07 | < .001 | < .001 |
| α-Cortolone | 966 (714 to 1306) | 755 (573 to 905) | 534 (399 to 713) | 193 (75 to 336) | < .001 | < .001 | < .001 |
| β-Cortolone | 532 (372 to 698) | 420 (293 to 539) | 327 (222 to 460) | 92 (–5 to –168) | < .001 | < .001 | < .001 |
| 6β-OH-F | 106 (81 to 154) | 213 (121 to 378) | 99 (68 to 185) | 86 (49 to 175) | < .001 | .8 | < .001 |
| TCM | 6850 (4930 to 9159) | 8825 (6838 to 10 888) | 6380 (4421 to 7874) | 2337 (1239 to 4112) | .52 | .004 | < .001 |
| Steroids ratio | |||||||
| UFE/UFF | 1.56 (1.32 to 1.84) | 1.41 (1.14 to 1.59) | 1.64 (1.37 to 1.97) | –0.24 (–0.47 to –0.07) | < .001 | .85 | < .001 |
| (THF + 5α-THF)/THE | 0.89 (0.74 to 1.09) | 1.38 (1.2 to 1.75) | 1.39 (1.05 to 1.62) | 0.09 (–0.04 to 0.37) | < .001 | < .001 | .003 |
| THF/5α-THF | 1.26 (0.93 to 1.71) | 2.27 (1.28 to 3.34) | 1.98 (1.30 to 3.549) | 0.02 (–0.21 to 0.40) | < .001 | < .001 | .32 |
| Cortols/THF | 0.50 (0.42 to 0.67) | 0.28 (0.22 to 0.34) | 0.33 (0.24 to 0.44) | –0.06 (–0.17 to –0.01) | < .001 | < .001 | < .001 |
| Cortolones/THE | 0.62 (0.53 to 0.72) | 0.45 (0.4 to 0.56) | 0.47 (0.4 to 0.58) | –0.01 (–0.04 to 0.02) | < .001 | < .001 | .12 |
| α-Cortol/THF | 0.20 (0.17 to 0.25) | 0.12 (0.1 to 0.14) | 0.11 (0.1 to 0.14) | –0.00 (–0.01 to 0.01) | < .001 | < .001 | .74 |
| α-Cortolone/THE | 0.41 (0.33 to 0.48) | 0.29 (0.25 to 0.34) | 0.28 (0.24 to 0.36) | –0.01 (–0.01 to 0.03) | < .001 | < .001 | .3 |
| β-Cortol/THF | 0.29 (0.23 to 0.42) | 0.14 (0.11 to 0.21) | 0.19 (0.14 to 0.35) | –0.05 (–0.16 to –0.01) | < .001 | .067 | < .001 |
| β-Cortolone/THE | 0.21 (0.18 to 0.25) | 0.16 (0.14 to 0.2) | 0.17 (0.15 to 0.23) | –0.01 (–0.03 to 0.00) | .41 | .7 | < .001 |
Results are presented as median (interquartile range).
Abbreviations: 5α-THF, 5α-tetrahydrocortisol; 6β-OH-F, 6β-hydroxy-cortisol; DR-HC, dual-release hydrocortisone; TCM, total cortisol metabolites; THE, tetrahydrocortisone; THF, tetrahydrocortisol; TID-HC, 3-times-daily hydrocortisone; UFE, urinary free cortisone; UFF, urinary free cortisol.
a P value adjusted for age, sex, and weight using logistic regression.
bPeriod-adjusted P value.
Excretion of steroids in patients receiving dual-release hydrocortisone compared to 3-times-daily hydrocortisone therapy
UFF, UFE, and TCM excretion were all lower in patients receiving DR-HC than during TID-HC therapy. The UFE/UFF ratio (P < .001) and the (THF + 5α-THF)/THE ratios (P < .01) were respectively increased and decreased during DR-HC compared to TID-HC therapy, suggesting increased activity of 11β-HSD2 and decreased activity of 11β-HSD, respectively (see Table 2 and Fig. 2). The excretion of THF (P < .001) and α-THF both were decreased (P < .001), suggesting that β-reductase and α-reductase activity, respectively, were reduced with DR-HC compared to TID-HC. This is supported by a similar THF/α-THF ratio with both treatments despite these changes (see Table 2 and Fig. 2). Finally, the ratios of α-cortol/THF and α-cortolone/THE were similar with DR-HC and TID-HC, whereas the ratios of β-cortol/THF and β-cortolone/THE decreased, suggesting similar 20α-HSD but decreased 20β-HSD activity, respectively (see Table 2).
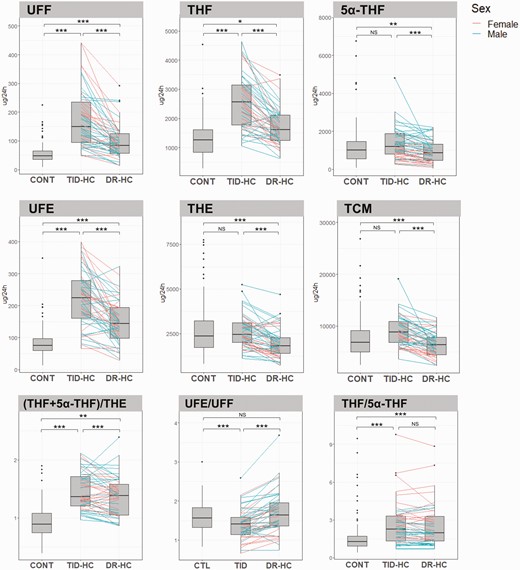
Comparison of steroid excretion and urinary enzyme activity in controls and patients receiving TID-HC or DR-HC. Data are shown as box and whisker plots. The pink and blue lines represent individual changes in cortisol metabolites and enzyme activity for women and men, respectively, between TID-HC and DR-HC. Two patients (Nos. 004-057 and 004-0590) were excluded from the figure for the (THF + 5α-THF)/THE and THF/5α-THF ratios, respectively. The (THF + 5α-THF)/THE ratio evaluates 11β-HSD1 activity. The UFE/UFF ratio evaluates 11β-HSD2 activity. The THF/5α-THF ratio evaluates the balance of 5β-reductase and 5α-reductase activities. Statistical analysis: *P less than .05; **P less than .01; ***P less than .001. CTL vs patient comparisons adjusted for sex, weight, and age; and TID-HC vs DR-HC comparisons adjusted for treatment period. 5α-THF, 5α-tetrahydrocortisol; 11β-HSD1, 11β-hydroxysteroid dehydrogenase type 1; 11β-HSD2, 11β-hydroxysteroid dehydrogenase type 2; CONT, control; DR-HC, dual-release hydrocortisone; NS, not statistically significant; TCM, total cortisol metabolites; THE, tetrahydrocortisone; THF, tetrahydrocortisol; TID-HC, 3-times-daily hydrocortisone; UFE, urinary free cortisone; UFF, urinary free cortisol.
Excretion of steroids in patients receiving dual-release hydrocortisone therapy compared to controls
During DR-HC, UFF and the UFE excretion (both P < .001) was higher than in controls. TCM excretion was lower than in controls (P < .001) (see Fig. 2). The main cortisone and cortisol metabolites were reduced to levels similar to controls values during DR-HC treatment. THF alone remained higher than in controls (see Table 2). Regarding enzymatic activity, the UFE/UFF ratio returned to similar to controls, whereas the (THF + 5α-THF)/THE ratio remained higher during treatment with DR-HC (see Fig. 2). Thirty-four of 50 patients showed a decreased (THF + 5α-THF)/THE ratio with DR-HC compared to TID-HC (Fig. 3).
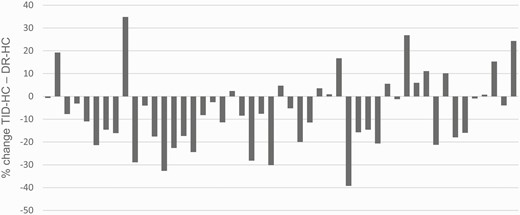
Percentage of change in the ratio (THF + 5α-THF)/THE between treatment with TID-HC and DR-HC for each individual patient. 5α-THF, 5α-tetrahydrocortisol; DR-HC, dual-release hydrocortisone; THE, tetrahydrocortisone; THF, tetrahydrocortisol; TID-HC, 3-times-daily hydrocortisone.
The THF/α-THF ratio (P < .001) and THF excretion (P < .05) remained higher, and α-THF excretion (P < .001) was lower than in controls, suggesting β-reductase activity remained higher even though α-reductase activity might have decreased (see Table 2 and Fig. 2). Ratios evaluating 20β-HSD and 20α-HSD suggested that these enzyme activities remained lower than in controls (see Table 2).
Impact of cortisol exposure and hydrocortisone dose on cortisol metabolites
All individual metabolites and TCMs correlated positively with the daily replacement dose during both TID-HC and DR-HC treatment with the exception of the 5α-THF for DR-HC (Table 3). Notably, only UFE, UFF, and 6β-OH-F were positively correlated with the AUC0-10h under both therapies, whereas THF excretion was positively correlated only during DR-HC treatment and 5α-THF excretion was negatively correlated during TID-HC treatment. UFE/UFF and THF/α-THF ratios were also negatively and positively correlated to AUC0-10h with both treatments, respectively. This suggests that daily cortisol exposure is associated with 11β-HSD2 activity and with the balance of β-reductase/α-reductase activity where the association is stronger for α-reductase activity with TID-HC and for β-reductase activity with DR-HC. Interestingly, there was no correlation with measures of 11β-HSD1 activity and cortisol exposure. No cortisol metabolites were correlated with AUC10-24h in patients receiving TID-HC, whereas UFE and UFF were positively correlated with this late evening and night-time exposure during DR-HC treatment (see Table 3).
Correlation of urinary cortisol metabolites and ratios, replacement dose, and area under the curve
| Cortisol replacement dose (mg/d) | AUC0-10h (nmol/L ∙ h) | AUC10-24h (nmol/L ∙ h) | ||||
|---|---|---|---|---|---|---|
| TID-HC | DR-HC | TID-HC | DR-HC | TID-HC | DR-HC | |
| UFF | 0.42108 (.002) | 0.41702 (.003) | 0.59184 (< .001) | 0.65493 (< .001) | 0.11284 (.43) | 0.34406 (.01) |
| THF | 0.69851 (< .001) | 0.53536 (< .001) | 0.23736 (.097) | 0.27914 (.05) | –0.03026 (.83) | 0.25522 (.07) |
| 5α-THF | 0.29205 (.04) | 0.27152 (.06) | –0.58745 (< .001) | –0.09782 (.50) | –0.10744 (.46) | 0.20845 (.15) |
| UFE | 0.49905 (< .001) | 0.46251 (< .001) | 0.42857 (.002) | 0.48235 (< .001) | –0.00932 (.95) | 0.29354 (.04) |
| THE | 0.54583 (< .001) | 0.44747 (.001) | –0.21133 (0.14) | –0.01311 (.93) | –0.01052 (.94) | 0.25157 (.08) |
| 6β-OH-F | 0.51207 (< .001) | 0.49501 (< .001) | 0.39688 (.004) | 0.64043 (< .001) | 0.01624 (.91) | 0.20845 (.15) |
| TCM | 0.67499 (< .001) | 0.51652 (< .001) | –0.11235 (.44) | 0.11088 (.44) | –0.11035 (.45) | 0.28355 (.05) |
| UFE/UFF | –0.11635 (.42) | –0.12233 (0.40) | –0.5128 (< .001) | –0.52932 (< .001) | –0.13498 (.35) | –0.24274 (.09) |
| (THF + 5α-THF)/THE | 0.27558 (.05) | 0.06390 (.066) | 0.09765 (.50) | 0.22679 (.11) | –0.03491 (.81) | 0.03337 (.82) |
| THF/5α-THF | 0.07959 (.59) | –0.00216 (.99) | 0.67184 (< .001) | 0.32917 (.020) | 0.03501 (.81) | –0.11107 (.44) |
| α-Cortol | 0.60638 (< .001) | 0.37965 (.006) | 0.19866 (.17) | 0.30833 (.029) | 0.00086 (.99) | 0.24082 (.09) |
| β-Cortol | 0.52099 (< .001) | 0.37252 (.008) | 0.19846 (.17) | 0.13124 (.36) | 0.15929 (.27) | 0.16744 (.25) |
| α-Cortolone | 0.50111 (< .001) | 0.40878 (.003) | 0.06113 (.67) | 0.18070 (.21) | –0.06283 (.66) | 0.24082 (.09) |
| β-Cortolone | 0.50922 (< .001) | 0.48186 (< .001) | –0.17532 (.22) | –0.01983 (.89) | –0.03838 (.79) | 0.12202 (.40) |
Results are presented as Spearman correlation coefficient (P value).
Abbreviations: 5α-THF, 5α-tetrahydrocortisol; 6β-OH-F, 6β-hydroxy-cortisol; AUC0-10h, area under the serum concentration-time curve from baseline to 10 hours; AUC10-24h, area under the serum concentration-time curve from 10 to 24 hours; DR-HC, dual-release hydrocortisone; TCM, total cortisol metabolites; THE, tetrahydrocortisone; THF, tetrahydrocortisol; TID-HC, 3-times-daily hydrocortisone; UFE, urinary free cortisone; UFF, urinary free cortisol.
Correlation between clinical outcome and cortisol metabolites
There were no significant correlations between the changes in body weight, systolic blood pressure, and diastolic blood pressure and the changes in cortisol metabolites between the 2 periods of treatment (data not shown).
Discussion
In this study, 24-hour urinary cortisol metabolome profiling showed that patients with primary adrenal insufficiency treated with conventional TID-HC replacement therapy had higher cortisol exposure compared to healthy individuals with alterations in tissue-specific metabolism of glucocorticoids, notably higher 11β-HSD1 activity. Treatment with DR-HC decreased cortisol exposure and shifted the cortisol urinary metabolome profile toward normal (see Fig. 1).
Patients treated with TID-HC had higher cortisol exposure than controls as suggested by the elevation of TCM, UFF (35), and 6β-OH-F (36). In addition, a significant increase in 11β-HSD1 activity was observed in patients with TID-HC. In vitro studies and animal models have showed that GCs enhance 11β-HSD1 activity (26). The increased 11β-HSD1 activity with TID-HC may also reflect the higher tissue exposure to cortisol in patients compared to controls. The 11β-HSD1 enzyme is highly expressed in the liver, adipose tissue, and skeletal muscle, playing an important role in the regulation of many metabolic processes including lipid and glucose metabolism (26). Its expression is increased in adipose tissue in obese patients, in whom it may contribute to metabolic complications including insulin resistance, dyslipidemia, and hypertension (26). Increased 11β-HSD1 activity may therefore contribute to the adverse metabolic profile observed in patients with adrenal insufficiency (2).
Replacement therapy with DR-HC decreased both daily and evening/night time cortisol exposure compared to conventional TID-HC as demonstrated by the decreased AUC0-10h and AUC10-24h. Accordingly, a decrease in the excretion of free cortisol, cortisone, and their metabolites was observed with DR-HC compared to TID-HC. This led also to a normalization of cortisol exposure according to urinary excretion of TCMs, UFF, and 6β-OH-F. Interestingly, these 2 last markers correlated positively with the replacement dose and the AUC0-10h, whereas TCMs were not correlated with the AUC0-10h. Treatment with DR-HC leads to decreased 11β-HSD1 activity compared to TID-HC. However, although statistically significant, the magnitude of reduction was small. Reduced activity of 11β-HSD1 improves features of metabolic syndrome in mouse models and human studies (26). Decreased 11β-HSD1 activity may also mediate some of the beneficial metabolic effects observed with this treatment (11, 23-25). However, despite normalization of cortisol exposure, 11β-HSD1 activity still remained higher in patients with DR-HC than in controls. Notably, 11β-HSD1 activity was not correlated with replacement dose or AUC0-10h, which is in accordance with another study of patients with hypopituitarism using a different dose of conventional HC therapy (35). This suggests that factors others than cortisol exposure itself modify the activity of this enzyme, such as route of administration and circadian exposure profile.
11β-HSD2 is mainly expressed in the kidneys and protects the mineralocorticoid receptor from cortisol occupancy by inactivating cortisol to cortisone. Animal models and human studies suggest a role for 11β-HSD2 in salt-sensitive hypertension (26). The increased 11β-HSD2 activity observed with DR-HC may play a role in the reduced blood pressure observed in patients.
When treated with either TID-HC or DR-HC, patients had higher 5β-reductase activity compared to controls. It has been suggested that 5β-reductase activity might be induced by GCs (27). In contrast to 5α-reductase, whose activity was not markedly modified in our patients, 5β-reductase has been less well studied in metabolic disorders. Activation of 5β-reductase has been correlated with fat accumulation in the liver (37). In polycystic ovary syndrome, activation of this enzyme is observed in patients harboring a marked androgen excess (38). Its expression is markedly suppressed in diabetic patients as a consequence of an activation of peroxisome proliferator-activated receptor α (39). Recent data derived from hepatoma cell lines suggested that inactivation of 5β-reductase led to activation of lipogenic and carbohydrate genes (40), whereas mice harboring homozygous inactivation of the gene had increased insulin sensitivity and males were leaner (41). These limited data suggest modulation of 5β-reductase activity could also contribute to modification of the metabolic profile of patients.
Several enzymes involved in cortisol metabolism follow a circadian pattern of expression. 11β-HSD1 expression in human visceral adipose tissue has been shown to be higher during the night (42). Fractioned urinary sampling may help to better understand the association between the circadian cortisol exposure and metabolic enzyme activity. However, in a study comparing conventional HC therapy with continuous subcutaneous administration given to mimic the normal circadian rhythm, increased UFF and UFE were observed with continuous subcutaneous administration in line with a better bioavailability of parenteral HC and a higher cortisol exposure. Surprisingly, 11β-HSD1 activity remained similar across both therapies, whereas decreased 11β-HSD2 and 5α-reductase activities was observed with continuous subcutaneous administration (18). These results contrast with those observed in our study. This suggests that mimicking a circadian pattern of cortisol exposure is not sufficient to restore normal activity of 11β-HSD1 and other enzymes. The route of administration and release of GCs may also play an important role in the modification in cortisol metabolism. DR-HC absorption is expected to occur along the small intestine and proximal colon with a longer intestinal retention time (19, 43). The fact that treatment with continuous subcutaneous administration (18) or DR-HC led to a different urinary cortisol metabolite profile compared to conventional HC suggests that differences in first-pass metabolism in the liver due to a different route of administration may contribute to modification of metabolic enzyme activities.
In our study, we could not show a correlation between the cortisol metabolome profile and change in body weight, body mass index, or blood pressure. However, this does not preclude the possibility that some of the changes in cortisol metabolism such as changes in 11β-HSD1 enzyme activity might contribute to the beneficial changes in the metabolic outcome induced by DR-HC treatment. This study cannot exclude differences in tissue-specific regulation of cortisol metabolism, since the urinary ratio evaluates only global 11β-HSD1 activity. For instance, in obese patients, 11β-HSD1 expression in adipose tissue has been associated positively with body mass index, whereas its expression in the liver was negatively correlated with body mass index (34).
A limitation of our study is that enzymatic activity has been evaluated only using the ratio of urinary cortisol and cortisone metabolites. Although urinary metabolites have been widely used in other studies, they do not take into account the complexity of the multiplicities of the metabolic pathway and do not allow the evaluation of organ-specific enzyme activities. In particular, 11β-HSD1 activity is expressed in many tissues and, of relevance here, is known to be differentially regulated in the liver and adipose tissue (34); here the (THF + 5α-THF)/THE ratio is a reflection of overall “global” 11β-HSD1 activity.
To conclude, patients with adrenal insufficiency treated with conventional TID-HC therapy demonstrated severe alteration of cortisol metabolism, in particular increased 11β-HSD1 and reduced 11β-HSD2 activity that may contribute to the adverse metabolic profile previously seen in patients with adrenal insufficiency. Enzyme activities changed toward control values when patients were treated with DR-HC. The mechanistic link between these changes and the beneficial metabolic effects observed with DR-HC are unclear as the magnitude of change obtained, in particular in 11β-HSD1 activity, was small although statistically significant. Our results suggest the urinary cortisol metabolome may serve as a tool to assess optimal cortisol replacement therapy.
Abbreviations
- 5α-THF
5α-tetrahydrocortisol
- 6β-OH-F
6β-hydroxy-cortisol
- 11β-HSD1
11β-hydroxysteroid dehydrogenase type 1
- 20β-HSD
20β-hydroxysteroid dehydrogenase
- AUC
area under the concentration-time curve
- AUC0-10h
AUC from baseline to 10 hours
- AUC10-24h
AUC from 10 to 24 hours
- BMI
body mass index
- CYP-3A
cytochrome P450A
- DR-HC
dual-release hydrocortisone
- E
cortisone
- F
cortisone
- GC
glucocorticoid
- HC
hydrocortisone
- TCM
total cortisol metabolite
- THE
tetrahydrocortisone
- THF
tetrahydrocortisol
- TID-HC
3-times-daily hydrocortisone
- UFE
urinary free cortisone
- UFF
urinary free cortisol.
Acknowledgments
The authors dedicate this paper to our late colleague and friend Anna Nilsson, a devoted clinical investigator and clinician. We thank the physicians and nurses of the departments where the patients were investigated. We also thank the patients who consented to participate in this study. We are grateful to Per Ekman and Mattias Molin at Statistiska Konsultgruppen for their statistical support.
Financial Support: This work was supported by the Swedish Research Council (Project 2015–02561), the Swedish federal government under the LUA/ALF agreement (ALFGBG-719531), and an investigator-initiated research grant from Shire International GmbH (SWE_000991). S.E. was supported for this work by a FRM (Fondation pour la Recherche Médicale) postdoctoral grant.
Clinical Trial Information: Clinical trial registration No. NCT00915343 (registered June 5, 2009).
Additional Information
Disclosure Summary: G.J. has served as a consultant for Shire and Astra Zeneca. M.S. declares research funding from Shire Ltd. The other authors have nothing to disclose in relation to this work. All authors have submitted the International Committee of Medical Journal Editors form for disclosure of potential conflicts of interest. Conflicts that the editors consider relevant to the content of the manuscript have been disclosed.
Data Availability
Restrictions apply to the availability of some data analyzed during this study to preserve patient confidentiality or because they were used under license. The corresponding author will on request detail the restrictions and any conditions under which access to some data may be provided.
Refere nces
