


Abstract
Patients with type 2 diabetes mellitus (T2DM) have an increased risk of low-trauma fractures. However, the effect of antidiabetic medication in relation to glycemic control on the risk of fracture is poorly understood.
This work aimed to evaluate the association between the level of glycemic control, use of antidiabetic medication, and risk of low-trauma fractures in patients with newly diagnosed T2DM.
We conducted a nested case-control analysis among individuals registered in the Clinical Practice Research Datalink. The base population consisted of patients with newly diagnosed T2DM from 1995 to 2017. Cases were patients with a low-trauma fracture after T2DM diagnosis. We matched 4 controls to each case. Exposures of interest were glycemic control (last glycated hemoglobin [HbA1c] level before fracture) and type of diabetes treatment. We conducted conditional logistic regression analyses adjusted for several confounders.
We identified 8809 cases and 35 219 controls. Patients with current metformin use and HbA1c levels of less than 7.0% and between 7.0-8.0% had a reduced risk of fractures (adjusted odds ratio 0.89; 95% CI, 0.83-0.96 and 0.81; 95% CI, 0.73-0.90, respectively) compared with untreated patients. However, in patients receiving metformin plus 1 or 2 other antidiabetic drugs, or insulin (alone or in addition to other antidiabetic medication), the level of glycemic control was not associated with the risk of fracture compared with untreated patients.
While patients with good or medium glycemic control receiving current metformin monotherapy had a lower risk of fracture compared with untreated patients, glycemic control in patients receiving treatment other than metformin was not associated with risk of fracture.
Diabetes mellitus (DM) is a chronic condition with a high global prevalence, affecting some 450 million (8.8%) patients worldwide and causing approximately 5 million deaths per year (1). In the United Kingdom, 4.7 million patients (7.0%) were living with diagnosed or undiagnosed DM in 2019 (2). DM type 1 (T1DM) and type 2 (T2DM) are characterized by hyperglycemia due to insulin deficiency and insulin resistance, respectively, and both have been linked to an increased risk of fragility fractures compared with nondiabetic individuals (3-8). T2DM is more prevalent and accounts for 90% of all diabetes patients (2). The risk of hip fracture has been reported to be elevated around 2- to 3-fold in T2DM patients (9, 10). Therefore, the impact of T2DM and related fractures on public health is significant (2).
While the association between T2DM and an elevated risk of fracture has been consistently shown in several studies (5, 7, 9, 11, 12), the impact of glycemic control on the risk of fracture in T2DM patients is less clear. Suggested mechanisms in patients with T2DM and elevated glycated hemoglobin (HbA1c) levels include altered body composition, accumulation of advanced glycation end products in bones, impaired bone healing, and lower bioavailability of insulin-like growth factor 1 (13). In the Rotterdam study, T2DM patients with HbA1c levels of 7.5% or greater had an increased risk of fracture compared with nondiabetic patients (47%-62% higher risk of fracture). The authors stated “This association did not seem to be influenced by potential confounders or arising from diabetes complications (extraskeletal risk factors), such as risk of falling at baseline or decline in renal function, nor by the use of systemic corticosteroids or diuretics.” (14) In contrast, authors of a study from Singapore including 932 fracture cases observed that T2DM patients with HbA1c levels of less than 6% and from 6.1% to 7.0% had an increased risk of fracture compared with those with HbA1c levels above 8% (odds ratio [OR] 3.01; 95% CI, 2.01-4.51 and OR 2.34; 95% CI, 1.71-3.22, respectively). Cases and matched controls included similar proportions of insulin and sulfonylurea (SU) users. Controls were more likely to be metformin and/or acarbose users (15). A study from the United States including more than 10 000 geriatric patients with T1DM and T2DM yielded no significant difference in the risk of fracture in patients with HbA1c levels of less than 6.5% (hazard ratio [HR] 0.89; 95% CI, 0.75-1.06); 6.5% to 6.9% (HR 0.92; 95% CI, 0.76-1.12); 8% to 8.9% (HR 1.35; 95% CI, 1.09-1.66); and 9% or greater (HR 1.21; 95% CI, 0.97-1.52) compared with patients with HbA1c levels of 7% to 7.9% (13). In a Taiwanese cohort study of 20 025 patients with T2DM, however, the risk of fracture was increased in patients with HbA1c levels of 9% to 10% (HR 1.24; 95% CI, 1.02-1.49) and 10.0% or greater (HR 1.32; 95% CI, 1.09-1.58) compared with patients with HbA1c levels of 6% to 7% (16). A study from Rome including 92 postmenopausal women (19 T2DM patients and 73 nondiabetic controls) affected by osteoarthritis who were scheduled for elective hip replacement surgery, suggests that pathways of bone formation in T2DM may be impaired despite good glycemic control (17). Previously, our group reported a positive association between the level of glycemic control and the risk of fracture in T1DM patients, but not in T2DM patients (18).
Although different study designs may, to a certain extent, explain the discordant findings, another possible explanation for these discrepant findings could be differences in antidiabetic medications taken by T2DM patients. This aspect has not been extensively considered in previous studies. Furthermore, the medication regimen can also serve as an indicator of the patient’s disease severity, which may affect the risk of fracture and the level of glycemic control (measured as HbA1c levels). Therefore, an analysis by medication type could provide insights into the impact of glycemic control on the risk of fracture in T2DM patients. To our knowledge none of the previous studies analyzed the level of glycemic control according to different antidiabetic medication regimens and its joint impact on the risk of fracture.
The objective of this study was therefore to analyze the association between glycemic control and the risk of fracture in patients with T2DM, taking the diabetes medication into account.
Materials and Methods
Study design and data source
We used the UK-based primary care Clinical Practice Research Datalink (CPRD) GOLD to conduct a nested case-control analysis within a cohort of patients with newly diagnosed T2DM. The study period started January 1, 1995 and ended December 31, 2017.
CPRD GOLD is a governmental, nonprofit database containing anonymized medical records of more than 11.3 million patients from more than 600 general practices in the United Kingdom. CPRD GOLD patients represent approximately 6.9% of the UK population. The database is a collaborative project between the National Institute for Health Research and the Medicines and Healthcare Regulatory Agency (MHRA) established in 1987. Participating general practitioners are trained in recording medical information using standard software and coding systems. The recorded information includes medical diagnoses, referrals to specialists and secondary care settings, prescriptions, diagnostic testing, lifestyle information (such as body mass index [BMI] and smoking), and demographic data (19). Patients of the CPRD are representative of the UK general population with respect to age, sex, and ethnicity (20). Additionally, the raw data entered by the general practitioners undergoes quality control checks by the MHRA before release (21, 22). This contributes to the proven validity and high quality of the data (19, 23, 24). The validity for the diagnoses of T2DM and fractures has been shown previously (21, 22, 25, 26).
The study protocol was approved by the Independent Scientific Advisory Committee for MHRA database research (protocol number 17_061RAR), and the protocol was made available to the journal reviewers.
Study population
We selected patients of any age with newly diagnosed T2DM between January 1, 1995 and December 31, 2017. To ensure that we included only newly diagnosed cases, patients were required to have a minimum of 3 years of history in the database prior to the first recorded diabetes diagnosis code. We identified patients based on specific codes for T2DM. We defined the first recorded T2DM code as the study entry date.
From the study population we excluded patients who experienced one or more fractures after age 18 years and before the study entry date (27). We further excluded patients with a diagnosis of cancer (except nonmelanoma skin cancer), alcoholism, or HIV at any time in the patient record because such patients usually have many comorbidities and medications, which could lead to substantial bias and confounding. See Fig. 1 for details on numbers of individuals excluded for each of the criteria mentioned previously.
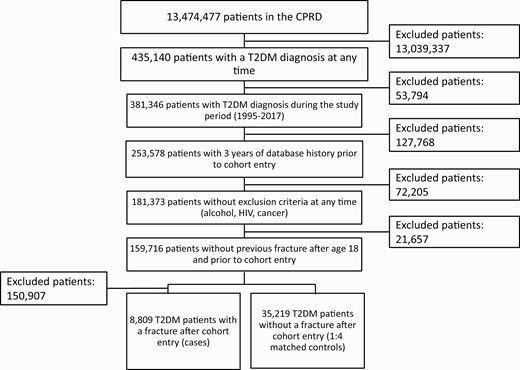
Selection of the study population.
Case definition
A specialized clinician (J.V.) looked at the READ codes for fractures in the database and divided them into “low-trauma fracture” and “high-trauma fracture” based on the site of the fracture or evidence included in the codes (eg, the READ code “Open fracture vault of skull with intracranial injury” was assigned to the category of high-trauma fractures).
We defined cases as patients with a READ code for low-trauma fracture (nonvertebral fractures of the proximal and distal upper and lower extremities, ribs and thorax, hip and foot) after study entry date. We excluded patients with indication of high-trauma fractures such as fractures of the shoulder blade, cranium, or clavicle, as well as open fractures or fractures of multiple bones. Since diabetes is known to be associated with an increased risk of peripheral fragility fractures at skeletal sites, we excluded patients with recorded vertebral fractures (9, 10). A study from the United States also confirms that the risk of vertebral fractures is not affected by T2DM in elderly men when compared to diabetes-free individuals (28).
The date of the fracture diagnosis will subsequently be called the index date. A diagram illustrating the timeline of our study can be found in Fig. 2. We used risk set sampling to identify controls from our cohort of T2DM patients who did not experience a fracture between T2DM onset and the index date of their matched case. We matched 4 controls to each case on age (±3 years), sex, general practice, index date (same index date as the case and the control had to be present in the database on the index date), and T2DM duration (±365 days, assessed by counting the days between the first recorded T2DM code and the index date).
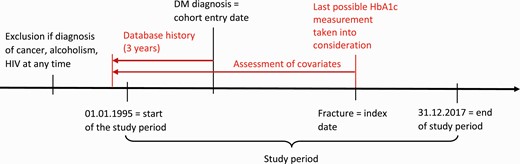
Graphical representation of the timeline of the study.
Exposure definition
The exposure of interest in this study was glycemic control in patients combined with information on type of antidiabetic medication (metformin, glitazones, SUs, dipeptidyl peptidase-4 inhibitors [DPP4-I], SGLT2 inhibitors [SGLT2-I], glucagon-like peptide-1 agonists [GLP-1–As], and glinides). We further assessed the association of different T2DM treatment regimens and fracture according to the timing of the prescription (past or current drug use related to the fracture date, see definition as follows) and the number of prescriptions received.
We used the last available HbA1c level before the index date as a categorical variable to define glycemic control. We assigned patients with missing HbA1c values to a separate category.
To assess the risk of fracture associated with the use of antidiabetic drugs and drug combinations reflecting the real-world setting, we defined exposure according to the antidiabetic medication schemes recommended by the National Institute for Health and Care Excellence (NICE) guidelines during the study period 1995 to 2017 (29). The guidelines mainly describe 4 types of diabetes treatment:
- -
Behavioral and dietary recommendations (no drug treatment)
- -
Initial drug treatment with metformin as monotherapy (unless metformin is contraindicated or not tolerated)
- -
First intensification of drug treatment (metformin + either DPP4-Is, glitazones, or SUs)
- -
Second intensification of drug treatment with either 3 noninsulin blood glucose–lowering therapies (triple therapy with metformin + any 2 out of DPP4-Is, glitazones, or SUs), or any treatment regimen containing insulin.
We also calculated the median T2DM duration for cases and controls as well as the mean of the last HbA1c measurements by antidiabetic medication regimen.
We used 2 different classifications of HbA1c categories including different HbA1c levels to assess the impact of HbA1c levels and of T2DM treatment on the risk of fracture:
- -
For comparisons between users of the same medication regimen, we defined 4 HbA1c categories plus 1 category for missing measurements. We chose HbA1c levels from greater than 6.5% to 7.5% as the reference group.
- -
For comparisons considering the timing and duration of drug intake, we defined only 3 HbA1c categories plus 1 category for missing measurements to have enough power for each comparison. In these analyses, which compared all medication schemes described by the NICE guidelines (29), we chose “nonuse of antidiabetic drugs” as reference.
We classified the HbA1c levels differently for the 2 comparisons defined earlier (ie, HbA1c levels ≤ 6.5%, > 6.5%-7.5%, > 7.5%-8.5%, and > 8.5% in Table 3 and HbA1c levels ≤ 7.0%, > 7.0%-8.0%, and > 8.0% in Table 4).
Type 2 diabetes mellitus duration (mean) prior to index date by medication regimen (29)
| T2DM duration | T2DM patients with fractures | T2DM patients without fractures | ||
|---|---|---|---|---|
| n (%) | Median T2DM duration, d (Q1-Q3) | n (%) | Median T2DM duration, d (Q1-Q3) | |
| No antidiabetic drugs | 2324 (26.4) | 1029 (401-2015) | 9462 (26.9) | 1034 (426-2043) |
| Metformin | 2000 (22.7) | 1386 (665-2530) | 8986 (25.5) | 1439 (673-2517) |
| First intensification | 1721 (19.5) | 2241 (1257-3415) | 6852 (19.5) | 2266 (1275-3459) |
| Second intensification | 1718 (19.5) | 3035 (1830-4270) | 5968 (16.9) | 3191 (1950-4359) |
| Other combinations | 1046 (11.9) | 2143 (973-3576) | 3951 (11.2) | 2174 (1063-3551) |
| Sum | 8809 | 35 219 |
Abbreviation: T2DM, type 2 diabetes mellitus.
Association of use of metformin (ever use) per glycated hemoglobin level and risk of fracture
| Treatment | Last HbA1c value before fracture, % | T2DM patients with fractures, n (%) | T2DM patients without fractures, n (%) | Unadjusted, OR (95% CI) | Adjusteda, OR (95% CI) |
|---|---|---|---|---|---|
| Nonexposed | No antidiabetic drug | 2324 (26.4) | 9462 (26.9) | 1.17 (1.08-1.26) | 1.14 (1.05-1.24) |
| Metformin | ≤ 6.5 | 752 (8.5) | 3217 (9.1) | 1.11 (1.00-1.22) | 1.07 (0.97-1.18) |
| > 6.5-7.5 | 819 (9.3) | 3882 (11.0) | 1 (Reference) | 1 (Reference) | |
| > 7.5-8.5 | 201 (2.3) | 1021 (2.9) | 0.94 (0.80-1.09) | 0.96 (0.82-1.12) | |
| > 8.5 | 167 (1.9) | 683 (1.9) | 1.16 (0.98-1.37) | 1.16 (0.98-1.37) | |
| No recorded HbA1c level | 61 (0.7) | 183 (0.5) | 1.61 (1.23-2.12) | 1.65 (1.25-2.17) | |
| Other exposure | Other antidiabetic drugs | 4485 (50.9) | 16 771 (47.6) | 1.31 (1.21-1.41) | 1.27 (1.18-1.37) |
Abbreviations: HbA1c, glycated hemoglobin; OR, odds ratio; T2DM, type 2 diabetes mellitus.
aAdjusted for body mass index, smoking, previous fractures (after age 18 years), previous falls, and use of bisphosphonates.
Statistical analysis
We used conditional logistic regression to assess the association between HbA1c values according to diabetes medication and the risk of low-trauma fractures, expressed as ORs or adjusted ORs (aORs) with 95% CI. We assessed a variety of comorbidities and comedications (recorded at any time in the patient record before the index date) for confounding based on previous clinical knowledge. As a result, we adjusted our analyses for the following potential confounders: BMI (last available value before the index date as categorical variable) (18, 30, 31), smoking status (last available information before the index date) (32-35), recorded diagnosis of previous fractures after age 18 years and prior to the diabetes diagnosis (36-38), recorded diagnosis of previous falls (as a marker of frailty) (39-41), and recorded prescription for bisphosphonates (ever-use) (42-44). Independently of the chosen adjustments, the unadjusted and adjusted ORs remained similar throughout our analyses.
For users of antidiabetic drugs and drug combinations, we assessed the risk of fractures separately for patients with different last mean HbA1c levels in the following exposure groups:
- •
Current and past users: patients with a prescription for the respective drug recorded 60 days or less prior to the index date and more than 60 days, respectively.
- •
Duration of drug exposure: 1 to 9, 10 to 19, and 20 or more prescriptions (ie, the number of prescriptions of the last prescribed drug or drug combination).
Thus, we looked at all drugs prescribed before the index date, including those that people had switched to or from. For current and past use we evaluated the prescriptions within the respective timeframes. We defined 60 days as the cutoff for past and current use based on the most commonly prescribed pack sizes for diabetes medication (30 days) plus a grace period of another month.
We conducted all analyses using SAS software version 9.4 (SAS Institute, Inc).
Results
We identified 8809 T2DM patients with a low-trauma fracture from a cohort of 159 716 patients with newly diagnosed T2DM who fulfilled all study inclusion criteria. We matched them to 35 219 control patients (see Fig. 1). The fractures in the cases of our population were located on the following sites:
- -
Humerus and elbow (ntot = 1968, nfemale = 1460, nmale = 508)
- -
Femur/patella (ntot = 1748, nfemale = 1219, nmale = 529)
- -
General and unspecified fractures (ntot = 1473, nfemale = 1036, nmale = 437)
- -
Distal lower extremities (ntot = 1265, nfemale = 813, nmale = 452)
- -
Distal upper extremities including wrist (ntot = 916, nfemale = 714, nmale = 202)
- -
Foot and ankle fracture (ntot = 553, nfemale = 378, nmale = 175)
- -
Ribs and thorax (ntot = 427, nfemale = 187, nmale = 240)
- -
Hip fracture (ntot = 419, nfemale = 326, nmale = 93)
- -
Other (ntot = 40, nfemale = 26, nmale = 14)
The mean age of patients was 71.1 years (SD 13.4 years) at the index date, and approximately 70% were female. Table 1 provides the distributions and ORs for basic characteristics of cases and their matched controls at the index date including patient demographics, comorbidities, and basic information on exposure to antidiabetic medication.
Characteristics of fracture cases and their matched controls at index date and univariate and adjusted odds ratios for risk of fracture
| Patient characteristics | T2DM patients with fractures, n (%) | T2DM patients without fractures, n (%) | Unadjusted, OR (95% CI) | Adjusteda, OR (95% CI) |
|---|---|---|---|---|
| Study population | 8122 | 32 470 | NA | NA |
| Age at fracture, y | ||||
| < 60 | 1771 (20.1) | 7046 (20.0) | NA | NA |
| 60-69 | 1803 (20.5) | 7302 (20.7) | NA | NA |
| 70-79 | 2537 (28.8) | 10 131 (28.8) | NA | NA |
| 80-89 | 2231 (25.3) | 8906 (25.3) | NA | NA |
| 90+ | 467 (5.3) | 1834 (5.2) | NA | NA |
| Sex | ||||
| Male | 2650 (30.1) | 10 597 (30.1) | NA | NA |
| Female | 6159 (69.9) | 24 622 (69.9) | NA | NA |
| BMI, kg/m2 | ||||
| < 18.5 | 154 (1.8) | 276 (0.8) | 1.98 (1.67-2.36) | 1.90 (1.60-2.26) |
| 18.5 to < 25.0 | 1798 (20.4) | 6276 (17.8) | 1 (Reference) | 1 (Reference) |
| 25.0 to < 30.0 | 2874 (32.6) | 11 515 (32.7) | 0.86 (0.81-0.91) | 0.87 (0.82-0.92) |
| 30.0 to < 35.0 | 2118 (24.0) | 9073 (25.8) | 0.79 (0.74-0.85) | 0.79 (0.74-0.85) |
| 35.0 to < 40.0 | 1024 (11.6) | 4362 (12.4) | 0.79 (0.73-0.85) | 0.79 (0.73-0.86) |
| ≥ 40.0 | 645 (7.3) | 2911 (8.3) | 0.73 (0.67-0.80) | 0.73 (0.66-0.80) |
| Unknown | 196 (2.2) | 806 (2.3) | 0.84 (0.72-0.98) | 0.89 (0.76-1.05) |
| Last HbA1c measurement, % | ||||
| ≤ 6.5 | 3131 (35.5) | 11 993 (34.1) | 1.10 (1.05-1.16) | 1.07 (1.02-1.13) |
| > 6.5 to > 7.5 | 2929 (33.3) | 12 338 (35.0) | 1 (Reference) | 1 (Reference) |
| > 7.5 to > 8.5 | 1141 (13.0) | 4692 (13.3) | 1.02 (0.96-1.10) | 1.03 (0.96-1.11) |
| > 8.5 | 1206 (13.7) | 4744 (13.5) | 1.07 (1.00-1.15) | 1.06 (0.99-1.14) |
| No recorded HbA1c level | 402 (4.6) | 1452 (4.1) | 1.22 (1.08-1.37) | 1.26 (1.11-1.43) |
| Comorbidities (reference: no diagnosis) | ||||
| Hypertension | 5824 (66.1) | 23 759 (67.5) | 0.94 (0.89-0.98) | 0.98 (0.94-1.03) |
| Hyperlipidemia | 2418 (27.5) | 9710 (27.6) | 0.99 (0.95-1.04) | 0.98 (0.94-1.03) |
| Congestive heart failure | 748 (8.5) | 2443 (6.9) | 1.26 (1.17-1.36) | 1.23 (1.13-1.33) |
| Chronic renal failure | 597 (6.8) | 2080 (5.9) | 1.17 (1.08-1.28) | 1.17 (1.08-1.28) |
| Ischemic heart disease | 1875 (21.3) | 7201 (20.5) | 1.06 (1.00-1.11) | 1.03 (0.97-1.08) |
| Osteoporosis | 531 (6.0) | 1441 (4.1) | 1.53 (1.40-1.68) | 1.11 (0.99-1.24) |
| Previous falls | 2379 (27.0) | 6155 (17.5) | 1.85 (1.76-1.95) | 1.83 (1.74-1.92) |
| Previous fractures (after age 18 y) | 150 (1.7) | 422 (1.2) | 1.44 (1.22-1.71) | 1.44 (1.22-1.70) |
| Comedication (reference: never use) | ||||
| Bisphosphonates | 910 (10.3) | 2406 (6.8) | 1.61 (1.50-1.73) | 1.50 (1.39-1.61) |
| Systemic glucocorticoids | 2620 (29.7) | 8755 (24.9) | 1.29 (1.23-1.35) | 1.18 (1.12-1.24) |
| Hormone replacement therapy | 1753 (19.9) | 6743 (19.2) | 1.07 (1.00-1.13) | 1.01 (0.95-1.07) |
| Antidiabetic medication (reference: nonuse) | ||||
| Metformin | 5692 (64.6) | 22 925 (65.1) | 0.98 (0.93-1.02) | 1.00 (0.95-1.05) |
| First escalation of treatment | 1721 (19.5) | 6852 (19.5) | 0.97 (0.90-1.04) | 0.98 (0.91-1.05) |
| Second escalation of treatment | 1718 (19.5) | 5968 (16.9) | 1.11 (1.03-1.21) | 1.12 (1.03-1.21) |
| Glitazones | 1282 (14.6) | 4349 (12.4) | 1.26 (1.18-1.34) | 1.29 (1.21-1.38) |
| DPP4-Is | 602 (6.8) | 2562 (7.3) | 0.92 (0.85-1.01) | 0.94 (0.86-1.03) |
| GLP-1 | 189 (2.2) | 715 (2.0) | 1.07 (0.91-1.25) | 1.10 (0.94-1.29) |
| SGLT2 | 69 (0.8) | 291 (0.8) | 0.94 (0.74-1.21) | 0.94 (0.73-1.21) |
| Glinides | 128 (1.5) | 510 (1.5) | 1.00 (0.84-1.20) | 0.98 (0.82-1.17) |
| Sulfonylureas | 3727 (42.3) | 14 173 (40.2) | 1.11 (1.06-1.16) | 1.09 (1.04-1.14) |
Abbreviations: BMI, body mass index; DPP4-Is, dipeptidyl peptidase-4 inhibitors; GLP-1, glucagon-like peptide-1; HbA1c, glycated hemoglobin; NA, not applicable; OR, odds ratio; SGLT2, sodium glucose cotransporter 2; T2DM, type 2 diabetes mellitus.
aAdjusted for BMI, smoking, previous fractures (after age 18 years), previous falls, and use of bisphosphonates.
Mean last HbA1c level before the index date was 7.2% (SD 3.6%) both for cases and controls. Median last HbA1c level was slightly lower, with 6.8% (Q1 = 6.3%, Q3 = 7.7%) for cases and 6.9% (Q1 = 6.3, Q3 = 7.7%) for controls. Median time between T2DM diagnosis and first fracture was 4.9 years (Q1 = 2.2, Q3 = 8.7 years). The last HbA1c measurement took place 119 days (Q1 = 56 days, Q3 = 214 days) before the index date for cases and 114 days (Q1 = 53 days, Q3 = 207 days) for controls. During the study period, patients with T2DM had a mean of 12.2 and 12.1 recorded HbA1c measurements before the index date for cases and controls, respectively. Only 5.7% of the T2DM cases and 5.2% of the controls had no recorded HbA1c measurements during the study period.
Independently of their HbA1c levels, patients exposed to glitazones (aOR 1.29; 95% CI, 1.21-1.38) or to a combination of metformin and glitazones (aOR 1.34; 95% CI, 1.19-1.51) had a slight increased risk of fracture compared with never-users of those specific drugs. No other antidiabetic drugs in our analysis were materially associated with the risk of fracture, or too few data were available to provide meaningful results, especially for newer drugs (such as GLP-1–A and SGLT2-I).
Table 2 shows mean values of the last HbA1c levels recorded before the index date by medication regimen according to the NICE guidelines, and Table 3 shows the median T2DM duration in days.
Last glycated hemoglobin levels (mean) prior to index date by medication scheme (29)
| Antidiabetic treatment | T2DM patients with fractures | T2DM patients without fractures | ||
|---|---|---|---|---|
| n (%) | HbA1c values, % (SD) | n (%) | HbA1c values, % (SD) | |
| No antidiabetic drugs | 2090 (24.9) | 6.4 (2.9) | 8578 (25.4) | 6.5 (3.0) |
| Metformin | 1939 (23.1) | 7.0 (3.3) | 8803 (26.1) | 7.0 (3.3) |
| First intensification | 1691 (20.1) | 7.4 (3.5) | 6744 (20.0) | 7.5 (3.5) |
| Second intensification | 1693 (20.1) | 8.1 (4.0) | 5914 (17.5) | 8.1 (3.9) |
| Other combinations | 994 (11.8) | 7.5 (3.6) | 3728 (11.0) | 7.6 (3.5) |
| Sum | 8407a | 33 767a |
Abbreviations: HbA1c, glycated hemoglobin; T2DM, type 2 diabetes mellitus.
aApproximately 5% of the patients did not have an HbA1c measurement recorded during the study period.
Mean last HbA1c levels for patients with T2DM and use of oral antidiabetic drugs varied widely: Patients without T2DM medication had the lowest last HbA1c levels, whereas HbA1c levels increased as patients progressed from the first choice of treatment (metformin) to succeeding intensification of treatment. This correlated with the T2DM duration, meaning that patients with less T2DM medication had a shorter T2DM duration and vice versa.
Tables 4 to 6 show the risk of fracture associated with different last HbA1c values by exposure to different antidiabetic medication (according to the NICE guidelines [29]) in ever- vs never-users. ORs are adjusted for BMI, smoking, previous fractures (after age 18 years), previous falls, and use of bisphosphonates.
Compared with metformin users with HbA1c levels between 6.5% to 7.5%, only those with no recorded HbA1c levels or those receiving antidiabetic medication other than metformin had a 30% or more increased risk of fracture (see Table 4). All others were consistent with the null (see Table 4).
In the analysis of patients with first intensification of treatment (see Table 5), only patients with intensive glycemic control (≤ 6.5%) had a 30% increased risk of fracture (aOR 1.28; 95% CI, 1.13-1.44) compared with those with HbA1c levels between 6.5% to 7.5%. Similar to our results for patients with a prescription for a first intensification treatment, patients receiving second intensification of treatment (see Table 6) and HbA1c levels of 6.5% or less also had an increased risk of fracture compared with patients with HbA1c levels between 6.5% to 7.5%: aOR 1.33 (95% CI, 1.14-1.53). In those patients with a second intensification of treatment, the group with no HbA1c levels also had an increased risk of fracture compared with those with HbA1c levels between 6.5% to 7.5%; OR 1.75 (95% CI, 1.15-2.68). Patients with HbA1c levels between 7.5% to 8.5% and greater than 8.5%, who obtained first or second intensification treatment, did not show an increased risk of fracture compared to patients with HbA1c levels between 6.5% to 7.5% receiving first or second intensification treatment, respectively.
Association of use of first intensification of treatment (ever-use) per glycated hemoglobin level and risk of fracture
| Treatment | Last HbA1c value before fracture, % | T2DM patients with fractures, n (%) | T2DM patients without fractures, n (%) | Unadjusted, OR (95% CI) | Adjusteda, OR (95% CI) |
|---|---|---|---|---|---|
| Nonexposed | No antidiabetic drug | 2324 (26.4) | 9462 (26.9) | 1.05 (0.96-1.15) | 1.04 (0.95-1.14) |
| First intensificationb | ≤ 6.5 | 469 (5.3) | 1562 (4.4) | 1.29 (1.14-1.45) | 1.28 (1.13-1.44) |
| > 6.5-7.5 | 639 (7.3) | 2736 (7.8) | 1 (Reference) | 1 (Reference) | |
| > 7.5-8.5 | 316 (3.6) | 1309 (3.7) | 1.04 (0.90-1.18) | 1.03 (0.90-1.19) | |
| > 8.5 | 267 (3.0) | 1137 (3.2) | 1.00 (0.87-1.16) | 1.01 (0.87-1.17) | |
| No recorded HbA1c level | 30 (0.3) | 108 (0.3) | 1.18 (0.81-1.73) | 1.15 (0.79-1.67) | |
| Other exposure | Other antidiabetic drugs | 4764 (54.1) | 18 905 (53.7) | 1.08 (0.99-1.17) | 1.07 (0.98-1.16) |
Abbreviations: HbA1c, glycated hemoglobin; OR, odds ratio; T2DM, type 2 diabetes mellitus.
aAdjusted for body mass index, smoking, previous fractures (after age 18 years), previous falls, and use of bisphosphonates.
bFirst intensification of drug treatment is defined by use of metformin plus either dipeptidyl peptidase-4 inhibitors, glitazones, or sulfonylureas (according to the National Institute for Health and Care Excellence).
There were no material differences in risk for patients receiving antidiabetic treatments other than those specified in the NICE guidelines, when comparing patients with HbA1c levels between 6.5% to 7.5% to patients with other HbA1c levels and those without any antidiabetic treatment (data not shown).
Tables 7 to 9 show the results of the analyses restricted to current use of the respective treatment at the index date. We also analyzed past use of the respective drugs with respect to the risk of fracture, but the analyses yielded no material differences in effect (data not shown).
Current use of metformin and risk of fracture by glycated hemoglobin levels
| Medication regimen | T2DM patients with fractures, n (%) | T2DM patients without fractures, n (%) | Unadjusted, OR (95% CI) | Adjusteda, OR (95% CI) | |
|---|---|---|---|---|---|
| No antidiabetic drug use | 2324 (26.4) | 9462 (26.9) | 1 (Reference) | 1 (Reference) | |
| Current use of metformin | HbA1c ≤ 7.0% | 980 (11.1) | 4481 (12.7) | 0.89 (0.82-0.96) | 0.89 (0.83-0.96) |
| HbA1c > 7.0%-≤ 8.0% | 387 (4.4) | 2014 (5.7) | 0.78 (0.70-0.87) | 0.81 (0.73-0.90) | |
| HbA1c > 8.0% | 184 (2.1) | 821 (2.3) | 0.91 (0.79-1.06) | 0.95 (0.81-1.10) | |
| No HbA1c value | 52 (0.6) | 142 (0.4) | 1.52 (1.14-2.02) | 1.60 (1.19-2.15) | |
| All other antidiabetic drug use | 4485 (50.9) | 16 771 (47.6) | 1.12 (1.06-1.19) | 1.11 (1.05-1.18) |
Abbreviations: HbA1c, glycated hemoglobin; OR, odds ratio; T2DM, type 2 diabetes mellitus.
aAdjusted for body mass index, smoking, previous fractures (after age 18 years), previous falls, use of bisphosphonates, and stratified by last HbA1c, and antidiabetic medication.
Current users (last prescription ≤ 60 days prior to the index date) of metformin (who never received other antidiabetic medication) with HbA1c levels of 7.0% or less had a decreased risk of fractures compared with nonusers of any antidiabetic medication (see Table 7, aOR 0.89; 95% CI, 0.83-0.96). The reduction in risk was marginally stronger for patients with HbA1c levels of 7.0% to 8.0% (aOR 0.81; 95% CI, 0.73-0.90). However, patients currently exposed to metformin with HbA1c levels greater than 8.0% had a risk of fracture similar to patients not using any antidiabetic drugs (aOR 0.95; 95% CI, 0.81-1.10).
In patients with current use of first intensification of treatment (see Table 8) and HbA1c levels between 7.0% to 8.0%, there is a suggestion of a decreased risk of fracture compared with nonuse of antidiabetic drugs (aOR 0.90; 95% CI, 0.80-1.01). There was no increased risk of fracture in those with HbA1c levels of 7.0% or less compared with nonuse of antidiabetic drugs.
Current use of first intensification of treatment and risk of fracture by glycated hemoglobin levels
| Medication regimen | T2DM patients with fractures, n (%) | T2DM patients without fractures, n (%) | Unadjusted, OR (95% CI) | Adjusteda, OR (95% CI) | |
|---|---|---|---|---|---|
| No antidiabetic drug use | 2324 (26.4) | 9462 (26.9) | 1 (Reference) | 1 (Reference) | |
| Current use of first intensification treatment | HbA1c ≤ 7.0% | 540 (6.1) | 2044 (5.8) | 1.08 (0.98-1.19) | 1.10 (1.00-1.21) |
| HbA1c > 7.0%-≤ 8.0% | 369 (4.2) | 1692 (4.8) | 0.89 (0.80-1.00) | 0.90 (0.80-1.01) | |
| HbA1c > 8.0% | 291 (3.3) | 1274 (3.6) | 0.93 (0.83-1.06) | 0.96 (0.84-1.08) | |
| No HbA1c value | 22 (0.3) | 760.2) | 1.18 (0.77-1.81) | 1.18 (0.77-1.80) | |
| All other antidiabetic drug use | 4764 (54.1) | 18 905 (53.7) | 1.03 (0.98-1.09) | 1.03 (0.98-1.09) |
Abbreviations: HbA1c, glycated hemoglobin; OR, odds ratio; T2DM, type 2 diabetes mellitus.
aAdjusted for body mass index, smoking, previous fractures (after age 18 years), previous falls, use of bisphosphonates, and stratified by last HbA1c, and antidiabetic medication.
Patients receiving current second intensification of treatment had an elevated risk of fracture in every HbA1c category compared with untreated patients (see Table 9).
Current use of second intensification of treatment and risk of fracture by glycated hemoglobin levels
| Medication regimen | T2DM patients with fractures, n (%) | T2DM patients without fractures, n (%) | Unadjusted, OR (95% CI) | Adjusteda, OR (95% CI) | |
|---|---|---|---|---|---|
| No antidiabetic drug use | 2324 (26.4) | 9462 (26.9) | 1 (Reference) | 1 (Reference) | |
| Current use of second intensification treatment | HbA1c ≤ 7.0% | 379 (4.3) | 1208 (3.4) | 1.32 (1.18-1.48) | 1.32 (1.18-1.49) |
| HbA1c > 7.0%-≤ 8.0% | 403 (4.6) | 1389 (3.9) | 1.23 (1.10-1.37) | 1.26 (1.13-1.41) | |
| HbA1c > 8.0% | 566 (6.4) | 2092 (5.9) | 1.14 (1.04-1.26) | 1.13 (1.02-1.25) | |
| No HbA1c value | 19 (0.2) | 36 (0.1) | 2.19 (1.36-3.51) | 2.26 (1.39-3.66) | |
| All other antidiabetic drug use | 4767 (54.1) | 19 789 (56.2) | 0.99 (0.94-1.05) | 1.00 (0.95-1.05) |
Abbreviations: HbA1c, glycated hemoglobin; OR, odds ratio; T2DM, type 2 diabetes mellitus.
aAdjusted for body mass index, smoking, previous fractures (after age 18 years), previous falls, use of bisphosphonates, and stratified by last HbA1c, and antidiabetic medication.
When the number of prescriptions as well as the timing of the last prescription of metformin were taken into account, the beneficial effect of HbA1c levels between 7.0% to 8.0% and greater than 8%, compared with patients not receiving any antidiabetic medication, was present only in current users of metformin with 10 to 19 and 20 or more prescriptions (HbA1c > 7.0%-8.0% aOR 0.82; 95% CI, 0.70-0.95 and HbA1c > 8.0% aOR 0.77; 95% CI, 0.61-0.98 for 10 to 19 prescriptions; HbA1c > 7.0%-8.0% aOR 0.92; 95% CI, 0.84-1.01 and HbA1c > 8.0% aOR 0.80; 95% CI, 0.69-0.92 for 20 or more prescriptions).
Discussion
The results of our large study based on primary care data from the United Kingdom suggest a beneficial effect of HbA1c levels less than 8.0% in current users of metformin monotherapy on the risk of fracture compared with nonuse of any antidiabetic medication (HbA1c levels ≤ 7.0: aOR 0.89; 95% CI, 0.83-0.96; HbA1c > 7.0%-8.0%: aOR 0.81; 95% CI, 0.73-0.90). Only those current metformin users without HbA1c measurements had a higher fracture risk than T2DM patients not receiving any antidiabetics.
Past use of metformin was not associated with a changed risk of fracture in any HbA1c category compared with nonuse of antidiabetic drugs. This could be an indication that metformin as a substance has a beneficial effect on bone. Metformin is considered the first-line therapeutic agent for the treatment of T2DM (29). Preclinical studies indicate that metformin has an anabolic effect on bone and stimulates the differentiation and mineralization of osteoblasts (45-47). Furthermore, results from some epidemiological studies suggest that metformin use, irrespective of glycemic control, is associated with a lower incidence of fractures in patients with T2DM (47-50). However, other studies have not confirmed this protective effect (51-53). In our study, a significant protective effect of metformin was restricted to current use in combination with HbA1c levels of less than 8.0%. Thus, it seems that patients with current metformin therapy and good glycemic control benefit the most with regards to their risk of fracture. Although, on average, nonusers of any antidiabetic medication had the shortest disease duration, nonusers still had a minimally increased risk of fracture (aOR 1.14; 95% CI, 1.05-1.24) compared with metformin users with HbA1c levels between 6.5% to 7.5%. Metformin was usually the initial treatment received in this population and, consequently, metformin users had longer mean disease duration than nonusers of any antidiabetic medication and a shorter mean diabetes duration compared with patients receiving first or second intensification of treatment. Because we matched fracture cases and controls on their T2DM disease duration, we eliminated the effect of duration on the risk estimate. This adds evidence to the hypothesis that there is a beneficial effect of metformin on the risk of fracture, as long as the blood glucose levels are between 6.5% to 7.5% or between 7.5% to 8.5%.
Patients with prescriptions for any antidiabetic treatment regimen but no recorded HbA1c measurement frequently had the highest risk of fractures compared with patients with HbA1c levels between 6.5% to 7.5% receiving the same treatment. This could be a proxy for lack of patient-doctor interaction and thus less-controlled disease. In our analysis including timing of exposure in patients without any HbA1c measurements, we observed an increased risk of fracture in patients receiving any current treatment. This effect was most pronounced in patients receiving current second intensification of treatment.
Second intensification of treatment was defined as prescriptions for 3 drugs (metformin + 2 of DPP4I, SU, or glitazone), or for insulin alone or in addition to other medication. HbA1c levels of 6.5% or less in patients receiving second intensification of treatment at any time (ever-users) were associated with an increased risk of fracture compared with ever-users of second intensification of treatment with HbA1c levels between 6.5% to 7.5% (see Table 6). A possible explanation for this finding may be that patients with HbA1c levels of 6.5% or less are at higher risk of hypoglycemia (54), which could in turn elevate the risk of fractures due to falls (15, 55, 56).
Association of use of second intensification of treatment (ever use) per glycated hemoglobin level and risk of fracture
| Treatment | Last HbA1c value before fracture, % | T2DM patients with fractures, n (%) | T2DM patients without fractures, n (%) | Unadjusted, OR (95% CI) | Adjusteda, OR (95% CI) |
|---|---|---|---|---|---|
| Nonexposed | No antidiabetic drug | 2324 (26.4) | 9462 (26.9) | 0.88 (0.80-0.98) | 0.88 (0.79-0.97) |
| Second intensificationb | ≤6.5 | 311 (3.5) | 842 (2.4) | 1.37 (1.18-1.58) | 1.33 (1.14-1.53) |
| > 6.5-7.5 | 468 (5.3) | 1742 (5.0) | 1 (Reference) | 1 (Reference) | |
| > 7.5-8.5 | 371 (4.2) | 1335 (3.8) | 1.03 (0.90-1.18) | 1.04 (0.90-1.19) | |
| > 8.5 | 543 (6.2) | 1995 (5.7) | 1.02 (0.90-1.15) | 0.98 (0.87-1.12) | |
| No recorded HbA1c level | 25 (0.3) | 54 (0.2) | 1.69 (1.11-2.57) | 1.75 (1.15-2.68) | |
| Other exposure | Other antidiabetic drugs | 4767 (54.1) | 19 789 (56.2) | 0.88 (0.80-0.97) | 0.88 (0.79-0.97) |
Abbreviations: HbA1c, glycated hemoglobin; OR, odds ratio; T2DM, type 2 diabetes mellitus.
aAdjusted for body mass index, smoking, previous fractures (after age 18 years), previous falls, and use of bisphosphonates.
bSecond intensification of drug treatment is defined by the use of either 3 noninsulin blood glucose–lowering therapies (triple therapy with metformin + any 2 out of DPP4-I, glitazones, or sulfonylureas or any treatment regimen containing insulin (according to the National Institute for Health and Care Excellence).
In patients with current second intensification of treatment, all categories of glycemic control were associated with an increased risk of fracture compared with patients receiving no antidiabetic treatment (see Table 9). It is possible that second intensification of treatment represents a more severe disease stage often including diabetic microvascular complications (55, 57), particularly diabetic neuropathy and cardiovascular comorbidities, which potentially increase the risk of falls (58) and thus the risk of fractures.
Use of antidiabetic drugs or treatments other than those recommended by NICE either did not have a material effect on the risk of fracture in our analysis, or too few data were available to provide conclusive results. This was particularly true for newer drugs, such as GLP-1–receptor agonists and SGLT2-Is, which were used less in the United Kingdom during our study period from 1995 to 2017 compared with metformin, glitazones, or SUs (see Table 1), and that were included in the 2015 NICE guidelines only under certain circumstances.
Furthermore, for some antidiabetic drug combinations, there were too few patients exposed per HbA1c group to calculate meaningful ORs.
The present findings should be interpreted within the context of the study strengths and limitations. The strengths of our study were the large observational, nested, case-control design within a cohort of patients with newly diagnosed T2DM. Our data come from a well-validated primary care database that contains prospectively and routinely collected data, which avoids recall bias. DM diagnoses are well validated within the CPRD with a positive predictive value of 98.6% (92.2%-100.0%) (25). For the analyses in this study we used only the last HbA1c measurement before the index date. However, on average 12 HbA1c measurements per patients were recorded in the database during the study period. The median time between the index date and the last HbA1c measurement was 119 days for cases and 114 for controls. This shows that the recorded HbA1c measurements provide a reliable source for our analyses on the effect of glycemic control on the risk of fracture.
Our study population included a high proportion of patients with T2DM with good glycemic control who might have been healthier than the T2DM populations analyzed in other studies. Nevertheless, our T2DM population included more than 32 000 patients with medically treated T2DM, including many with HbA1c levels greater than 8.0%. Therefore, we expect our results to be applicable to those of other populations with T2DM and HbA1c levels greater than 8.0%. Our study population includes more women than men, even though men are slightly more often affected by T2DM than women (1). This may be because women are at a higher risk for fractures than men (59).
Though fractures are well recorded and have been validated in the CPRD (positive predictive value ~90% for hip and vertebral fractures) (60), it is possible that we missed some unrecorded fracture cases. This possible misclassification would likely be nondifferential and would not have materially changed the results. Additionally, we did not analyze the cause of the fracture. Thus, we do not know whether some fractures were caused by diabetic emergencies, such as hypoglycemia or hyperglycemia. This level of detailed information is not well captured in the CPRD. Furthermore, T2DM is a disease with uncertain onset and can remain undiagnosed for many years, possibly leading to the inclusion of some prevalent (instead of newly diagnosed) T2DM cases. This was previously shown in the UK Prospective Diabetes study, in which a high prevalence of T2DM tissue damage was shown by the time of T2DM diagnosis as an indication of preexisting T2DM (61). Therefore, we may have underestimated the time until fracture (after T2DM onset) in our study population, which could have potentially affected our matching on T2DM duration. However, this misclassification is unlikely to have been differential, and we do not expect that it had a major influence on our findings.
In conclusion, our study suggests that patients with HbA1c levels of less than 8.0% who were currently exposed to metformin monotherapy had a lower risk of fracture compared with patients not currently exposed to an antidiabetic drug. Our data confirm that metformin is safe in terms of skeletal changes and predominantly exerts its beneficial effect on the risk of fracture in an early and well-controlled disease stage. In contrast, the risk of fracture in patients receiving intensified treatment was not or only slightly associated with glycemic control. Those receiving intensified T2DM treatment are at a slightly increased risk of fracture independent of glycemic control. This could be due to a more severe disease stage with microvascular complications increasing the risk of falls.
Abbreviations
- aOR
adjusted Odds Ration
- BMI
body mass index
- CPRD
Clinical Practice Research Datalink
- DM
diabetes mellitus
- DPP4-I
dipeptidyl peptidase-4 inhibitor
- GLP-1–A
glucagon-like peptide-1 agonist
- HbA1c
glycated hemoglobin
- HR
hazard ratio
- MHRA
Medicines and Healthcare Regulatory Agency
- OR
odds ratio
- SGLT2-I
SGLT2 inhibitor
- SU
sulfonylurea
- T1DM
type 1 diabetes mellitus
- T2DM
type 2 diabetes mellitus
Acknowledgments
We thank Pascal Egger (Basel Pharmacoepidemiology Unit, University of Basel, Switzerland) for his technical support and programing.
Financial Support: This work was supported by the Swiss National Science Foundation (Grant No. 320030_169407).
Additional Information
Disclosure Summary: The authors have nothing to disclose.
Data Availability
Restrictions apply to some or all the availability of data generated or analyzed during this study to preserve patient confidentiality or because they were used under license. The corresponding author will on request detail the restrictions and any conditions under which access to some data may be provided.
References
