


Abstract
Type 1 diabetes (T1D) is associated with an increased risk of cognitive decline, where severe hypoglycemia (SH) and impaired awareness of hypoglycemia (IAH) may play a role. While there is evidence of a possible association between IAH and brain damage, the potential brain changes remain poorly characterized by magnetic resonance imaging (MRI).
To investigate whether there are structural brain differences in a group of T1D patients with IAH compared with normal awareness of hypoglycemia (NAH).
General practice, population-based, cross-sectional study (July 2018 to July 2019).
Endocrinology Department, Hospital Santa Creu i Sant Pau.
A total of 40 T1D patients (20 each with IAH and NAH) matched for age, sex, T1D duration, and education level.
Using different neuroimaging techniques, we compared whole-brain gray matter (GM) and white matter (WM) differences. We used voxel-based morphometry and cortical surface area analysis methods to assess GM differences, and fractional anisotropy (FA) to assess WM differences.
Compared with patients with T1D-NAH, patients with T1D-IAH had reduced GM volumes and cortical surface areas, especially in frontal and parietal regions (P < 0.05 corrected), and also showed reduced FA values in major WM tracts. The observed MRI differences correlated with both SH frequency and IAH severity.
MRI for patients with T1D show that IAH is associated with brain changes involving both GM and WM. Further research is needed to elucidate whether the observed differences are a consequence of increased SH episode frequency and increased IAH severity.
Poor glycemic control in type 1 diabetes (T1D), which has been associated with chronic micro- and macrovascular complications, contributes to the morbidity and mortality observed in this group of patients (1). While strict glycemic control could reduce this risk, it is associated with an increased risk of severe hypoglycemia (SH) (1), an event characterized by altered mental and/or physical functioning that leads to loss of consciousness, seizure, coma requiring assistance for recovery, and even death (2). SH affects approximately to 30% to 50% of patients with T1D (3), may have severe physical/psychological consequences for the patient and their family, and represents an economic burden for the healthcare system (4). A previous SH episode has been reported to be associated with a 3.4-fold increase in mortality (5).
Apart from the above-mentioned consequences of poor glycemic control, patients with diabetes mellitus are at a higher risk of cognitive deterioration and dementia than people without this disease (6, 7). Clinical and experimental studies have demonstrated that angiopathy, neuroinflammation, necrotic brain damage, and apoptotic neuronal death (8) are commonly associated with brain injury in diabetes. The underlying pathogenic mechanisms are believed to be multifactorial, and include sustained hyperglycemia, (9) micro/macroangiopathic damage, and hypoglycemia (10, 11).
Researchers have been studying the role of hypoglycemia in brain damage for over 45 years. SH has been reported to be associated with cortical atrophy, especially in the parietal, temporal, and occipital lobes (12), but also in the hippocampus, insula, putamen, and caudate nucleus (13). Additionally, patients with SH have been shown to have reduced gray matter (GM) volumes in the thalamus and pallidum (14), while experimental studies in animals have shown that recurrent SH causes oxidative stress and neuronal death in the brain, especially in the hippocampus (8).
While the role played by hypoglycemia in the development of cognitive impairment in T1D is still under discussion, it is generally accepted that recurrent episodes of SH may play a fundamental role (15). While the 18-year prospective Diabetes Control and Complications Trial/Epidemiology of Diabetes Interventions and Complications (DCCT/EDIC) study (16) could not demonstrate a relationship between SH episodes and cognitive decline, other cross-sectional studies have reported that SH may be related to poorer cognitive performance (17-19).
Because SH has devastating consequences for patients with T1D, identifying the most-affected patients is crucial. The main risk factors for SH are age >65 years, longer disease duration (20), and patients with impaired awareness of hypoglycemia (IAH). IAH, defined as an inability to recognize symptoms when blood glycemic levels are below 70 mg/dL, is caused by defective glucose counter-regulation (a reduced epinephrine response in the absence of a glucagon response) and hypoglycemia unawareness (a reduced sympatho-adrenal response and the resulting development of neurogenic symptoms) (21).
The main IAH treatment is to restore normoglycemia and avoid new hypoglycemia episodes using glucose-monitoring sensors, insulin pumps, and educational programs. Nevertheless, despite the development of new diabetes technologies in recent years, up to 30% of patients with T1D present with IAH (22), while a considerable number of those patients appear to be resistant to IAH treatment (23).
Even though IAH seems to be the main predisposing factor (up to 6-fold) for SH (22), few studies have addressed IAH influence on brain structure and function using magnetic resonance imaging (MRI) or positron emission tomography (PET). Using functional MRI to assess response to acute hypoglycemia in patients with T1D, Mangia et al (24) and Wiegers et al (25) reported that, compared with patients with normal awareness of hypoglycemia (NAH) and controls, patients with IAH exhibited different cerebral blood flow and blood-oxygen-level-dependent response patterns in the thalamus, while Hwang et al (26) reported similar findings for the cortico-striatal and fronto-parietal circuits. Findings of regional differences in brain activation between IAH and NAH were corroborated by PET studies of patients with T1D by Dunn et al (27), who proposed that neuroimaging differences observed in specific brain regions might explain differences in behavioral responses to acute hypoglycemia.
Regarding MRI, previous work has focused mainly on the structural brain differences between T1D patients and nondiabetic controls. Musen et al (28) was the first to assess brain structure using voxel-based morphometry (VBM), showing that T1D patients present lower GM density on areas involved in language processing and memory. More recently, Filip et al (29) published the results of an extensive structural brain characterization, concluding that patients with T1D show micro- and macro-structural differences on the right parahippocampal gyrus, puthamina, thalami, and cerebellum that correlate with reduced GM volumes but not with cerebral blood differences.
On the other hand, structural brain differences in patients with T1D and IAH have only been reported in a single previous MRI study, in which Bednarik et al (30) found that patients with T1D and IAH had smaller GM volumes in the entire cortex, but especially in the frontal, parietal, and temporal lobes. As for white matter (WM) differences, as far as we are aware, no previous study has explored that issue. Our aim, therefore, was to explore differences in brain volumes as evidenced by MRI in a carefully and extensively biologically characterized population of T1D patients with IAH compared with patients with NAH. We used VBM and cortical surface area analysis to assess differences in GM volumes, and fractional anisotropy (FA) for WM volumes.
Materials and Methods
Study population
Patients were recruited from the T1D outpatient clinic at the Endocrinology Department in Hospital de la Santa Creu i Sant Pau (Barcelona) between July 2018 and July 2019. The study was approved by the hospital ethics committee, and all participating subjects were informed and signed their consent.
Inclusion criteria
Participants were adults aged 18 to 70 years of age, diagnosed with T1D at least 5 years previously.
Exclusion criteria
Patients were excluded if they had a previous clinical diagnosis of cognitive impairment, use of drugs affecting the central nervous system, and/or MRI contraindications or intolerance.
The Clarke hypoglycemia awareness questionnaire (31) was used to assess IAH, as the only suitable instrument validated in the Spanish language. This questionnaire has 8 items that evaluate patient exposure to previous moderate or severe hypoglycemic events (32). IAH severity was scored from 0 to 8 according to the Clarke scale: IAH was scored as ≥4 and NAH was scored as <3, while a score of 3 was considered indeterminate and resulted in the corresponding patients being excluded from the study. To evaluate the impact of hypoglycemia on quality of life we assessed fear of hypoglycemia using the validated Spanish version of the FH-15 scale (33).
Patients were assigned to the IAH or NAH groups, which were matched for sex, age, education level, and T1D duration.
Sociodemographic and clinical data
Sociodemographic and medical data were obtained from electronic medical records. Self-reported previous SH episodes in the last year and the last 5 years were also recorded. An SH episode was considered to be any hypoglycemic event involving loss of consciousness, confusion/disorientation, seizure, or coma that had required third-person assistance for recovery.
Weight, height, blood pressure, insulin type and dosage, and ongoing medication were recorded in a face-to-face visit, while the Mini-Mental State Exam (MMSE) was used to assess global cognition. Blood was sampled to measure glycated hemoglobin (HbA1c), lipid profile, and glomerular filtration rate, while urine was sampled to determine the albumin-to-creatinine ratio. Hypertension and dyslipidemia were recorded if subjects were receiving anti-hypertensive or lipid-lowering medication, or if blood pressure or lipid levels were above normal levels.
To evaluate whether a difference in cardiovascular risk between the 2 groups could have an impact on the brain, we determined that risk at 5 and 10 years using the Steno Type 1 Risk Engine (34), which calculates risk based on age, sex, diabetes duration, systolic blood pressure, estimated glomerular filtration rate, albuminuria, low-density lipoprotein–cholesterol, HbA1c, and smoking, and exercise habits. Risk, categorized according to National Institute for Health and Care Excellence guidelines, is considered low at <10%, medium at 10% to 20%, and high at ≥20%.
MRI acquisition and pre-processing and statistical analyses
MRI studies were performed in all patients using a 3-Tesla Philips MRI scanner and a dedicated protocol. Studies included axial T1 3D-MPRAGE images and the following parameters: TR/TE 13/7.4 ms, flip angle 8º, field of view 23 cm, in-plane resolution 256 × 256, slice thickness 1 mm. Diffusion tensor imaging (DTI) images were also acquired, according to the following parameters: TR/TE 10 250/55 ms, flip angle 90º, acquisition matrix 144 × 144, b-value 800, slice thickness 1.75 mm, 15 directions.
Two neuroradiologists (B.G-A. and J.M.) reviewed all the MRI studies for their overall quality. Brain differences between the T1D-IAH and T1D-NAH groups were investigated using 5 neuroimaging methods.
To assess GM differences between groups, 2 processing pipelines were applied using T1 images. Voxel-based morphometry of standard GM volume (VBM-GMV) pre-processing was performed using Statistical Parametrical Mapping 12, (http://www.fil.ion.ucl.ac.uk/spm) (35). Briefly, a segmentation step was first applied to obtain GM tissue probability maps that were subsequently normalized to the Montreal Neurological Institute space applying the DARTEL algorithm. To reduce interindividual variability, the resulting images were smoothed using an isotropic spatial filter measuring 8 × 8 × 8 mm full-width at half-maximum (FWHM).
In the cerebral cortex, GM volume is defined as the product of 2 components (cortical thickness and surface area) that have been found not to necessarily track one another; it is therefore of interest to study whether changes in cortical GM volumes are driven by reductions in cortical thickness, by changes in surface area, or by both (36).
We also studied cortical thickness and surface area differences by a surface-based pre-processing approach using FreeSurfer 6.0 (https://surfer.nmr.mgh.harvard.edu/) (37). In short, optimized surface deformation models following intensity gradients accurately identified WM and cortical GM boundaries, from which cortical thickness and surface area values were computed for each vertex of the resulting surface. Finally, spatially normalized vertexwise cortical thickness and surface area values were smoothed using a Gaussian kernel of 10-mm FWHM.
To study WM differences between groups, we used 2 different neuroimaging processing techniques. FA information was obtained from DTI-MRI as a measure of WM integrity, as lower FA values suggest disrupted water molecule flows compatible with damage. On the one hand, whole-brain voxelwise FA differences between groups were studied using the FSL toolbox (https://fsl.fmrib.ox.ac.uk/fsl/). Eddy-current corrected individual DTI images were then co-registered to the individual’s T1 images, FA maps were computed using FSL’s tensor fitting tool, and the maps were subsequently normalized to the Montreal Neurological Institute space using the T1 transformation parameters to enhance accuracy. Lastly applied was voxelwise Gaussian smoothing with 6-mm FWHM.
On the other hand, native-space automated probabilistic segmentation was performed, using the TRACULA software (38), of the following WM tracts: corticospinal tract, inferior longitudinal fasciculus, uncinate fasciculus, forceps major, forceps minor, anterior thalamic radiation (ATR), cingulum-cingulate gyri endings, cingulum-angular bundle (CAB), and superior longitudinal fasciculus (to both parietal and temporal endings). Differences in average FA values along these tracts were then compared across groups.
Voxelwise and vertexwise statistical analyses were performed using a general linear model to compare the 2 groups, using age, sex, and education level as covariates of no interest. Total intracranial volume was also included as a nuisance covariate for the GM analyses. For VBM-GMV analyses, only voxels with an a -priori GM probability >0.2 were included in the statistical analyses. Similarly, for the voxelwise FA analyses, only voxels with an a priori WM probability >0.2 were considered. For voxelwise analyses, only clusters showing P < 0.005 and surviving set-level correction for whole-brain search space were considered significant. For surface-based vertexwise analyses, only clusters surviving P < 0.05 and multiple comparison correction using a Monte-Carlo simulation with 10 000 repeats were considered significant.
Finally, in order to investigate whether the observed GM/WM alterations revealed in the T1D-IAH group further correlated with clinical severity, we performed the following exploratory analysis. Within the T1D-IAH group, we computed GM/WM values in the subset of regions where a significant compromise compared with T1D-NAH patients were observed. We then correlated these imaging measures with IAH severity, measured both in terms of the number of hypoglycemic episodes in the previous 5 years and using Clarke scores. For these exploratory analyses, a P < 0.05 was considered significant.
Results
A total of 40 patients with T1D were enrolled, 20 each with IAH and NAH. Patient characteristics are summarized in Table 1. Both groups were comparable in terms of sociodemographic, glycemic control, and cognitive status. Statistically significant differences were found between the groups in the number of previous SH episodes (more frequent for the IAH group in both the last year and the last 5 years). Most of the remaining variables were comparable between both groups, except for a higher proportion of smokers in the NAH group. No further statistically significant differences were found in relation to the remaining cardiovascular risk factors, while estimated 5- and 10-year risks were very similar for both groups. Basal insulin requirements were higher in the T1D-NAH group. All patients in the entire sample of 40 patients were right-handed and all were adhering to an intensive insulin regimen consisting of multiple daily injections with either short-/long-acting insulin analogues or continuous subcutaneous insulin infusion. Regarding the MRI results, both GM and WM were different in the IAH group compared with the NAH group. As shown in Fig. 1, the IAH group had reduced VBM-GMVs in the left dorsolateral prefrontal cortex (PFC), right putamen, right insula, right praecuneus/posterior cingulate cortex, bilateral calcarine sulcus, left cuneus, left supplementary motor area/Brodmann area 6, and right middle temporal gyrus. This group also had comparatively reduced cortical surface areas in the occipital cortex, cingulate cortex, middle temporal cortex, and superior/middle/dorsolateral PFC. There were no significant between-group differences in cortical thickness, and there were no regions showing increased GM or surface area in the IAH group compared with NAH.
Characteristics of Patients With Type 1 Diabetes and With Impaired Awareness of Hypoglycemia (IAH) or Normal Awareness of Hypoglycemia (NAH)
| IAH | NAH | P | |
|---|---|---|---|
| Sex, % female | 60% | 35% | 0.10 |
| Age, years | 54.85 ± 13.11 | 58.1 ± 9.44 | 0.37 |
| T1D duration, years | 31.90 ± 12.44 | 30.30 ± 8.14 | 0.63 |
| Education, years | 14.25 ± 5.52 | 14.85 ± 4.99 | 0.72 |
| MDI/CSII, n | 55/45 | 75/25 | 0.32 |
| Insulin dose, UI/kg/day | 0.22 ± 0.05 | 0.31 ± 0.12 | 0.01* |
| Prandial insulin dose, UI/kg/day | 0.23 ± 0.10 | 0.32 ± 0.20 | 0.09 |
| Hypertension, % | 35% | 65% | 0.06 |
| Dyslipidemia, % | 60% | 65% | 0.06 |
| BMI, kg/m2 | 26.15 ± 6.3 | 26.95 ± 3.6 | 0.62 |
| Smokers, % | 40% | 85% | 0.01* |
| Alcohol users, % | 15% | 35% | 0.207 |
| Retinopathy, % | 35% | 40% | 0.52 |
| Nephropathy, % | 5% | 10% | 0.22 |
| Coronary heart disease, % | 0% | 5% | 0.96 |
| Distal arteriopathy, % | 5% | 5% | 1.0 |
| Cerebrovascular disease, % | 5% | 0% | 0.34 |
| Cardiovascular risk at 5 years | 14.61 ± 15.18 | 14.44 ± 8.07 | 0.96 |
| Cardiovascular risk at 10 years | 24.90 ± 22.10 | 26.11 ± 12.79 | 0.82 |
| Mean HbA1c in previous 5 years, % | 7.40 ± 0.84 | 7.59 ± 0.58 | 0.41 |
| Clarke score | 4.75 ± 0.96 | 1.1 ± 0.78 | <0.01* |
| SH episodes in previous year, mean | 0.8 ± 1.3 | 0.05 ± 0.2 | 0.02* |
| SH episodes in previous 5 years, mean | 2.65 ± 4.4 | 0.25 ± 0.4 | 0.01* |
| MMSE score | 29.60 ± 0.6 | 29.45 ± 1.0 | 0.59 |
| Fear of hypoglycemia, score | 28.70 ± 6.8 | 23.80 ± 8.42 | 0.05* |
| LDL cholesterol, mg/dL | 99.20 ± 29.16 | 95.21 ± 20.18 | 0.62 |
Values are expressed as means ± standard deviation or percentages. Two-group ANOVA/χ 2 or t-test for T1D groups.
Abbreviations: BMI, body mass index; CSII, continuous subcutaneous insulin infusion; LDL, low-density lipoprotein; MDI, multiple daily injection; MMSE, Mini-Mental State Exam; SH, severe hypoglycemia.
*P < 0.05.
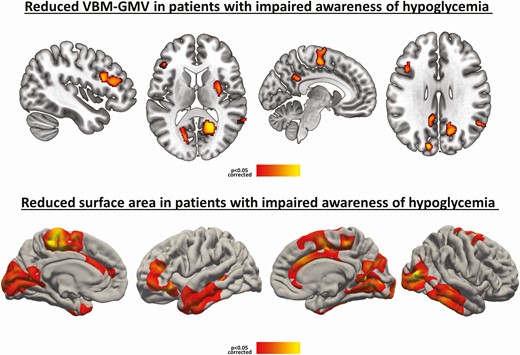
Patients with T1D and IAH compared with patients with T1D and NAH, controlling for age, sex, and education (P < 0.05 corrected). VBM-GMV reductions (above) and surface area reductions (below). Reductions are indicated by a red-to-yellow color scale. Abbreviations: GMV, gray matter volume; IAH, impaired awareness of hypoglycemia; NAH, normal awareness of hypoglycemia; T1D, type 1 diabetes; VBM, voxel-based morphometry.
Fig. 2 depicts WM differences between the groups. The IAH had lower regional FA in the following regions: left corticospinal tract, anterior and superior corona radiata, and inferior and superior longitudinal fasciculi. Native-space automated segmentation of the major WM tracts also revealed lower average FA values in the IAH group in the following tracts: forceps minor (β = −0.38, P = 0.02), right ATR (β = −0.39, P = 0.01), and left CAB (β = −0.31, P = 0.05). No brain regions in the IAH group showed increased FA values relative to the NAH group. When applying a P < 0.001 threshold in the voxel-based GM/WM analyses, most clusters remained significant although reduced in size. Further including smoking condition as a covariate did not significantly alter the set of presented neuroimaging results.
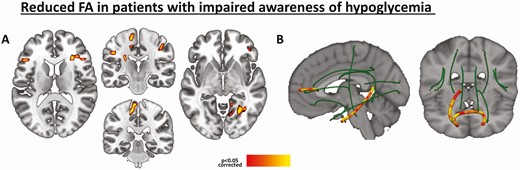
Reduction in WM integrity in patients with T1D and IAH compared to patients with T1D and NAH, controlling for age, sex, and education (P < 0.05 corrected). Voxelwise FA reductions (A), and within-tract FA reductions (B).
Lastly, within the T1D-IAH group, several exploratory associations were found between IAH severity and GM/WM integrity in those brain regions where alterations were revealed compared to the NAH group. Correlating with SH frequency were surface area in the right occipital cluster (r = −0.49, P = 0.029) and, similarly, surface area in the left paracentral and left inferior frontal clusters (r = −0.52 [P = 0.018] and r = −0.54 [P = 0.013], respectively). VBM-GMV in the right praecuneus, insula, and middle temporal clusters also showed significant associations with SH frequency (r = −0.47 [P = 0.035], r = −0.69 [P = 0.001] and r = −0.51 [P = 0.021], respectively). Average FA values in the right ATR also correlated with SH frequency (r = −0.62 [P = 0.004] and r = −0.49 [P = 0.029], respectively). The following correlations were also observed with Clarke scores: surface area in the right praecuneus (P = −0.53, P = 0.016) and average FA values in the right ATR (P = −0.47, P = 0.035).
Discussion
Our research demonstrates brain MRI differences between patients with similar sociodemographic and clinical features when differentiated in T1D-IAH versus T1D-NAH groups. These differences involve GM volumes, cortical surface areas, and tract integrity (FA values), across various brain regions. Notably, these findings were not associated with significant differences in global cognitive function, as assessed using the MMSE. The present findings in terms of structural brain differences in absence of evident clinical symptoms may reflect the occurrence of early subtle brain damage in this population, but not enough severe as to incur associated clinical features. In this sense, further longitudinal studies with allow us to explore the eventual progression of these brain changes and related symptoms.
We found lower GMVs in patients with T1D-IAH with respect to those with T1D-NAH. The VBM analyses showed a GMV reduction in key areas related to cognitive functioning, such as the left dorsolateral PFC, the insula, and motor regions. This finding of GM volume reductions in the IAH group is thus consistent with findings reported by Bednarik et al (30).
The dorsolateral PFC, which participates in executive functions, has strong connections with the thalamus, which is involved, in turn, in relaying sensory signals and in modulating states of consciousness, alertness, and awareness (39). The dorsolateral PFC is also connected to the hippocampus, whose activity, in conjunction with motor regions, is reduced during hypoglycemia (40). For its part, the insular cortex has been suggested to play a role in various homeostatic functions (including control of the autonomic function through regulation of the sympathetic and parasympathetic systems) and in socio-emotional processing leading to high-level attention and decision making (41).
Interestingly, our study demonstrates widespread reductions in surface area, but not in cortical thickness, in patients with T1D-IAH. Especially evident was that the surface area of the occipital cortex was clearly smaller in the T1D-IAH group. Occipital damage has been associated with hypoglycemia, with some authors attributing this damage to the comparatively higher use of glucose in this region as a result of intensive axonal growth (42). Our findings suggest, however, that this damage could be a consequence of IAH, rather than a predisposing factor.
We also observed WM differences in patients with T1D-IAH relative to those with T1D-NAH. FA values were lower in the anterior corona radiata, whose integrity has been related to cognitive performance (43), while a reduced FA for a cortical portion of the corticospinal tract was also evident for the same group. It has been proposed that this WM tract, which is connected to the somatosensory cortex, plays a role in modulating sensory information from the body (44). By segmenting a set of major WM tracts and comparing their average FA values for the 2 groups, we found lower FA values in the forceps minor, right ATR, and left CAB for the T1D-IAH group. The integrity of the forceps minor, which connects the homologous regions of the anterior frontal lobes between the 2 hemispheres, has been related to executive function performance (45). The ATR, which is a WM fiber bundle that connects the dorsomedial thalamic nucleus to the dorsolateral PFC, is also implicated in executive functions and in complex behavioral planning (46). As for the CAB, which is the lower segment along the ventral aspect of the hippocampus, its FA and integrity have also been related to cognitive processes (47).
It is important to underline that the 2 T1D groups, with IAH and with NAH, did not differ in terms of sex, age, disease duration, metabolic control, cardiovascular risk factors, or macro/microvascular complications that might account for the MRI brain differences. What we did find were statistically significant differences in the frequency of SH episodes in the previous year and also in the previous 5 years, recorded to be considerably more prevalent in the T1D-IAH group. This observation is related to the fact that IAH is the main risk factor for SH.
Finally, an exploratory analysis revealed that some of the brain differences observed in our patients with T1D-IAH correlated with their SH frequency, and, in some brain areas (eg, the precuneus and right ATR), also with IAH severity (as measured by the Clarke score). Although exploratory, these findings show a potential link between observed brain differences and a clinical severity, reinforcing a possible role of imaging biomarkers in this clinical setting. In this regard, it is important to note that the differences in brain MRI scans between patients with T1D-IAH and with T1D-NAH may be the direct consequence of the neuroglycopenic effect resulting from previous SH episodes.
Taken together, and using a multimodal neuroimaging approach, we observed a set of brain differences in patients with IAH. However, whether these differences are a cause or a consequence of IAH cannot be properly addressed in a cross-sectional study like ours. Another unknown is whether these differences reflect brain damage or adaptative processes. Nonetheless, the observed differences may play a role in cognitive impairment, in view of the increased prevalence of mild impairment in patients with IAH (48, 49). In this study, MMSE was used as a measure of global cognitive performance. Although the MMSE is a widely used screening method, it is obvious that lacks on sensitivity and specificity to capture frontal-executive and visuoperceptive deficits (50). Thus, it may explain the lack of association between the structural brain findings and global cognition, an aspect that merits further in deep research using comprehensive neuropsychological assessment of all the cognitive domains.
This study is novel in terms of demonstrating differences in both GM and WM in the brains of patients with T1D depending on their hypoglycemia awareness. Our results corroborate previous research showing that the brains of patients with T1D-IAH and with T1D-NAH are structurally different. Some limitations include its cross-sectional design, the relatively small sample size, and the absence of a nondiabetic control group. Given these limitations, our neuroimaging results should be confirmed in larger samples and applying more stringent statistical criteria. Additionally, future studies should include the analysis of other variables that could be associated with the observed brain differences such as glycemic variability.
To conclude, MRI revealed that patients with T1D-IAH and patients with T1D-NAH have structurally different brains; the observed differences correlated with SH frequency and, in the case of some brain areas, with IAH severity. These findings reinforce the importance of IAH as a condition that needs to be detected and prevented. It also tentatively suggests that imaging biomarkers could track the pathological processes underlying this clinical entity, although further investigation in this field is needed.
Abbreviations
- ATR
anterior thalamic radiation
- CAB
cingulum-angular bundle
- FA
fractional anisotropy
- FWHM
full-width at half-maximum
- GM
grey matter
- HbA1c
glycated hemoglobin A1c
- IAH
impaired awareness of hypoglycemia
- MMSE
Mini-Mental State Exam
- MRI
magnetic resonance imaging
- NAH
normal awareness of hypoglycemia
- PET
positron emission tomography
- PFC
prefrontal cortex
- SH
severe hypoglycemia
- T1D
type 1 diabetes
- VBM
voxel-based morphometry
- VBM-GMV
voxel-based morphometry of standard grey matter volume
- WM
white matter
Acknowledgments
The authors acknowledge the editorial assistance of Ailish MJ Maher, IMRAD Translating and Editing.
Financial Support: This study was supported by a grant from the Spanish Diabetes Society.
Author Contributions: All authors attest to meeting the International Committee of Medical Journal Editors uniform requirements for authorship by making substantial contributions to conception and design of this paper; acquisitioning, analyzing, and interpreting the data; drafting or revising the article for intellectual content; and giving final approval of the published version. N.S. researched data/executed the study/wrote the manuscript; F.S. wrote the manuscript/contributed to statistical and image analysis; J.M. reviewed all MRI studies/reviewed manuscript; S.M-H. contributed to discussion/reviewed manuscript; A.C. researched data/contributed to discussion/ reviewed manuscript; B.G-A. reviewed all MRI studies/contributed to discussion/reviewed manuscript. N.S., F.S., A.C., and B.G-A. are the guarantors of this work.
Ethical Approval: Informed consent was obtained from all individual participants included in the study. All procedures performed in studies involving human participants were in accordance with the ethical standards of the institutional research committee and with the 1964 Helsinki declaration and its later amendments or comparable ethical standards.
Additional Information
Disclosure Statement: The authors have nothing to disclose. The authors declare that they have no conflict of interest.
Data Availability
The datasets generated during and/or analyzed during the current study are available from the corresponding author on reasonable request.
References
Author notes
These authors contributed equally to this work
