


Abstract
The long-term risk of type 2 diabetes in adolescents with nonalcoholic fatty liver disease (NAFLD) is unclear.
To assess type 2 diabetes risk among adolescents with NAFLD.
A nationwide, population-based study of Israeli adolescents who were examined before military service during 1997–2011 and were followed until December 31, 2016.
A total of 1 025 796 normoglycemic adolescents were included.
Biopsy or radiographic tests were prerequisite for NAFLD diagnosis. Data were linked to the Israeli National Diabetes Registry.
Type 2 diabetes incidence.
During a mean follow-up of 13.3 years, 12 of 633 adolescents with NAFLD (1.9%; all with high body mass index [BMI] at baseline) were diagnosed with type 2 diabetes compared with 2917 (0.3%) adolescents without NAFLD. The hazard ratio (HR) for type 2 diabetes was 2.59 (95% confidence interval [CI], 1.47–4.58) for the NAFLD vs. the non-NAFLD group after adjustment for BMI and sociodemographic confounders. The elevated risk persisted in several sensitivity analyses. These included an analysis of persons without other metabolic comorbidities (adjusted HR, 2.75 [95% CI, 1.48-5.14]) and of persons with high BMI; and an analysis whose outcome was type 2 diabetes by age 30 years (adjusted HR, 2.14 [95% CI, 1.02-4.52]). The results remained significant when a sex-, birth year-, and BMI-matched control group was the reference (adjusted HR, 2.98 [95% CI, 1.54-5.74]).
Among normoglycemic adolescents, NAFLD was associated with an increased adjusted risk for type 2 diabetes, which may be apparent before age 30 years.
Nonalcoholic fatty liver disease (NAFLD) is the most common chronic liver disease in the Western world (1). Insulin resistance has been characterized as a crucial pathophysiological factor in NAFLD. However, the strong association between NAFLD and type 2 diabetes is mechanistically complex, and NAFLD may precede or succeed diabetes onset (2, 3).
The dramatic increase in childhood and adolescent obesity has led to increased prevalence of NAFLD in this age group, exceeding one-third of children with obesity in some cohorts (4). However, prevalence estimates differ substantially between studies (5). The long-term risk of type 2 diabetes in normoglycemic adolescents with NAFLD is unclear, as is the independence of this risk from obesity status (1). Small retrospective cohorts and single-center longitudinal studies have reported variable rates of dysglycemia and type 2 diabetes in children and adolescents diagnosed with NAFLD (6, 7). Prospective observational studies were launched in the United States (TARGET-Nonalcoholic Steatohepatitis) and in Europe (European Paediatric NAFLD) to investigate the natural history of pediatric NAFLD (8, 9). In this study, we analyzed the association between clinically suspected and confirmed NAFLD and type 2 diabetes risk in a nationwide cohort of 1.02 million adolescents.
Materials and Methods
Study population
Included in the study were all Israeli adolescents (aged 16-19 years) who underwent medical evaluation 1 year before mandatory military service between 1997 and 2011. The examination process and study sample buildup are presented in Fig. 1. The medical evaluation was based on obtaining medical history, general physical examinations, and the results of additional tests and consultations, as appropriate. Sociodemographic data were collected from routine reports to military authorities by governmental ministries. Excluded from the cohort were individuals with a history of diabetes or dysglycemia, those who died before the establishment of the Israel National Diabetes Registry (INDR) in 2012, and those with missing height or weight data. The institutional review board of the Israel Defense Forces Medical Corps approved this study and waived the requirement for informed consent based on strict maintenance of anonymity of the individuals included.
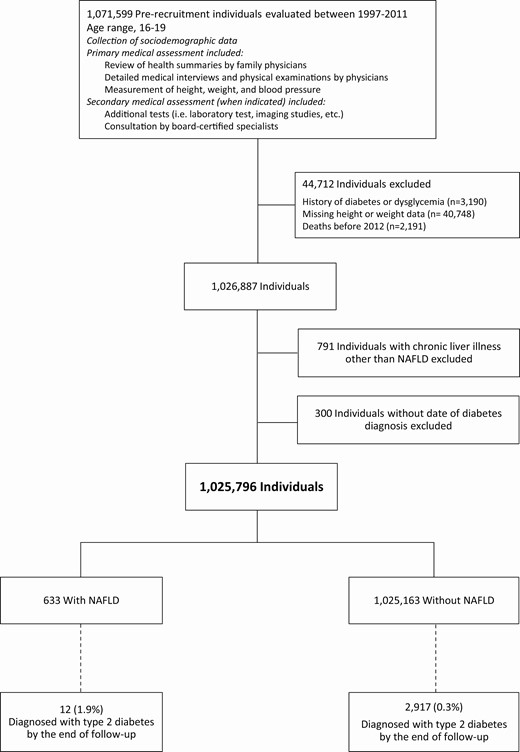
Study sample buildup. Nonalcoholic fatty liver disease (NAFLD) was diagnosed by a gastroenterologist at the time of medical evaluation. At baseline, 3.94% of the NAFLD group and 0.31% of the control group had dysglycemia or diabetes, and were excluded from the study sample. Of those who died before 2012, none was diagnosed with NAFLD. Individuals without dates of diabetes diagnosis (n = 300) were excluded from the main analysis but were included in the logistic regression analysis.
Diagnosis of NAFLD
The medical screening process was based on reviews of health summaries by family physicians and detailed medical interviews and physical examinations by physicians, but did not include routine evaluation of liver enzymes and plasma glucose levels. In general, positive medical history provided by family physicians or abnormal findings identified through physical examination would usually require additional tests and/or consultation by a board-certified specialist to establish the diagnosis and to determine medical fitness. Clinical diagnoses are grouped and assigned specific numerical codes according to disease severity, which are used to sort conscripts to appropriate military professions. The diagnosis of NAFLD was made by a board-certified gastroenterologist as part of the military enrollment process, based on biopsy-proven steatosis or radiographic-proven fatty liver in the presence of normal alcohol consumption and the absence of other forms of chronic liver disease. Conscripts who were evaluated for this diagnostic code underwent aminotransferase testing and screening for dysglycemia (fasting plasma glucose ≥ 100 mg/dL or glycated hemoglobin ≥5.7%). A diagnostic code of NAFLD was assigned to those with a NAFLD diagnosis and aminotransferase levels (in at least 2 tests) within normal range or mildly elevated (up to 2-fold of the upper normal limit) Detailed quantitative laboratory, imaging, and biopsy-related data that were assessed by gastroenterologists were unavailable to us. Conscripts with fatty liver who had greater aminotransferase elevation and those with biopsy-proven steatohepatitis, were grouped together under a different diagnostic code that included other liver diseases such as viral and autoimmune hepatitis, metabolic diseases, and cirrhosis (n = 791). Therefore, NAFLD in this group could not be differentiated from other liver pathologies and these individuals were excluded from the cohort.
The INDR
The primary outcome of the study was incident type 2 diabetes identified by the INDR. For each case of incident diabetes, the prerecruitment survey was linked to the INDR as described previously (10, 11). The INDR is a national registry maintained by the Israeli Center of Disease Control of the Israeli Ministry of Health. Since 2012, all Israeli health maintenance organizations (HMOs) are required by law to annually report prevalent cases of diabetes to the INDR. Diabetes cases were retrospectively reported by the HMOs between 2000 and 2011, and have been reported annually since.
Diabetes diagnosis was determined according to the presence of at least 1 of the following criteria during the previous year: (1) glycated hemoglobin ≥6.5% (48 mmol/mol); (2) serum glucose concentration of ≥200 mg/dL (11.1 mmol/L) in 2 tests performed at least 1 month apart; and (3) 3 purchases or more of glucose-lowering medications. The sensitivity of the INDR is 95% and the positive predictive value is 93% (10). The INDR classifies type 1, type 2, and uncertain types of diabetes, according to purchases of glucose lowering medications, as reported previously (10, 11) (all supplementary material and figures are located in a digital research materials repository) (12). For the primary outcome, only individuals classified as type 2 diabetes were included. The INDR contains data on the date of diabetes diagnosis reported by the HMOs (available for 91% of those with type 2 diabetes), and height and weight measurements at diagnosis (available for 83% of those with type 2 diabetes) (12). Follow-up extended from the initial medical evaluation until diabetes diagnosis, death, or December 31, 2016, whichever came first.
Study variables
Age at study entry and year of birth were treated as continuous variables. Body mass index (BMI) was calculated based on measured weight in kilograms divided by measured height in meters squared, and treated as a continuous variable. BMI ≥85th percentile was considered high. The remaining study variables (education, cognitive performance level, socioeconomic status, and country of origin) were defined as previously described (10, 13) (12). These were treated as categorial variables. Blood pressure was measured for all recruits, with 2 consecutive measurements. The average of these 2 measurements was recorded as the participant’s blood pressure. If participant blood pressure during the screening assessment was >140/90 mm Hg, the examinee was referred to additional outpatient recordings and evaluated by a specialist physician who determined hypertension based on average blood pressure above 140/90 mm Hg with at least half of the measurement above this level (12).
Statistical analysis
Chi-squared test or Fisher’s exact test were used to compare categorical variables, and the t test was used to compare continuous variables. The incidence rate of diabetes was calculated as the number of persons with diabetes divided by the cumulative duration in person years. Life tables were plotted to present the cumulative incidence of type 2 diabetes. Cox proportional hazards models were used to determine the hazard ratios (HRs) for incident type 2 diabetes in the NAFLD group compared with the control group. We determined the unadjusted HR and a minimally adjusted model that included adjustment for sex, birth year, and age at enrollment. We prespecified further adjustments for BMI (as a continuous variable), cognitive performance, education, residential socioeconomic status, and country of origin. To assess the robustness of the adjusted HR, E-value was calculated (14, 15). Individuals without dates of diabetes diagnosis were excluded from Cox analyses.
Sensitivity analyses
We performed the following sensitivity analyses: (1) To minimize confounding by coexisting morbidities, we limited the study sample to those without dyslipidemia or hypertension at study entry (conditions associated with insulin resistance) (12). (2) To further reduce the potential effect of abnormal blood pressure according to recent guidelines (16), we limited the analysis to those with optimal blood pressure at adolescence, which was defined as systolic blood pressure lower than 130 and diastolic blood pressure lower than 80 mm Hg. (3) An analysis was limited to male sex because the majority of individuals with NAFLD were men. (4) We set the outcome as type 2 diabetes diagnosed before age 30 years to better temporally assess the association between adolescent NAFLD and type 2 diabetes. (5) The period of study entry was limited to those who could be followed at least to age 30 years. (6) To account for diabetes diagnosis misclassification, we applied a more strict definition of type 2 diabetes diagnosis, which was based on the appearance of the INDR reports in 2 separate years. This definition has positive predictive value of 98% for the diagnosis of type 2 diabetes. (7) To account for misclassification of diabetes type, we included diabetes of uncertain type in the outcome. (8) Because glucose-lowering drugs might have been prescribed for indications other than diabetes, we excluded participants who were diagnosed solely based on metformin purchase. (9) We applied logistic regression models to assess all the incident cases of type 2 diabetes, including those with missing dates of diagnosis. (10) To assess the robustness of the adjusted HR, E-value was calculated (14, 15). (11) To minimize confounding by adolescent obesity, which frequently accompanies NAFLD, and to account for the possibility that lean NAFLD may be a different clinical entity (1), the cohort was stratified to normal and high BMI status at study entry (according to the US Centers for Disease Control and Prevention percentiles, with 85th BMI percentile as the cutoff).
We defined a control group that was individually matched for sex, birth year (within 1 year), and baseline BMI (within 1 unit) to individuals with high BMI diagnosed with NAFLD (10:1 ratio; n = 4250). This matching aimed to minimize residual confounding by adolescent BMI, which could remain even after adjustment of Cox models and stratification to BMI status. A life table was plotted for the control group to present the cumulative incidence of type 2 diabetes during the study follow-up. The Cox models described previously were applied to determine HRs for incident type 2 diabetes in the group with high BMI and NAFLD compared with the matched control group. Statistical analyses were performed with SPSS software, version 25.0 (IBM).
Results
Of 1 025 796 adolescents, 633 were diagnosed with NAFLD (Fig. 1). Compared with the control group, in the NAFLD group, proportions were higher of males (81.8% vs. 56.8%; P < 0.001) and of adolescents with high BMI (67.1% vs. 15.9%; P < 0.001). Moreover, higher prevalences of hypertension (7.9% vs. 0.2%; P < 0.001) and dyslipidemia (7.0% vs. 0.1%; P < 0.001) were observed in the NAFLD than the control group (Table 1).
Baseline Characteristics of the Study Population
| NAFLD | Control | |
|---|---|---|
| Number | 633 | 1 025 163 |
| Age, y | 17.5 ± 0.5 | 17.3 ± 0.5 |
| Male, no. (%) | 518 (81.8) | 582 036 (56.8) |
| Female, no. (%) | 115 (18.2) | 443 127 (43.2) |
| Male height, cm | 174.9 ± 7.1 | 174.1 ± 6.8 |
| Female height, cm | 163.8 ± 7.0 | 162.1 ± 6.2 |
| Male BMI, kg/m2 | 29.1 ± 6.4 | 22.1 ± 3.8 |
| Female BMI, kg/m2 | 27.9 ± 7.3 | 21.8 ± 3.7 |
| BMI categories, number (%)a | ||
| Normal BMI | 208 (32.9) | 862 253 (84.1) |
| High BMI | 425 (67.1) | 162 910 (15.9) |
| Completed high school education, % | 94 | 95 |
| Residential socioeconomic status, % | ||
| Low | 19 | 26 |
| High | 19 | 21 |
| Cognitive performance level, % | ||
| Low | 23 | 19 |
| Medium | 67 | 68 |
| High | 10 | 12 |
| Country of origin, % | ||
| Israel | 9 | 9 |
| Former USSR | 27 | 20 |
| Asia | 21 | 21 |
| Africa | 17 | 22 |
| Europe | 24 | 25 |
| Ethiopia | 1 | 3 |
| Hypertension, number (%)b | 50 (7.9) | 2021 (0.2) |
| Dyslipidemia, number (%)c | 44 (7.0) | 1261 (0.1) |
For continuous variables, the mean ± SD is given unless specified otherwise.
aBMI categories were classified into 2 groups according to US Centers for Disease Control and Prevention percentiles: normal BMI (BMI < 85th) and high BMI (BMI≥ 85th).
bHypertension was diagnosed by a specialist physician based on average blood pressure above 140/90 mm Hg on multiple office blood pressure measurements.
cDyslipidemia was defined as LDL levels above 150 mg/dL, or triglyceride levels above 250 mg/dL, or low HDL-cholesterol levels (<40 mg/dL [men]; <50 mg/dL [women]) in 2 separate tests measured after 12 hours of fasting.
Abbreviations: BMI, body mass index; HDL, high-density lipoprotein; LDL, low-density lipoprotein; NAFLD, nonalcoholic fatty liver disease. USSR, Union of Soviet Socialist Republics.
During the cumulative follow-up of 13 678 929 person-years, 12 individuals with NAFLD (1.9%, all with high BMI) were diagnosed with type 2 diabetes. This compares with 2917 individuals (0.3%) in the control group. The mean follow-up time was shorter in the NAFLD than the control group (10.9 ± 3.9 vs. 13.3 ± 4.3; P < 0.001). The HR for type 2 diabetes in the NAFLD group was 10.4 (95% confidence interval [CI], 5.9-18.3), after adjustment for sex, birth year, and age at study entry (Fig. 2B). Further adjustment for BMI attenuated the HR to 2.5 (95% CI, 1.4-4.4), which remained consistent after additional adjustment for other sociodemographic confounders (fully adjusted HR, 2.6 [95% CI, 1.5-4.6; Fig. 2B]). The elevated risk of the NAFLD group persisted in an analysis that included only adolescents without dyslipidemia or hypertension (adjusted HR, 2.8 [95% CI, 1.5-5.1]; Fig. 2B); included adolescents with optimal blood pressure (adjusted HR, 5.6 [95% CI, 2.5-12.5]; Supplementary Figure 1) (12) and when only men were included (adjusted HR, 3.1 [95% CI, 1.7-5.7]; Supplementary Figure 1) (12). Further, the risk remained elevated when a diagnosis of type 2 diabetes before age 30 years was the outcome (adjusted HR, 2.1 [95% CI, 1.02-4.53]; Fig. 2B); and when the period of study entry was limited to those who could be followed at least to age 30 years (adjusted HR, 3.1 [95% CI, 1.6-6.0]; Supplementary Figure 1) (12). Of note, the mean age of type 2 diabetes at diagnosis was comparable between the NAFLD and control groups (28.8 ± 4.8 years and 29.6 ± 4.1 years, respectively; P = 0.496). Sensitivity analyses that accounted for potential misclassification of diabetes diagnosis or diabetes type yielded similar results, as well as an analysis that excluded participants whose diagnosis of type 2 diabetes was solely based on metformin purchase (Supplementary Figure 1) (12). The elevated risk of the NAFLD group persisted when cases without dates of diabetes diagnosis were included in a logistic regression model (adjusted odds ratio, 2.6 [95% CI, 1.5-4.6]) (Supplementary Table 1) (12). The estimated E-value (95% lower value of CI) for the association between NAFLD and type 2 diabetes was 4.6 (2.3).
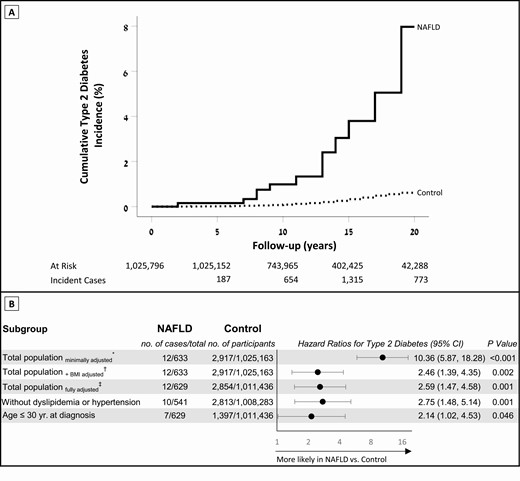
Adolescent NAFLD and the risk of incident type 2 diabetes in young adulthood. (A) Life tables of the cumulative incidence of type 2 diabetes of the study cohort during the follow-up period. (B) Hazard ratios for incident type 2 diabetes in individuals with NAFLD compared with the control group. The horizontal axis is presented in the logarithmic scale. *The minimally adjusted model includes sex, birth year, and age at enrollment. †Additionally adjusted for BMI (continuous variable). ‡The fully adjusted multivariable model also included cognitive performance, residential socioeconomic status, education level, and country of origin. The fully adjusted model was applied for all analyses unless indicated otherwise. BMI, body mass index; NAFLD, nonalcoholic fatty liver disease.
High BMI cohort
Of the 163 335 (15.9%) adolescents with high BMI (≥85th percentile), 425 (0.26%) were diagnosed with NAFLD. Supplementary Table 2 in the digital research materials repository shows the baseline characteristics of the NAFLD and control groups according to BMI status (12). The incident rates for type 2 diabetes (per 10 000 person-years) were 7.4 among adolescents with high BMI in the control group and 27.0 among adolescents with high BMI and NAFLD (Fig. 3A). Individuals with high BMI and NAFLD had a fully adjusted HR of 2.9 (95% CI, 1.7-5.2; Fig. 3B), and this point estimate persisted when all the subanalyses in Fig. 2B were applied (Supplementary Figure S2) (12).
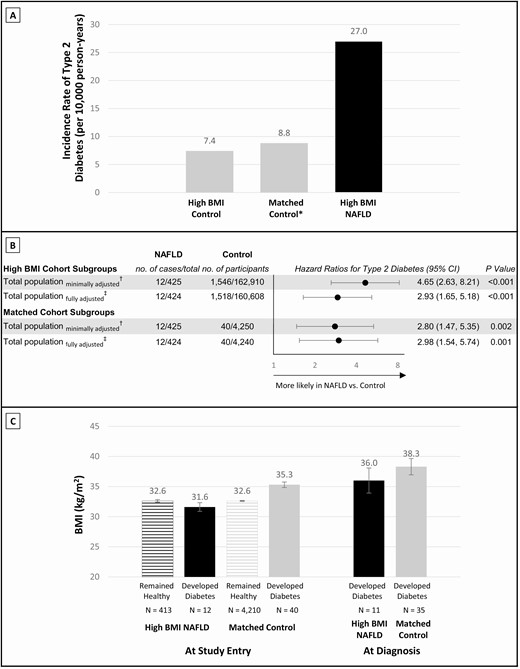
Dissecting adolescent NAFLD from adolescent BMI. (A) Incidence rates of type 2 diabetes in individuals with high BMI: control group, matched control group, and individuals with high BMI and NAFLD. Incidence rates were calculated from the fully adjusted model as persons with type 2 diabetes divided by the total number of person years of follow-up. *The matched control group was matched in a 10:1 ratio for each individual with high BMI and NAFLD, by sex, birth year, and BMI at study entry (n = 4250). (B) Hazard ratios for incident type 2 diabetes in individuals with high BMI and NAFLD compared with the high BMI control group and compared with the matched control group. †A minimally adjusted model and ‡a fully adjusted multivariable model were used as in the main analysis. (C) BMI at study entry is shown for the high BMI and NAFLD group, and for the matched control group, stratified by those diagnosed with type 2 diabetes and those who were not (remained healthy). Post-baseline BMI was measured only for those who developed diabetes. BMI, body mass index; NAFLD, nonalcoholic fatty liver disease.
Matched cohort
Baseline characteristics of the matched control group were similar overall to those of the individuals with high BMI and NAFLD, except for lower rates of hypertension and dyslipidemia (Supplementary Table 3) (12). The incidence rate for type 2 diabetes (per 10 000 person-years) in the matched control group was 8.8 (Fig. 3A). Considering the matched control group as a reference, the adjusted HR of individuals with high BMI and NAFLD for incident type 2 diabetes was 3.0 (95% CI, 1.5-5.7) (Fig. 3B).
Fig. 3C presents BMI values at study entry and at type 2 diabetes diagnosis by NAFLD status. Compared with their matched control peers, individuals with high BMI NAFLD who were diagnosed with type 2 diabetes had lower mean BMI at study entry (31.6 ± 2.5 vs. 35.3 ± 2.9 kg/m2; P < 0.001) and at diagnosis (36.0 ± 6.9 vs. 38.3 ± 8.0 kg/m2; P = 0.420).
Normal BMI cohort
Among 862 461 individuals with normal BMI (84.1%), 208 (0.02%) were diagnosed with NAFLD. There were no incident cases of type 2 diabetes among those with normal BMI and NAFLD. Among individuals with normal BMI and without NAFLD, 1371 (0.16%) were diagnosed with type 2 diabetes, with an incidence rate of 1.2 per 10 000 person-years. When the reference group was defined as individuals with normal BMI and without NAFLD, the adjusted HRs for incident type 2 diabetes among adolescents with high BMI, with and without NAFLD, were 5.6 (3.1-10.0) and 1.9 (1.7-2.2), respectively (Supplementary Table 4) (12).
Discussion
In this nationwide population-based historical cohort study, normoglycemic adolescents with clinically suspected and confirmed NAFLD had an approximately 3-fold increased risk for type 2 diabetes in young adulthood, compared with adolescents without NAFLD, after controlling for BMI and sociodemographic factors. The observed association was limited to adolescents with overweight and obesity, and withheld extensive sensitivity analyses, including limiting the age of diabetes diagnosis to 30 years.
Longitudinal studies that determined type 2 diabetes risk among persons with NAFLD predominantly included middle-ages persons, usually in their fourth decade of life or older, of South-Asian origin, and with follow-up periods shorter than 1 decade (17). These yielded statistically significant associations, with odds or hazard ratios ranging between 1.4 and 5.5 (18, 19). Two retrospective single-center studies assessed incident type 2 diabetes at adulthood in individuals who were diagnosed with NAFLD at childhood or adolescence. Feldstein et al. (6) described the natural history of NAFLD diagnosed in 66 children aged 3.2 to 19.6 years, of whom 67% were obese and 85% had at least 1 feature of the metabolic syndrome. During a mean follow-up of 6.4 years, 4 children (6.9%) with baseline normal fasting glucose developed type 2 diabetes. Cioffi et al. (7) studied 44 individuals diagnosed with NAFLD who were admitted to the hospital. Prevalences of metabolic abnormalities at the time of NAFLD diagnosis were high: type 2 diabetes, 18%; obesity, 91%; nonalcoholic steatohepatitis, 61%; and biopsy-proven liver fibrosis, 56%. Five children (13.9%) were diagnosed with type 2 diabetes after a mean follow-up of 4.5 years. To the best of our knowledge, our study is the first to systematically assess the risk for type 2 diabetes attributed to NAFLD in early life in a large, population-based cohort. Differences in study design, enrollment process and definition of NAFLD, and lower prevalence of obesity-related metabolic abnormalities likely account for the lower incidence of type 2 diabetes in our study.
The prevalence of NAFLD in children and adolescents varies from 2% to 29% in general population studies and from 5% to 83% among those treated in obesity clinics (5). The prevalence of NAFLD in the current study was markedly lower (0.1% in the entire cohort and 0.5% in individuals with obesity). Several explanations are possible for this difference. First, NAFLD prevalence was not based on systematic screening for NAFLD using routine blood tests; this could underestimate the true prevalence, as described in other real-world reports (20). Second, individuals diagnosed with NAFLD, with a higher than 2-fold increase in liver enzymes, were excluded. Third, studies in children and adolescents, including US data from the National Health and Nutrition Examination Survey, used definitions for NAFLD that were solely based on elevated alanine transaminase. These definitions mostly limited study samples to persons with overweight and obesity. The inclusion of aminotransferase levels in the definition of NAFLD may result in higher diagnosis rates than with radiographic- or biopsy-based diagnosis (5). In some, the diagnosis of NAFLD did not require exclusion of other chronic liver diseases, thus leading to an overestimation of the actual prevalence (5). Finally, the Mediterranean diet is highly widespread in Israel and is considered to be protective of NAFLD (21). Our findings corroborate a meta-analysis that reported greater prevalence of NAFLD among boys than girls and increasing prevalence with BMI categories (5).
In our study, 33% of the adolescents with NAFLD (208 of 633) had normal BMIs (<85th percentile) at study entry. Causes of lean NAFLD include environmental exposures, genetic risk factors, congenital defects of metabolism, endocrine disorders, drug-related disorders and the “metabolically unhealthy normal weight” phenotype (1). The association between adolescent NAFLD and type 2 diabetes in adulthood seemed to diverge by BMI status because none with lean NAFLD were diagnosed with type 2 diabetes during the study follow-up. This study may be underpowered to assess the association with type 2 diabetes among adolescents with normal BMI, as individuals with NAFLD were limited to a relatively mild disease and follow-up into adulthood was relatively short.
The elevated risk of type 2 diabetes persisted after controlling for adolescent BMI, by stratification, adjustment, and comparison to a BMI-matched group. Thus, we conclude that NAFLD is an independent risk factor of adolescent BMI for early-onset type 2 diabetes among adolescents with overweight and obesity. Fat accumulation in the liver was linked to various abnormal biochemical pathways (2) and was suggested as a key determinant of insulin resistance, with seemingly greater importance than that of visceral fat mass (22-25). Stefan at el. (3) showed that reduction in body weight among persons with NAFLD resulted in less pronounced improvement in glucose measures, compared with those without NAFLD (26). This echoes with our observation that the cumulative exposure to high BMI (as evident by BMI measurements at study entry and at diabetes diagnosis) was lower among individuals with NAFLD who developed diabetes than among their matched peers. Nevertheless, we emphasize that adolescents with NAFLD who were diagnosed with type 2 diabetes had an average BMI in the obese range, and this seemed to remain constant during the study period. This emphasizes the centrality of BMI status among adolescents with NAFLD, even if viewed as a lifestyle surrogate. Of note, NAFLD remained a significant risk factor for incident diabetes in subanalyses that aimed to mitigate confounding by other insulin-resistant-related conditions and other components of the metabolic syndrome. Further studies with greater sample size are needed to prove the independent role of NAFLD in the pathophysiology of early onset type 2 diabetes.
Early-onset type 2 diabetes (<40 years) was shown to have a more deleterious clinical course, including higher risk for cardiovascular morbidity and mortality and higher productivity burden than disease diagnosed at an older age (27, 28). Thus, in the current cohort of adolescents with NAFLD, the high cumulative incidence of early-onset type 2 diabetes (~8% by age 35 years among those with high BMI at study entry) is alarming. This is of particular importance given the persistence of point estimates when the outcome was set as type 2 diabetes onset by age 30 years. Concurrent NAFLD and type 2 diabetes may pose an additive risk with poor glycemic control (29), increased cardiac and kidney disease (30, 31), and a 2-fold increase in all-cause mortality compared with the diagnosis of type 2 diabetes without NAFLD (32). Furthermore, diabetes was consistently shown to be a major determinant of the clinical course of NAFLD, regarding their progression to fibrosis (33) and cardiovascular sequela and all-cause mortality (34). The coexistence of NAFLD and type 2 diabetes is of great economic burden, estimated to cost $1.6 trillion in the United States over the next 2 decades; the majority of costs are related to diabetes care, especially in young adults (35). Taken together, the clinical and economic burden of NAFLD and type 2 diabetes are expected to rise in the upcoming decades.
This study has several limitations. First, the study design did not include laboratory or radiographic systematic screening for NAFLD. Thus, results are limited to individuals diagnosed with NAFLD in routine clinical practice and whose initial assessment was based on clinical suspicion. Second, as alcohol consumption was self-reported, we could not fully exclude that some of the NAFLD cases in our study were in fact alcoholic steatohepatitis. However, given the low alcohol consumption in Israel compared to the United States and other Organization for Economic Co-operation and Development countries (36), this is unlikely. Third, because detailed histopathology and imaging data were unavailable to us, our cohort includes both simple steatosis and nonalcoholic steatohepatitis. Thus, we could not assess their particular correlations with type 2 diabetes risk and the potential for risk stratification. Fourth, we defined exposure to NAFLD based on diagnostic codes, which thereby makes the possibility for errors in the coding system. However, such errors are rare given the rigorous and well-constructed medical coding process in the Israeli army. Fifth, lifestyle data that are associated with both NAFLD and type 2 diabetes, including smoking status, physical activity, and diet habits, were unavailable to us. However, adjustment for sociodemographic variables that were shown to be associated with lifestyle habits in our population (37) did not materially change the results. Furthermore, an unknown confounder that is associated with both NAFLD and incident type 2 diabetes with a hazard that greater than 4.6 (with lower value of CI of at least 2.3) would be required to account for the association (reflected by the E-value). Sixth, we could not exclude the possibility that the control group included persons with dysglycemia because the enrollment process did not include screening for glucose levels in the entire cohort. However, such undiagnosed cases would underestimate the reported point estimate. Seventh, the relatively young cohort, as reflected by a median age of type 2 diabetes diagnosis younger than 30 years, limited the ability to identify lean NAFLD as a risk factor for type 2 diabetes. Finally, the sample size limits conclusions on the long-term risk of type 2 diabetes among females. The strengths of our study include a structured collection of clinical data, strict control for adolescent BMI and other key potential confounders, linkage between 2 nationwide databases, and inclusion of a population with a heterogenous genetic ancestry (38).
In conclusion, clinically suspected and diagnosed NAFLD among adolescents with normoglycemia is associated with early-onset type 2 diabetes, independent of sociodemographic factors. Overweight and obesity, which are tightly associated with NAFLD, may be necessary but insufficient to account for the increased risk. In the absence of effective pharmaceutical treatment for NAFLD, these findings emphasize the importance of aggressive reduction of other risk factors, especially excessive BMI, together with promotion of physical exercise (39) and tight medical follow-up starting at youth.
Abbreviations
- BMI
body mass index
- CI
confidence interval
- HMO
health maintenance organization
- HR
hazard ratio
- INDR
Israel National Diabetes Registry
- NAFLD
nonalcoholic fatty liver disease
Acknowledgments
We are grateful for members of the Steering Committee of the Israel National Diabetes Registry for their support in facilitating the linkage between the two databases described above. We thank the administrative staff of the Department of Military Medicine at the Hebrew University, Jerusalem, Israel for their technical support throughout this study. We are grateful for Mrs. Cindy Cohen for the language editing of this manuscript.
Financial Support: This work was supported by a research grant from the medical corps Israel Defense Forces (Israel) (Award no. 4440985218) award to G.T.
Additional Information
Disclosure Summary: No potential conflicts of interest relevant to this article were reported.
Data Availability
Restrictions apply to the availability of data generated or analyzed during this study to preserve patient confidentiality or because they were used under license. The corresponding author will on request detail the restrictions and any conditions under which access to some data may be provided.
References
Author notes
A.B. and C.D.B. contributed equally to this work.
