


Abstract
The accumulation of aberrant lipids and abnormal lipid metabolism in silent corticotroph adenomas (SCAs) could contribute to changes in clinical phenotypes, especially sphenoid sinus invasion.
To systematically investigate lipidomic and transcriptomic alterations associated with invasiveness and their potential molecular mechanisms in SCAs and to provide candidate biomarkers for predicting invasiveness and novel treatment options for invasive SCAs by targeting lipids.
Fifty-four SCAs (34 invasive/20 noninvasive) were subjected to lipidomic analysis based on ultraperformance liquid chromatography mass spectrometry, and 42 clinically nonfunctioning pituitary adenomas (23 invasive/19 noninvasive) were subjected to transcriptomic analysis. Differential analysis was performed to determine differential lipids and genes between invasive and noninvasive tumors. A functionally connected network was constructed with the molecular pathways as cores. Multiple machine learning methods were applied to identify the most critical lipids, which were further used to construct a lipidomic signature to predict invasive SCAs by multivariate logistic regression, and its performance was evaluated by receiver operating characteristic analysis.
Twenty-eight differential lipids were identified, and a functionally connected network was constructed with 2 lipids, 17 genes, and 4 molecular pathways. Connectivity Map (CMap) analysis further revealed 32 potential drugs targeting 4 genes and related pathways. The 4 most critical lipids were identified as risk factors contributing to the invasive phenotype. A lipidomic signature was constructed and showed excellent performance in discriminating invasive and noninvasive SCAs.
The lipidomic signature could serve as a promising predictor for the invasive SCA phenotype and provide potential therapeutic targets for SCAs.
Silent corticotroph adenomas (SCAs) commonly manifest as clinically nonfunctioning pituitary adenomas (NFPAs), presenting no biochemical or clinical characteristics of Cushing’s syndrome (1). It is difficult for clinicopathological and endocrinological features to distinguish SCAs from other clinically NFPAs, which can be diagnosed only by postoperative pathological examinations. According to 2017 World Health Organization guidelines, SCAs can be diagnosed by exhibiting immunopositivity for t-box transcription factor with adrenocorticotrophic hormone (ACTH) immunopositivity or negativity (2). Previous studies have demonstrated that SCAs may account for approximately 3% to 20% of all clinical NFPAs and 6.8% of all pituitary surgeries (1, 3-5). Due to a lack of evident endocrinological symptoms and signs of hypercortisolism, SCAs are commonly incidentally discovered by neuroradiological examinations or symptoms caused by mass effects (6). Compared with other common types of clinical NFPAs, SCAs tend to present a higher rate of invasiveness, such as cavernous or sphenoid sinus invasion, and exhibit more aggressive behaviors and more frequent and earlier recurrences despite standard therapies combining transsphenoidal adenectomy and radiotherapy. Attempts to explore the pathogenesis underlying the mechanisms of invasiveness and aggressiveness of SCAs are still limited and inconclusive.
Lipids are one of the most essential metabolites and play pivotal roles in both the physiology and pathophysiology of organisms. Currently, more than 10 000 different lipids and 600 distinct molecular species can be identified in healthy human tissues and lesions (7). Changes in the clinical phenotype are believed to be the result of the accumulation of lipid alterations, and abnormal lipid metabolism has been shown to contribute to the pathogenesis of multiple diseases, especially cancers (8). Lipidomic analysis of tumors can be performed to explore not only the related pathways and networks of lipid metabolism but also the structure, function, and number of the complete set of lipids, termed the lipidome, which are produced by tumor cells and the tumor microenvironment (9). As the most downstream nodes in phenotypic research, qualitative and quantitative studies of lipid alterations can reflect differences in cellular metabolism and reveal changes in gene expression patterns (10). Generally, lipidomic analysis may provide novel lipid biomarkers underlying the molecular pathogenesis of tumors and provide novel insight into therapeutic strategies by the target modulation of certain lipids.
In this study, on the basis of ultraperformance liquid chromatography mass spectrometry (UPLC-MS), we aimed to explore the invasiveness-associated lipid alterations and their potential molecular mechanisms in SCAs and to provide candidate biomarkers for predicting the invasive phenotype and novel treatment options for invasive SCAs by targeting critical lipids.
Materials and Methods
Patient population and sample collection
First, we analyzed 431 consecutive patients who were diagnosed with NFPAs and underwent transsphenoidal adenectomy at Peking Union Medical College Hospital (PUMCH) between January 2019 and December 2019. All patients received complete pituitary endocrinological and radiological assessments perioperatively and pathologic evaluations, including hematoxylin and eosin (H&E) staining and immunohistochemical (IHC) staining. The diagnosis of SCAs was defined by the following criteria: (1) absence of the clinical presentations of Cushing’s syndrome; (2) normal ACTH and cortisol dynamics by biochemical evaluations; and (3) t-box transcription factor IHC positivity with or without ACTH IHC positivity (1). After excluding 6 patients who previously underwent transsphenoidal surgery or radiotherapy, a total of 54 (12.5%) patients with SCAs were enrolled in this study. According to the criterion of invasiveness (Knosp classification Grade III-IV, and Hardy classification Grade III-IV and/or Type D-E) of pituitary adenomas determined by the coronal view of sellar magnetic resonance imaging (MRI), 34 (63.0%) SCAs were considered invasive, and 20 (37.0%) were considered noninvasive. Fresh tumor samples were immediately frozen in liquid nitrogen and stored at –80°C before lipid extraction.
This study was approved by the Institutional Ethics Committee of PUMCH at the Chinese Academy of Medical Sciences & Peking Union Medical College. All procedures involving human participants in this study were performed in accordance with the ethics standards of the Institutional Ethics Committee of PUMCH and with the 1964 Declaration of Helsinki and its later amendments or comparable ethics standards. Informed consent was obtained from all participants for the publication of any potentially identifiable images or data included in the study.
Sample preparation and lipid extraction
After slowly thawing at 4°C, 25 mg of tumor tissues as well as 800 μL of extraction solution, –20°C prechilled dichloromethane/methanol (3:1, v: v), and 10 μL of SPLASH internal standard stock solution (330707, SPLASHTM Lipidomix Mass Spec Standard, Avanti Polar Lipids, USA) were added to a 1.5-mL Eppendorf tube. Tissues were ground with 2 small steel balls in a mixed grinding apparatus (JXFSTPRP, Jingxin, China) at 50 Hz for 5 minutes. After ultrasonication in a 4°C water bath for 10 minutes, the Eppendorf tube was placed at –20°C for 1 hour. Following centrifugation at 25 000 rpm and 4°C for 15 minutes and the removal of 600 μL of supernatant, the tube was vacuum dried in a refrigerated CentriVap Concentrator (Labconco Corporation, Kansas, USA). Then, 200 μL of reconstituted solution, isopropanol/acetonitrile/H2O (2:1:1, v:v:v), was added, and the tube was vortexed for 1 minute, ultrasonicated at 4°C for 10 minutes in a water bath, and centrifuged at 25 000 rpm and 4°C for 15 minutes. The supernatant was transferred into a sample bottle. Additionally, 20 μL of supernatant of each sample was mixed together to constitute the quality control (QC) sample, which was applied to evaluate the repeatability and stability of the LC-MS analysis.
Lipidomic profiling analysis based on UPLC-MS
In this study, Waters 2D UPLC (Waters, USA) and a Q Exactive high-resolution mass spectrometer (Thermo Fisher Scientific, USA) were used to separate and detect lipids (11). Lipid separation was performed on the ACQUITY UPLC CSH C18 column (1.7 μm, 2.1 × 100 mm, Waters, USA). The positive ion mode mobile phase A consisted of 10 mM ammonium formate, 0.1% formic acid, and 60% acetonitrile, and mobile phase B consisted of 10 mM ammonium, 0.1% formic acid, 90% isopropyl alcohol, and 10% acetonitrile. The negative ion mode mobile phase A consisted of 10 mM ammonium formate and 60% acetonitrile, and mobile phase B consisted of 10 mM ammonium, 90% isopropyl alcohol, and 10% acetonitrile. The gradient used for elution was as follows. The initial elution was started at 40% B and increased by a linear gradient to 43% B for the first 2 minutes, followed by an immediate increase to 50% B within 0.1 minutes. From 2.1 to 7 minutes, the gradient was slowly increased to 54% B, and then the amount of B was increased to 70% in 0.1 minute. Over the next 5.9 minutes, the gradient was increased to 99% B. Finally, the gradient of B sharply decreased to 40% in 0.1 minute and was maintained for 1.9 minutes for the next injection. The flow rate of the mobile phase was 0.35 mL/min, the column temperature was set as 55°C, and the injection volume was 5 μL. Lipid detection was performed on the Q Exactive high-resolution mass spectrometer (Thermo Fisher Scientific, USA) in both positive and negative modes and operated in MSE mode with a mass-to-charge ratio (m/z) from 200 to 2000 and an acquisition time of 0.2 seconds per scan. The primary resolution was 70 000, the automatic gain control was 3 × 10⁶, and the maximum injection time was 100 ms. According to the precursor ion intensity, the top 3 ions were selected for fragmentation, and secondary information was then collected. The secondary resolution was 17 500, the automatic gain control was 1 × 10⁵, the maximum injection time was 50 ms, and the fragmentation energy (stepped normalized collisional energy [NCE]) was set as 15, 30, and 45 eV. The electrospray ionization parameter settings were as follows. The sheath gas flow rate was set as 40, the auxiliary gas flow rate was set as 10, the spray voltage was set as 3.80 kV in positive ion mode and 3.20 kV in negative ion mode, and the capillary temperature and auxiliary gas heater temperature were set as 320°C and 350°C, respectively. Finally, to reduce systematic errors and produce more reliable results, the samples were ranked randomly, and QC samples were interspersed every 10 tumor samples.
Data preprocessing and QC
The raw data generated by LC-MS/MS detection were imported into LipidSearch v.4.1 software (Thermo Fisher Scientific, USA) for qualitative and quantitative analyses of lipid molecules (12). First, LipidSearch v.4.1 was used to identify and extract the peak values of a single sample, and the peaks for all samples were then aligned. The parameters used for lipid identification and peak extraction were as follows. The mass deviation of the precursor and product ions was 5 ppm, and the response threshold was set to the relative response deviation of the product ion of 5.0%; the quality deviation of peak extraction was 5 ppm; the filter was set to top rank, all isomer peaks, and fatty acid priority; the M-score was set to 5.0, and the c-score was set to 2.0; and the possible adducts were [M+H]+, [M+NH4]+, and [M+Na]+ for positive ion mode, and [MH]–, [M-2H]–, and [M-HCOO]– for negative ion mode. We then performed peak alignment for all the identified lipids. The retention time deviation was set to 0.1 minute, and the peak filter was set to new filter, top rank, and all isomer peaks. Afterwards, the normalized peak data were further processed by MetaX software (13). (1) The lipid molecules that were detected in <50% of QC samples or <80% of tumor samples were abandoned. (2) The K nearest-neighbor algorithm was applied to fill in the missing values (14). (3) The probabilistic quotient normalization algorithm was used to normalize the data and obtain the relative peak area (15). (4) Batch effects were removed by the QC-based robust LOESS signal correction (QC-RLSC) method (11). (5) Lipid molecules with a coefficient of variation of more than 30% of the relative peak area in all QC samples were removed.
Furthermore, we comprehensively evaluated the quality of data through the repeatability of QC sample detection, including chromatogram overlap of QC samples, principal component analysis (PCA), and the difference between peak extraction number and peak response intensity. As shown elsewhere (all supplementary material and figures are located in a digital research materials repository (17), the MS apparatus was in good condition, and the data were stable and reliable during the entire process of sample detection and analysis.
Differential analysis of the lipidomics and transcriptomics of SCAs
Both multivariate and univariate analyses were applied to screen differential lipids between invasive and noninvasive SCAs. The multivariate analysis mainly included unsupervised PCA and supervised partial least squares discriminant analysis (PLS-DA) (16). PLS-DA used partial least squares regression to establish the relationships between lipid expression and sample groups. At the same time, variable importance in the projection (VIP) was calculated to evaluate the ability of the lipid expression pattern to classify and discriminate sample groups, thus assisting in the selection of metabolic biomarkers. It is generally believed that VIP ≥1 of the differential lipids indicates excellent ability in discriminating sample groups. In addition, the univariate analysis mainly contained fold change (FC) analysis and the rank-sum test. The adjusted P value (q value) was applied to correct the false positive results by using the default Benjamini-Hochberg false discovery rate method for multiple comparison correction. A q value <0.1 and |log2FC| ≥ 1 were considered the cutoff values to identify differential lipids.
The transcriptomic profiles of 42 freshly frozen pituitary adenoma samples were obtained from the GSE136781 dataset, which contains 19 noninvasive and 23 invasive nonfunctioning pituitary adenomas (http://www.ncbi.nlm.nih.gov/geo/) (18). Transcriptomic data were normalized by using the sva and limma packages in R 3.5.1 to remove batch effects and unwanted variations. The differentially expressed genes (DEGs) between invasive and noninvasive adenomas were screened using the edgeR package in R (19). A q value <0.1 and |log2FC| ≥ 1 were considered the cutoff values to identify the DEGs.
Pathway analysis and identification of a multiomic functionally connected network
To explore the molecular mechanisms of lipidomics in the invasiveness of SCAs, MetaboAnalyst 4.0 was introduced to perform Kyoto Encyclopedia of Genes and Genomes (KEGG) pathway enrichment analysis of the differential lipids (20). A P value <.05 was considered statistically significant. The lipids and genes in the same pathway generally dysregulate and function together; hence, we applied a pathway-based approach to integrate lipidomics and transcriptomics to reveal their intrinsic connections (21). The differential lipids and DEGs between the invasive and noninvasive SCAs were enrolled to construct a functionally connected network with their common KEGG pathways as cores, and the network was visualized with Cytoscape software. Finally, Connectivity Map (CMap; https://clue.io/) was applied to explore the potential compounds targeting the molecular pathways associated with the invasiveness of SCAs (22). The CMap database cannot only predict drugs based on the gene expression signature but also reveal the mechanism of action (MoA) of drugs and molecular pathways. The critical genes within the network were enrolled to query the CMap database.
Identification of a risk model for invasive SCAs by multiple machine learning algorithms
All 54 SCA patients were randomly classified into the training set (24 invasive and 14 noninvasive SCAs) and the validation set (10 invasive and 6 noninvasive SCAs). Due to the large amounts of differential lipid molecules between invasive and noninvasive SCAs, we applied multiple machine learning (ML) algorithms to screen the most critical lipids as risk factors contributing to the invasiveness of SCAs. First, we performed multiple ML-based feature selection methods on the training set. Least absolute shrinkage and selection operator (LASSO) regression (23), Random Forest and Boruta (RFB) (24), support vector machine recursive feature elimination (SVM-PFE) (25), and extreme gradient boosting (XGBoost) (26) analyses were utilized to select the most important features from high-dimensional data by using the glmnet, rms, randomForest, Boruta, e1071, caret, and xgboost packages in R. Boruta is a random forest (RF)-based feature selection method that can effectively select relevant variables by calculating the importance score for each feature (24). SVM-PFE is also an effective feature selection method based on the structural risk minimization principle by recursively removing 1 variable with the smallest ranking score until the optimal set of variables remains (25). XGBoost, based on an extreme gradient boosting framework, can employ optimal regularization and penalization to boosted trees and thereby screen features by their contributions (gains) (26). Afterwards, the intersecting lipids among the LASSO, Boruta, SVM and XGBoost analyses were considered the most critical lipids for further analysis, which were then visualized by a Venn diagram. Multivariate logistic regression analysis was performed with the critical lipids to determine the lipidomic risk factors for invasive SCAs, and a lipidomic risk model, defined by the lipidomic signature, was thereby constructed to predict the invasiveness of SCAs. Backward stepwise selection was applied by using the likelihood ratio test with Akaike’s information criterion as the stopping rule (27). Then, the performance of the lipidomic signature for discriminating invasive and noninvasive SCAs was investigated by receiver operating characteristic (ROC) curve analyses to determine the optimal cutoff values, areas under the ROC curve (AUCs), sensitivity, specificity, and accuracy. Finally, the performance of the lipidomic signature was also validated in the validation set in a similar manner.
Statistical analyses
Normally distributed continuous variables are expressed as the means ± standard deviations, and abnormally distributed continuous variables are expressed as the medians (interquartile ranges). Categorical variables are expressed as numbers (percentages). The independent Student’s t test was utilized to compare equivalent variables with normal distribution between two groups. For categorical variables and abnormally distributed variables, the Mann–Whitney U test was used to compare 2 groups. Correlations between normally distributed variables were assessed with Pearson’s correlation test, while correlations between abnormally distributed variables were assessed with Spearman’s correlation test. A |correlation coefficient| >0.5 and P < .05 were considered significantly correlated. Statistical analyses in this study were performed by using SPSS 22.0 (SPSS, Inc., Chicago, IL, USA) and R 3.5.1 software. A 2-tailed P < .05 was considered statistically significant. Odds ratios (ORs) and 95% confidence intervals (CIs) are reported if necessary.
Results
Demographics and clinicopathological characteristics of 54 SCA patients
The workflow of the study is displayed in Fig. 1. The demographics and clinicopathological variables of the 54 SCA patients analyzed are summarized in Table 1. In general, age, sex, body mass index (BMI), disease course, symptoms, endocrine examinations, and histopathological examinations did not differ significantly between invasive and noninvasive SCAs in either the training cohort or the validation cohort. However, invasive SCAs exhibited a significantly higher ratio of sphenoid (P = .024) and cavernous sinus invasion (P < .001), larger maximum diameter (P = .005), and larger tumor volume (P = .038) than noninvasive SCAs in the training set. In the validation set, only higher ratio of cavernous sinus invasion (P < .001), larger maximum diameter (P = .009), and larger tumor volume (P = .018) were also observed in the invasive SCAs compared with noninvasive SCAs. In addition, the percentage of sphenoid sinus invasion was significantly higher in the invasive SCA group than in the noninvasive SCA group (41.7% vs 7.1%, P = .024) in the training cohort. In the validation cohort, the invasive SCA group also demonstrated a higher percentage of sphenoid sinus invasion (60.0%) than the noninvasive SCA group (16.7%), with P = .091. In addition, we further applied ROC analyses to assess the performance of the clinicopathological variables in discriminating invasive and noninvasive SCAs. Only 6 variables, namely, hyperprolactinemia, sphenoid sinus invasion, maximum tumor diameter, tumor volume, tumor size, and Ki-67 index, showed good discriminative ability, with an AUC >0.6 (17). In addition, the predictive model based on the twenty clinical features was constructed by the multivariate logistic analysis, and it showed an AUC of 0.860 in the training set and 0.857 in the validation set (17). In general, all clinicopathological features except for sphenoid sinus invasion, maximum tumor diameter, and tumor volume demonstrated poor performance in distinguishing invasive and noninvasive SCAs; these 3 parameters showed merely average predictive ability. However, the model constructed by all clinical features showed the best predictive value.
Demographics and clinicopathological variables of 54 SCA patients
| Variable | Training cohort (n = 38) | Validation cohort (n = 16) | ||||
|---|---|---|---|---|---|---|
| Invasive (n = 24) | Noninvasive (n = 14) | P | Invasive (n = 10) | Noninvasive (n = 6) | P | |
| Age (years) | 51.8 ± 10.2 | 48.6 ± 11.8 | .387 | 50.5 ± 12.7 | 48.0 ± 11.6 | .701 |
| Sex (M/F) | 3/21 | 3/11 | .467 | 1/10 | 1/5 | .643 |
| BMI (kg/m2) | 25.1 ± 3.2 | 25.6 ± 2.0 | .590 | 23.4 ± 2.6 | 25.9 ± 1.7 | .055 |
| Disease course (years) | 0.9 (0.25, 2) | 1.5 (1, 2) | .293 | 0.9 (0.3, 2) | 2 (2, 2.5) | .194 |
| Symptoms | ||||||
| Headache (N/Y) | 9/15 | 7/7 | .452 | 4/6 | 5/1 | .091 |
| Visual disturbance (N/Y) | 9/15 | 6/8 | .899 | 3/7 | 2/4 | .889 |
| Amenorrhea (N/Y) | 20/4 | 10/4 | .385 | 7/3 | 4/2 | .889 |
| Oculomotor palsy (N/Y) | 22/2 | 13/1 | .896 | 9/1 | 6/0 | .424 |
| Endocrine examinations | ||||||
| Corticotropic deficiency (N/Y) | 24/0 | 13/1 | .782 | 10/0 | 5/1 | .182 |
| Thyrotropic deficiency (N/Y) | 20/4 | 11/3 | 1 | 8/2 | 4/2 | .551 |
| Gonadotropic deficiency (N/Y) | 21/3 | 12/2 | 1 | 9/1 | 5/1 | .696 |
| Somatotropic deficiency (N/Y) | 20/4 | 14/0 | .286 | 9/1 | 6/0 | .424 |
| Hyperprolactinemia (N/Y) | 18/6 | 7/7 | .117 | 3/7 | 3/3 | .221 |
| Pituitary MRI | ||||||
| Sphenoid sinus invasion (N/Y) | 14/10 | 13/1 | .024 | 4/6 | 5/1 | .091 |
| Cavernous sinus invasion (N/Y) | 0/24 | 14/0 | <.001 | 0/10 | 6/0 | <.001 |
| Max diameter (cm) | 2.9 ± 0.6 | 2.2 ± 0.6 | .005 | 2.9 ± 0.4 | 2.3 ± 0.4 | .009 |
| Tumor volume (mL) | 7.7 ± 6.9 | 3.9 ± 3.2 | .038 | 6.9 ± 3.3 | 4.0 ± 2.1 | .018 |
| Tumor size (macro/giant) | 17/7 | 13/1 | .233 | 7/3 | 6/0 | .137 |
| Apoplexy (N/Y) | 17/7 | 8/6 | .641 | 6/4 | 2/4 | .302 |
| Histopathology | ||||||
| Tumor consistency (soft/firm) | 21/3 | 12/2 | 1 | 10/0 | 5/1 | .182 |
| Ki-67 index (%) | 2 (2, 3) | 3 (2, 3) | .884 | 2.5 (1, 5) | 3 (1, 3) | .596 |
| P53 (+/-) | 4/20 | 0/14 | .106 | 3/7 | 0/6 | .137 |
Abbreviations: SCA, silent corticotroph adenoma; M/F, male/female; BMI, body mass index; N/Y, no/yes.
Tumor volume = sagittal × coronal × axial diameters × π /6 (mL). Tumor size was classified as microadenoma (<1 cm), macroadenoma (1–4 cm) or giant pituitary adenoma (>4 cm). Disease course and Ki-67 index are expressed as the median (interquartile range). Bold type: P < .05.
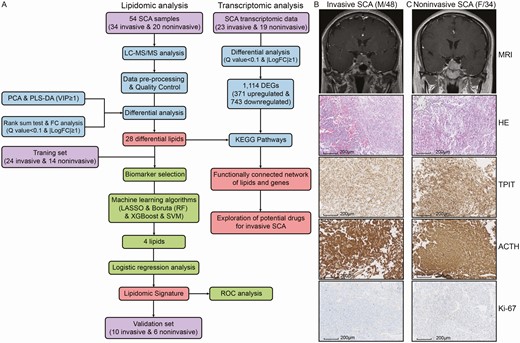
Overall workflow and patient selection for the comprehensive analysis of the lipidomics and transcriptomics of SCAs. (A) Study workflow. Examples of invasive (B) and noninvasive (C) SCAs. Sellar MRI indicated invasive SCAs as Knosp grades III-IV and noninvasive SCAs as Knosp grades I-II. No significant difference between invasive and noninvasive SCAs was observed in the pathologic evaluations, including H&E and IHC staining.
Lipidomic profiling of invasive and noninvasive SCAs
A total of 1130 and 582 lipidomic features were detected in positive and negative ion mode, respectively, by UPLC-MS/MS. Following strict data preprocessing and QC, only 743 and 348 lipids remained for further analysis. As shown in Fig. 2A, these lipids belonged to 7 categories and 38 subclasses, and glycerophospholipids were the most abundant categories (808 lipids, 74.0%).
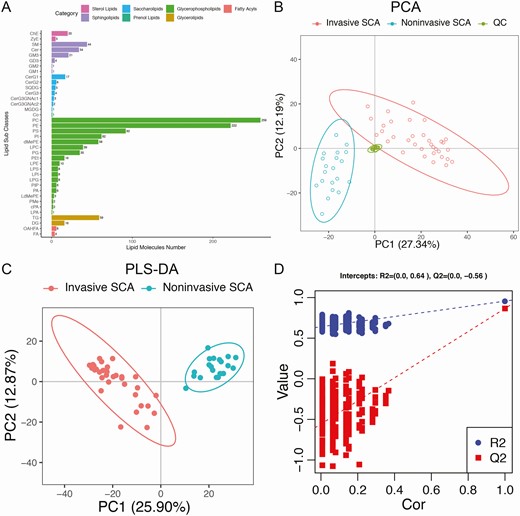
Overview of lipidomic profiling based on the UPLC-MS method. (A) All the lipid molecules belonging to 7 categories and 38 subclasses identified by UPLC-MS. (B) Unsupervised PCA demonstrated clear separations of invasive SCA, noninvasive SCA and QC samples, which ensured excellent stability of lipid detection. (C) Supervised PLS-DA also demonstrated clear separations of the invasive and noninvasive SCA samples (R2Y = 0.877, Q2 = 0.680). (D) Validation plots obtained from 200 response permutation tests showed stable and reliable quality of the PLS-DA model.
Unsupervised PCA was first performed to visualize the differences in lipids between invasive and noninvasive SCAs. The PCA score plot demonstrated clear separations of invasive, noninvasive, and QC samples, and the tightly clustered QC samples ensured excellent stability of lipid detection (Fig. 2B). Furthermore, supervised PLS-DA clearly distinguished the invasive and noninvasive SCA samples (Fig. 2C). The model was constructed by 7-fold cross-validation and assessed by monitoring the goodness of fit (R2Y) and predictive ability (Q2), with R2Y = 0.877 and Q2 = 0.680. Validation plots were obtained from 200 response permutation tests, which showed stable and reliable quality of the PLS-DA model (Fig. 2D). All these findings suggest distinct lipidomic patterns between invasive and noninvasive SCAs.
Differential lipids and genes between invasive and noninvasive SCAs
Following the multivariate and univariate analyses, a total of 28 differential lipids, including 1 upregulated lipid and 27 downregulated lipids, were identified between invasive and noninvasive SCA samples (Table 2). The 28 differential lipids belonged to 16 subclasses, 9 main classes, and 3 categories: saccharolipids, glycerophospholipids, and sphingolipids. The single upregulated lipid in invasive SCAs was monosialoganglioside 3 (GM3)(d38:2), which is a ganglioside and belongs to the sphingolipid category. The expression patterns of the differential lipids are displayed as a hierarchical clustering heatmap (Fig. 3A) and boxplots (Fig. 3B). Correlation analysis of the differential lipids indicated that most of the lipids were significantly positively correlated with each other except for GM3(d38:2), which showed a highly negative correlation with other lipids (Fig. 3C). Furthermore, correlation analysis between lipidomic profiles and clinicopathological variables demonstrated that all the differential lipids were significantly correlated with the invasiveness status (Fig. 3D). In addition, GM3(d38:2), GM3(d42:1+O), and phosphatidylinositol (PI)(16:0/16:2) were negatively correlated with sex, and dimethylphosphatidylethanolamine (dMePE)(18:1/18:2), GM3(d42:1 + O), phosphatidylethanolamine (PE)(39:4e), and phosphatidylserine (PS)(19:0/20:4) were negatively correlated with maximum tumor diameter. Furthermore, transcriptomic analysis identified a total of 1114 DEGs, including 371 upregulated and 743 downregulated genes, between invasive and noninvasive SCA samples (17).
Differential lipids between invasive and noninvasive SCA samples
| ID | Log2FC | P value | Q value | VIP | RT | Lipids | Adduct | m/z | Ion formula | AUC | 95% CI |
|---|---|---|---|---|---|---|---|---|---|---|---|
| 8.74_846.702905472727 | –2.642773821 | 1.09 × 10⁻³ | 4.91 × 10⁻² | 1.216518617 | 8.74 | CerG1(d42:0 + 2O) | M + H | 846.7028755 | C48 H96 O10 N1 | 0.658 | 0.619-0.697 |
| 8.34_844.687257935484 | –3.477949524 | 3.33 × 10⁻⁵ | 2.23 × 10⁻³ | 1.236724279 | 8.34 | CerG1(d42:1 + 2O) | M + H | 844.6872255 | C48 H94 O10 N1 | 0.610 | 0.571-0.649 |
| 5.25_878.619960678571 | –3.467403034 | 4.88 × 10⁻⁴ | 2.38 × 10⁻² | 1.268335323 | 5.25 | CerG2(d18:1/16:0 + O) | M+H | 878.6199355 | C46 H88 O14 N1 | 0.627 | 0.588-0.666 |
| 6.03_768.554890163934 | –4.467705642 | 3.11 × 10⁻⁷ | 4.27 × 10⁻⁵ | 1.253372818 | 6.03 | dMePE(18:1/18:2) | M-H | 768.5548805 | C43 H79 O8 N1 P1 | 0.699 | 0.660-0.738 |
| 3.03_1458.79626765385 | –5.342114016 | 7.45 × 10⁻⁷ | 8.66 × 10⁻⁵ | 2.162467162 | 3.03 | GD3(d34:1+O) | M-H | 1458.796221 | C68 H120 O30 N3 | 0.518 | 0.479-0.557 |
| 3.22_1442.80154337705 | –2.025816285 | 1.82 × 10⁻³ | 6.90 × 10⁻² | 1.575836608 | 3.22 | GD3(d34:1) | M-H | 1442.801306 | C68 H120 O29 N3 | 0.646 | 0.607-0.685 |
| 3.62_1516.838173 | –4.253614126 | 3.37 × 10⁻⁵ | 2.23 × 10⁻³ | 1.076404867 | 3.62 | GM1(d34:1) | M-H | 1516.838086 | C71 H126 O31 N3 | 0.554 | 0.515-0.593 |
| 3.03_1123.67475613115 | –4.091712941 | 3.39 × 10⁻⁵ | 2.23 × 10⁻³ | 1.842919943 | 3.03 | GM3(d32:1) | M-H | 1123.674587 | C55 H99 O21 N2 | 0.518 | 0.479-0.557 |
| 4.95_1205.75285943333 | 2.189171873 | 2.83 × 10⁻³ | 9.51 × 10⁻² | 1.481133157 | 4.95 | GM3(d38:2) | M-H | 1205.752837 | C61 H109 O21 N2 | 0.560 | 0.521-0.599 |
| 6.94_1279.82604055172 | –3.341410937 | 1.90 × 10⁻⁴ | 1.03 × 10⁻² | 1.293170462 | 6.94 | GM3(d42:1+O) | M-H | 1279.826002 | C65 H119 O22 N2 | 0.497 | 0.458-0.536 |
| 6.28_1259.79986118333 | –3.083548121 | 2.51 × 10⁻⁴ | 1.31 × 10⁻² | 1.839537428 | 6.28 | GM3(d42:3) | M-H | 1259.799787 | C65 H115 O21 N2 | 0.476 | 0.437-0.515 |
| 1.99_510.391391516129 | –1.228156421 | 1.71 × 10⁻³ | 6.79 × 10⁻² | 2.112514389 | 1.99 | LPC(18:0e) | M + H | 510.3918035 | C26 H57 O6 N1 P1 | 0.676 | 0.637-0.715 |
| 1.45_580.362009 | –5.942488573 | 3.86 × 10⁻⁸ | 9.72 × 10⁻⁶ | 1.235939317 | 1.45 | LPC(19:1) | M + HCOO | 580.3619955 | C28 H55 O9 N1 P1 | 0.530 | 0.491-0.569 |
| 2.1_468.344777629032 | –2.191810941 | 1.41 × 10⁻⁵ | 1.07 × 10⁻³ | 2.60094581 | 2.1 | LPE(18:0e) | M + H | 468.3448535 | C23 H51 O6 N1 P1 | 0.655 | 0.616-0.694 |
| 2.52_510.355423387097 | –2.085275726 | 8.55 × 10⁻⁵ | 5.17 × 10⁻³ | 1.588067641 | 2.52 | LPE(20:0) | M + H | 510.3554185 | C25 H53 O7 N1 P1 | 0.580 | 0.541-0.619 |
| 1.25_511.304163245902 | –5.788620452 | 3.09 × 10⁻⁸ | 9.72 × 10⁻⁶ | 1.268175732 | 1.25 | LPG(18:0) | M-H | 511.3041465 | C24 H48 O9 N0 P1 | 0.643 | 0.604-0.682 |
| 9.04_852.648806114754 | –6.591943411 | 1.37 × 10⁻⁷ | 2.07 × 10⁻⁵ | 1.34055213 | 9.04 | PE(24:0/20:3) | M-H | 852.6487805 | C49 H91 O8 N1 P1 | 0.664 | 0.625-0.703 |
| 5.94_840.554900733333 | –5.774576081 | 9.46 × 10⁻⁸ | 1.79 × 10⁻⁵ | 1.605218986 | 5.94 | PE(24:5/20:4) | M-H | 840.5548805 | C49 H79 O8 N1 P1 | 0.628 | 0.589-0.667 |
| 8.18_768.590178774194 | –1.247773258 | 1.38 × 10⁻³ | 5.97 × 10⁻² | 1.347036728 | 8.18 | PE(39:4e) | M + H | 768.5901685 | C44 H83 O7 N1 P1 | 0.732 | 0.693-0.771 |
| 5.74_799.549493298246 | –5.956785295 | 1.22 × 10⁻⁶ | 1.32 × 10⁻⁴ | 1.749869628 | 5.74 | PG(18:1/20:2) | M-H | 799.5494615 | C44 H80 O10 N0 P1 | 0.661 | 0.622-0.700 |
| 3.78_805.487282830508 | –4.992398474 | 4.25 × 10⁻⁵ | 2.67 × 10⁻³ | 1.834572536 | 3.78 | PI(16:0/16:2) | M-H | 805.4872565 | C41 H74 O13 N0 P1 | 0.589 | 0.550-0.628 |
| 5.95_871.570775557377 | –1.932846783 | 6.31 × 10⁻⁴ | 2.98 × 10⁻² | 1.208312579 | 5.95 | PI(18:0e/20:4) | M-H | 871.5705915 | C47 H84 O12 N0 P1 | 0.676 | 0.637-0.715 |
| 8.41_1215.78226483607 | –5.102815466 | 2.40 × 10⁻⁶ | 2.02 × 10⁻⁴ | 1.197156038 | 8.41 | PIP(56:5) | M-H | 1215.78224 | C65 H117 O16 N0 P2 | 0.580 | 0.541-0.619 |
| 6.09_824.54473652459 | –5.368358045 | 3.36 × 10⁻⁸ | 9.72 × 10⁻⁶ | 1.464477576 | 6.09 | PS(19:0/20:4) | M-H | 824.5447105 | C45 H79 O10 N1 P1 | 0.619 | 0.580-0.658 |
| 6.24_864.576036977778 | –4.866399406 | 1.30 × 10⁻⁷ | 2.07 × 10⁻⁵ | 1.114751277 | 6.24 | PS(24:4/18:1) | M-H | 864.5760105 | C48 H83 O10 N1 P1 | 0.557 | 0.518-0.596 |
| 8.36_772.549780163934 | –5.999547062 | 9.47 × 10⁻⁸ | 1.79 × 10⁻⁵ | 1.7785929 | 8.36 | PS(36:1p) | M-H | 772.5497955 | C42 H79 O9 N1 P1 | 0.676 | 0.637-0.715 |
| 4.84_759.565800901639 | –5.877150165 | 1.40 × 10⁻⁸ | 9.71 × 10⁻⁶ | 1.128369302 | 4.84 | SM(d35:2) | M + HCOO | 759.5657795 | C41 H80 O8 N2 P1 | 0.634 | 0.595-0.673 |
| 1.7_961.62817016129 | –2.043369055 | 3.55 × 10⁻⁴ | 1.79 × 10⁻² | 1.431824013 | 1.70 | SQDG(41:2) | M + HCOO | 961.6291555 | C51 H93 O14 S1 | 0.619 | 0.580-0.658 |
Abbreviations: SCA, silent corticotroph adenoma; FC, fold change; VIP, variable importance of the projection; RT, retention time; m/z, mass-to-charge ratio; AUC, area under the curve; 95% CI, 95% confidence interval.
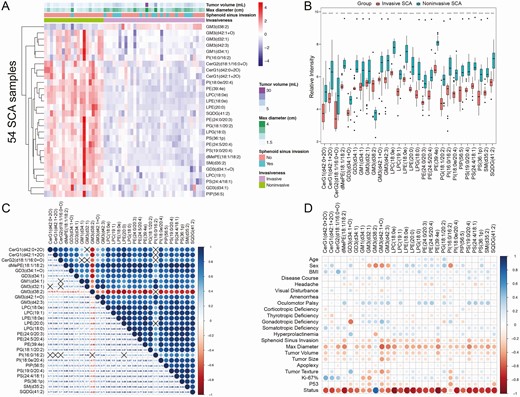
Differential lipids and correlation analysis. (A) Clustering heatmap of 28 differential lipids between invasive and noninvasive SCA samples. Red indicates high intensity, and blue indicates low intensity. Tumor volume, maximum tumor diameter, and sphenoid sinus invasion demonstrated significant differences between invasive and noninvasive SCAs, as displayed in the heatmap. (B) The boxplots of 28 differential lipids indicated significant differences between invasive and noninvasive SCA samples (all P < .05). ****P < .001, ***P < .01, **P < .05, and *P < .1. (C) Correlation analysis of the 28 differential lipids. Red indicates a negative correlation, and blue indicates a positive correlation. The black cross indicates P > .05. (D) Correlation analysis between the differential lipids and clinicopathological variables.
Establishment of a multiomic functionally connected network
First, to explore the molecular mechanisms of lipidomics in the invasiveness of SCA, pathway analysis of the differential lipids was performed by MetaboAnalyst 4.0. The 28 differential lipids were significantly enriched in 4 KEGG pathways: glycerophospholipid metabolism, glycosylphosphatidylinositol anchor biosynthesis, glycerolipid metabolism, and PI signaling system (Fig. 4A). The rapid proliferation and invasion of tumor cells require the metabolism (both anabolism and catabolism) of large amounts of lipids, which may explain why these differential lipids are involved in these pathways. Then, 2 lipids, lysophosphatidylglycerol(18:0) and PE(24:0/20:3), and 17 DEGs (6 upregulated genes and 11 downregulated genes) between invasive and noninvasive SCAs were used to construct the functionally connected network with their shared KEGG pathways as cores (Fig. 4B). These lipids and genes in the same pathways are generally believed to be dysregulated and function together. Finally, CMap mode-of-action analysis revealed that 32 compounds targeted 26 molecular pathways (Fig. 4C). Twelve compounds shared the same MoA as acetylcholinesterase inhibitors. CMap target analysis indicated that 4 (23.5%) drug target genes were shared by the mentioned compounds, and ACHE was the most critical gene targeted by 29 compounds. The exploration of these potential drugs may provide novel therapeutic options for the treatment of invasive SCAs.
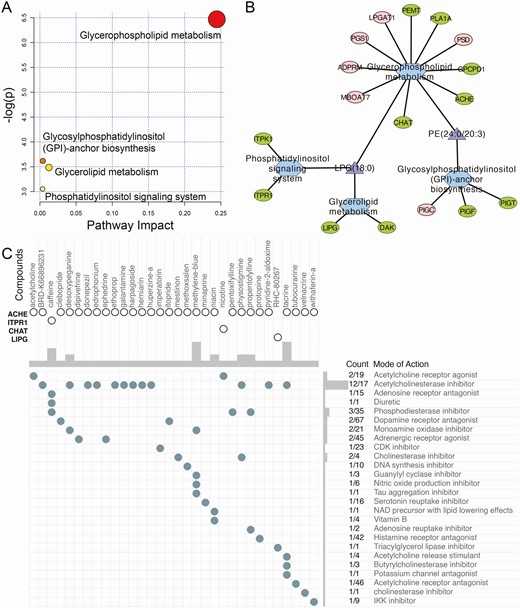
Construction of the functionally connected network. (A) Pathway analysis of the differential lipids. (B) Multiomic functionally connected network with 2 lipids, 17 genes, and 4 KEGG pathways. Red represents upregulated genes, green represents downregulated genes, purple triangles represent lipids, and blue hexagons represent KEGG pathways. (C) CMap analysis revealed 32 potential drugs targeting 4 genes and 26 molecular pathways.
Identification of a lipidomic signature for predicting invasive SCAs
First, we applied multiple ML-based feature selection methods to screen the most critical lipids as risk factors contributing to the invasiveness of SCAs. As shown elsewhere (17), 4 lipids were selected by LASSO regression analysis, 8 by Boruta (RF), 7 by SVM, and 12 by XGBoost (Fig. 5A-C) (17). A Venn diagram identified 4 critical lipids that were shared by four feature selection methods (Fig. 5D). Then, ROC curve analyses were performed to evaluate the discriminative ability of the 4 lipids (Table 2). PE(39:4e) showed the best predictive ability in distinguishing invasive and noninvasive SCAs, with an AUC of 0.732, followed by PI(18:0e/20:4) (AUC = 0.676), lysophosphatidylcholine (LPC)(18:0e) (AUC = 0.676), and PS(19:0/20:4) (AUC = 0.619). Overall, the predictive performance of every lipid alone to discriminate invasive and noninvasive SCAs was limited. Hence, we applied multivariable logistic regression analysis to construct a lipidomic signature by combining the 4 critical lipids (Table 3). The lipidomic signature was calculated by the following formula: lipidomic scores = –0.591 – 0.421 × log2 intensity of PI(18:0e/20:4) + 0.787 × log2 intensity of PE(39:4e) + 0.464 × log2 intensity of LPC(18:0e) + 0.550 × log2 intensity of PS(19:0/20:4). The lipidomic signature demonstrated an AUC of 0.899 for distinguishing invasive and noninvasive SCAs (Fig. 5G), with a sensitivity of 91.7%, a specificity of 85.7%, and an accuracy of 89.5% in the training cohort (Fig. 5E). The optimal cutoff value for discrimination was 8.238, and patients with a lipidomic signature score <8.238 were considered to have invasive SCAs. In the validation set, the lipidomic signature yielded an AUC of 0.824 (Fig. 5H), with a sensitivity of 80.0%, a specificity of 83.3%, and an accuracy of 81.3% (Fig. 5F). Overall, the 4-lipid risk model demonstrated excellent predictive ability in discriminating invasive and noninvasive SCAs and could help identify potential therapeutic targets and serve as a promising invasiveness predictor for SCAs.
Lipidomic risk factors for invasive SCAs by multivariable logistic regression analysis
| Variable | β | OR (95% CI) | P Value |
|---|---|---|---|
| Lipidomic Signature | |||
| Intercept | –.591 | — | .013 |
| PI(18:0e/20:4) | –.421 | 0.657 (0.618-0.696) | .045 |
| PE(39:4e) | .787 | 2.197 (2.158-2.236) | .013 |
| LPC(18:0e) | .464 | 1.590 (1.551-1.629) | .038 |
| PS(19:0/20:4) | .550 | 1.732 (1.693-1.771) | .035 |
Abbreviations: SCA, silent corticotroph adenoma; β, regression coefficient; OR, odds ratio; 95% CI, 95% confidence interval.
Bold: P < .05.
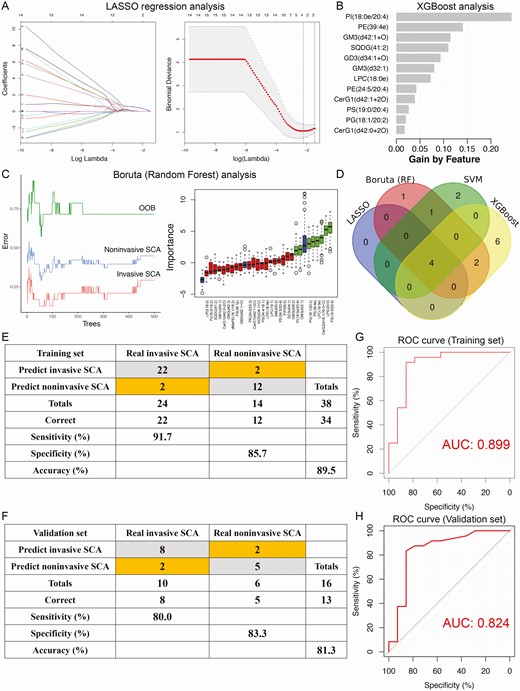
Identification of the lipidomic signature for invasive SCAs by multiple machine learning algorithms. (A) LASSO regression analysis. Left: Coefficient values at varying levels of penalty; each curve represents a lipid. Right: Ten-fold cross-validation was used to calculate the best lambda value, which led to a minimum mean cross-validated error. Red dots represent partial likelihood deviance; solid vertical lines indicate their corresponding 95% CI; the left dotted vertical line represents the value of lambda that gives the minimum CVM; the right dotted vertical line represents the largest value such that the error is within 1 standard error of the minimum. (B) XGBoost analysis. (C) Boruta analysis based on random forest. Left: Associations between tree numbers and the error rate in invasive and noninvasive SCA and out-of-bag (OOB) samples. Right: Importance plot of the lipids. Green boxes represent important features, red boxes represent unimportant features, and blue boxes represent interquartile ranges. (D) Venn diagram revealed 4 critical lipids that were shared by four feature selection methods. Confusion matrices of the binary results of the lipidomic signature for the training (E) and validation (F) sets. ROC curves of the lipidomic signature in distinguishing invasive and noninvasive SCA patients in the training (G) and validation (H) sets.
Compared with the predictive model constructed by clinical features alone, the lipidmoic signature showed better predictive performance. However, the combined predictive model based on both clinical features and the lipidomic signature constructed by the multivariate logistic analyses demonstrated an AUC of 0.982 in the training cohort and 0.963 in the validation cohort for distinguishing invasive and noninvasive SCAs (17). Hence, compared with the predictive model generated form the clinical features alone or lipidomics alone, the combined model indicated the best performance in discriminating invasive and noninvasive SCAs.
Discussion
Invasiveness is one of the most important phenotypes of clinically NFPAs for clinicians when developing treatment and follow-up strategies. Because of invasive growth, total resection by transsphenoidal surgery is rarely achieved, and medications play only a minimal role in clinically NFPAs. This situation poses a huge challenge for the treatment of invasive tumors, and invasiveness is also believed to be an important prognostic factor for surgical outcomes and the recurrence of NFPAs (28). As one of the most common and pathologically unique clinically NFPAs, SCAs tend to present a high rate of invasiveness and exhibit aggressive behaviors and frequent and early recurrences even after receiving standard treatments (1). However, the underlying mechanisms contributing to the invasiveness of SCAs are still not clear.
Previous studies have been performed to investigate the genomic, transcriptomic, epigenetic, metabolomic and proteomic characteristics of NFPAs (29-31). However, there have been few studies on lipidomic analyses, and no previous study has investigated the associations between altered lipids and the invasiveness of NFPAs. To our knowledge, this is the first study to investigate invasiveness-associated lipid alterations and their potential molecular mechanisms in SCAs.
In the present study, untargeted UPLC-MS/MS was used to systematically explore lipid alterations associated with the invasiveness of SCAs in 54 SCA samples (34 (63.0%) invasive and 20 (37.0%) noninvasive). A total of 28 differential lipids were identified, and most (96.4%) were shown to be downregulated in invasive SCAs. Previous studies have investigated the pivotal roles of altered lipids and abnormal lipid metabolism in the pathogenesis of multiple cancers. Glycerophospholipids, the most important and most abundant components of the lipidome, consist of more than 21 subclasses of lipids. As the skeletal constituents of the cell membrane, an imbalance in phosphatidylcholine (PC), PE, PI, phosphatidylglycerol, phosphatidic acid (PA), PS, and cardiolipin will contribute to cellular dysfunctions by impairing the physicochemical properties of the lipid bilayer (32). In addition, LPC, lyso-PA (LPA), lysophosphatidylglycerol, and lyso-PE (LPE) participate in signal transduction and fatty acid carriage and can induce inflammation, autophagy, and apoptosis (33, 34). It has been reported in the literature that the downregulation of inflammatory lipids, such as LPC and lyso-PA, can promote the invasion and metastasis of tumor cells and resistance to chemoradiotherapy and prevent impairments to the immune system (33-35). Pathway analysis indicated that these invasiveness-associated lipids are significantly enriched in energy metabolism-related pathways. The rapid proliferation and invasion of tumor cells require metabolism, especially lipid metabolism, which may explain why these differential lipids were relatively insufficient in invasive SCAs (36). These findings might suggest the critical roles of the 28 differential lipids in the lipid metabolisms associated with active proliferations of SCAs, and may also provide new evidence for cancer-targeted treatments for patients with invasive tumors.
To reveal the potential intrinsic interactions of lipidomics and transcriptomics, 2 lipids, 17 genes, and 4 KEGG pathways were used to construct a functionally connected network. These key lipids and genes in the same pathways are generally believed to be dysregulated and function together (21). Furthermore, drug exploration analysis revealed 32 potential drugs targeting 4 genes and corresponding molecular pathways. We found that a total of 12 compounds shared the same MoA as acetylcholinesterase inhibitor, and ACHE was the most critical gene targeted by 29 compounds. Acetylcholinesterase, encoded by ACHE, is a key enzyme that has been reported to hydrolyze the neurotransmitter acetylcholine at neuromuscular junctions and brain cholinergic synapses and thus terminate signal transmission (37). It can be found in the cell membrane with diverse molecular forms and modes of cell attachment to the cell surface (38). Previous studies have reported that low ACHE expression promotes the proliferation and metastasis of tumor cells (39). These findings may provide novel therapeutic options for invasive SCAs by targeting invasiveness-associated genes, especially ACHE, and corresponding molecular pathways.
Changes in the clinical phenotype are commonly believed to be the result of the accumulation of lipid alterations. Hence, we applied multiple ML methods to screen the most critical lipids as risk factors contributing to the invasive phenotype of SCAs. Four lipids, including 3 membrane-constituting lipids and 1 signal-transducing lipid, were identified. To our knowledge, this is the first study to identify key lipids associated with the invasiveness of SCAs. Then, following the multivariate logistic regression analysis, a lipidomic signature for predicting SCAs was successfully constructed and validated in another independent patient population. The lipidomic signature exhibited favorable predictive value in stratifying invasive and noninvasive SCAs. When used for clinical application, we hope to identify those patients with potentially high risk of invasion predicted by lipidomic signature, while negative in preoperative sellar MRI. If the patient does not show an invasive tumor before surgery, but is predicted to be more likely to present an invasive phenotype by the lipidomic signature, we suggested that more comprehensive treatment strategies and closer follow-ups to monitor progression and recurrence should be applied in such a patient postoperatively.
The limitations of the study were as follows. Firstly, the lipidomic data were not normalized by the normal control due to lack of the control group form normal pituitaries. The mixture of normal tissues in tumor samples may potentially affect the results of the following differential analysis if the data were not normalized by normal controls. Secondly, the 4 critical lipids in the predictive model were not verified by serum samples of SCA patients, which would better facilitate predicting invasiveness of SCA patient in clinical applications.
In conclusion, we performed a UPLC-MS/MS-based lipidomic analysis of 54 SCA samples, and a total of 28 differential lipids were identified to be potentially associated with the invasiveness of SCAs. A multiomic functionally connected network was constructed with 2 lipids, 17 genes, and 4 KEGG pathways. CMap analysis further revealed 32 potential drugs targeting 4 genes and corresponding molecular pathways, especially the ACHE gene, and the mechanism of drugs acting as acetylcholinesterase inhibitors. Then, multiple ML methods revealed the 4 most critical lipids as risk factors contributing to the invasive phenotype of SCAs. Finally, a lipidomic signature for predicting invasive SCAs was constructed and showed excellent performance in discriminating invasive and noninvasive tumors. Hence, the lipidomic signature could serve as a useful tool for assisting physicians in predicting the invasive phenotype and providing novel therapeutic targets for invasive SCAs.
Abbreviations
- ACTH
adrenocorticotrophic hormone
- AUC
areas under the ROC curve
- BMI
body mass index
- CMap
Connectivity Map
- DEG
differentially expressed gene
- FC
fold change
- H&E
hematoxylin and eosin
- IHC
immunohistochemical
- MoA
mechanism of action
- ML
machine learning
- MRI
magnetic resonance imaging
- NFPA
nonfunctioning pituitary adenoma
- PA
phosphatidic acid
- PC
phosphatidylcholine
- PCA
principal component analysis
- PLS-DA
partial least squares discriminant analysis
- PI
phosphatidylinositol
- PS
phosphatidylserine
- PUMCH
Peking Union Medical College Hospital
- QC
quality control
- ROC
receiver operating characteristic
- SCA
silent corticotroph adenoma
- UPLC-MS
ultraperformance liquid chromatography mass spectrometry
- VIP
variable importance of the projection
Acknowledgments
Dr. Wang is grateful for the invaluable support received from his parents and from Prof. Bing Xing over the years.
Financial Support: This study was supported by the Chinese Academy of Medical Sciences (CAMS) Initiative for Innovative Medicine (CAMSI2M) 2017-I2M-1-001 and the Graduate Innovation Fund of the Chinese Academy of Medical Sciences and Peking Union Medical College (2019-1002-73).
Additional Information
Disclosure Statement: The authors have nothing to disclose.
Data Availability
The lipidomic dataset generated and analyzed during the current study is not publicly available but is available from the corresponding author upon reasonable request. The transcriptomic data analyzed during this study are included in the GEO database (GSE136781) (listed in References). The supplementary files are available at https://doi.org/10.6084/m9.figshare.12592517.v3.
References
