


Abstract
The natriuretic effect of glucagon-like peptide-1 (GLP-1) in humans is independent of changes in renal plasma flow (RPF) and glomerular filtration rate (GFR) but may involve suppression of angiotensin II (ANG II) and a significant (~45%) renal extraction of GLP-1. The current study was designed to investigate the consequences for the renal extraction and the natriuretic effect of blocking GLP-1 receptors with the specific GLP-1 receptor antagonist, Exendin 9–39 (Ex 9–39).
Under fixed sodium intake for 4 days before each study day, 6 healthy male participants were recruited from our recent study where GLP-1 or vehicle was infused (1). In the present new experiments, participants were examined during a 3-hour infusion of GLP-1 (1.5 pmol/kg/min) together with a 3.5-hour infusion of Ex 9–39 (900 pmol/kg/min). Timed urine collections were conducted throughout the experiments. Renal extraction of GLP-1 as well as RPF and GFR were measured via Fick’s principle after catheterization of a renal vein. Arterial plasma renin, ANG II, and aldosterone concentrations were measured.
Co-infusion of Ex 9–39 significantly reduced renal extraction of GLP-1 to ~25% compared with GLP-1 infusion alone (~45%). Urinary sodium excretions remained at baseline levels during co-infusion of Ex 9–39 as well as vehicle. By contrast, GLP-1 infusion alone resulted in a 2-fold increase in natriuresis. Ex 9–39 abolished the GLP-1-induced decrease in arterial ANG II concentrations. RPF and GFR remained unchanged during all experiments.
Renal extraction of GLP-1 and its effect on natriuresis are both dependent on GLP-1 receptor activation in healthy humans.
In human studies, native glucagon-like peptide-1 (GLP-1) as well as GLP-1 receptor agonists infused together with hypertonic and isotonic saline induced acute natriuresis in healthy participants (1-3) and in insulin-resistant obese participants (2), whereas in studies without addition of salt and water to the extracellular fluid there was no measurable effect (4, 5). It was concluded that the natriuretic effect of GLP-1 in humans is mediated by a tubular mechanism in distal nephron segments secondary to selective suppression of angiotensin II (ANG II) (1, 3). In contrast to rodents (6), the natriuretic response in humans was independent of changes in renal plasma flow (RPF) and glomerular filtration rate (GFR) (1, 3) and was not related to GLP-1-induced atrial natriuretic peptide (ANP) secretion (1). The mechanism by which GLP-1 reduces ANG II has not been investigated. One explanation may be a direct inhibition of ANG II production or accelerated conversion/degradation in tissues (1, 3).
Considering that native, intact GLP-1 in humans is subjected to a ~45% renal extraction (1, 4, 5) it is obvious that mechanisms beyond filtration, that would maximally account for ~20%, must be responsible. Among the possibilities are endothelial dipeptidyl peptidase-4 (DPP-4)-mediated degradation and specific receptor binding and elimination (receptor-mediated uptake) of GLP-1. In the current study, we reinvestigated our existing cohort of healthy volunteers in order to test—in an add-on protocol—the hypotheses that (i) the significant renal extraction of GLP-1, and (ii) the natriuretic effect of GLP-1, are mediated via activation and signaling of GLP-1 receptors.
Materials and Methods
Participants
The participants took part in a recent, reported study (1) and were invited to participate in the present, third intervention 17 ± 1.5 (standard error [SE]) months later. Six healthy, young, nonsmoking males agreed to participate. The anthropometric characteristics, body composition (dual-energy x-ray absorptiometry [DXA] scanning, Lunar iDXA; GE Healthcare, Brøndby, Denmark), and glucose profile are shown in Table 1. None of the subjects had a positive family history of diabetes. All had normal fasting blood concentrations of glucose, lipids, and hemoglobin and normal renal and hepatic functions. Consent to participate was obtained after the participant had read a description of the experimental protocol, which was approved by the Scientific Ethics Committee of the capital region of Copenhagen (H-15004454).
Baseline Characteristics From Day 3
| Variable | Value |
|---|---|
| Age (yr) | 28 ± 3 |
| Height (cm) | 179 ± 5 |
| Weight (kg) | 78.6 ± 12.6 |
| Lean body mass (kg) | 59.7 ± 6.4 |
| Whole body fat mass (kg) | 19.1 ± 7.4 |
| Systolic blood pressure (mm Hg) | 124 ± 10 |
| Diastolic blood pressure (mm Hg) | 82 ± 6 |
| Heart rate (bpm) | 71 ± 8 |
| Fasting glucose concentration (mmol/L) | 5.1 ± 0.2 |
| Fasting insulin concentration (pmol/L) | 68 ± 27 |
| Plasma creatinine (µmol/L) | 66 ± 10 |
The participants took part in a recent, reported study (Day 1 and 2) (1) and were invited to participate in the present add-on protocol (Day 3). Body composition was determined by dual-energy x-ray absorptiometry (DXA) scanning. Data are presented as means ± SD, n = 6.
Experimental design
The primary study protocol had a randomized, cross-over design with a washout period of at least 4 weeks. Each subject served as his own control and was at first studied on 2 different occasions (Fig. 1) during a 3-hour infusion of saline (vehicle, Day 1) or a 3-hour infusion of GLP-1 (1.5 pmol/kg/min) (Day 2). After this study was analyzed, we found it relevant to investigate the consequences for the renal extraction and the natriuretic effect of blocking the GLP-1 receptors with the specific GLP-1 receptor antagonist, Exendin 9–39 (Ex 9–39). We therefore invited participants to participate in the present intervention (Fig. 1). Six healthy, young, nonsmoking males agreed to participate and were studied (17 ± 1.5 [SE] months later) during a 3.5-hour infusion of Ex 9–39 (900 pmol/kg/min) together with a 3-hour infusion of GLP-1 (1.5 pmol/kg/min) (Day 3). The published data (1) from Day 1 and 2 are shown here for comparison with permission.
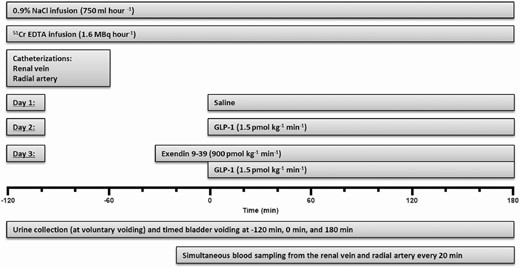
The experimental timeline. The participants took part in a recent, reported study (1) (Day 1 and 2) and were invited to participate in the present add-on protocol (Day 3). The published data (1) from Day 1 and 2 are shown here for comparison with permission. After emptying the bladder at time −120 minutes, participants remained supine throughout the experiments. Tap water (14 mL kg-1, maximum 1000 mL) was ingested from time −120 to −110 minutes.
Protocol
For 4 days before each experiment, all participants consumed a controlled mixed diet (2822 kcal per day; 16% protein, 55% carbohydrate, 29% fat). The food was handed out frozen, and the basal sodium chloride (NaCl) content of the diet, measured at Eurofins Stein’s Laboratory in Denmark, was 55 to 75 mmol per day. NaCl was added to the diet in order to standardize daily intake at 2 mmol NaCl per kg body weight per day. 24-hour urine was collected on the last day, and urinary electrolyte concentrations were determined. Water intake was ad libitum, and strenuous physical activity was not allowed. Participants were given 600 mg lithium orally at 09:00 pm the day before each experiment. Under fixed sodium intake, it is generally accepted that the renal clearance and extraction of lithium correspond to the fractional sodium reabsorption in the proximal tubules (7).
Participants fasted for 12 hours before the beginning of the experiments. The experimental setup is shown in Fig. 1. After emptying the bladder, confirmed by ultrasound, participants remained supine throughout the experiments and were given tap water (14 mL/kg, maximum 1000 mL) which was ingested within 10 minutes in order to keep participants in surplus of free water and thus suppress vasopressin at a constant low level. Meanwhile, a forearm vein was catheterized with an 18-gauge catheter (BD Venflon: 1.2 mm OD, length 45 mm, Becton Dickinson, Helsingborg, Sweden) for infusions. An intravenous infusion of 0.9% NaCl was administered (750 mL/hour for ~5 hours).
During the experiments, urine collection was achieved by voluntary voiding together with timed bladder emptying immediately prior to the commencement of infusions and right at the end of infusions. The total amount of urine collected during infusions was mixed and quantified. Bladder emptying was verified by ultrasound and any residual volumes were taken into account in subsequent calculations.
RPF and GFR were measured via Fick’s principle using chromium 51-labeled EDTA as indicator (51Cr-EDTA; GE Healthcare, Brøndby, Denmark). An intravenous bolus injection (2 MBq) in 10 mL of 0.9% NaCl was given followed by intravenous infusion (1.6 MBq/hour for ~5 hours) in 0.9% NaCl (30 mL/hour). Steady state arterial concentrations of 51Cr-EDTA were obtained after ~90 minutes. Meanwhile, the right femoral vein was catheterized, using the Seldinger technique and a 6F introducer (Avanti: 2.21 mm OD, length 110 mm, Cordis Corporation, Bridgewater, New Jersey, USA). A 6F catheter (Check-Flo Performer®: 0.97 mm OD, length 750 mm, Cook Medical, Bloomington, Indiana, USA) was advanced into the right or left renal vein under fluoroscopic control. Since the oxygen saturation of renal venous blood is much higher than that of mixed blood in the inferior caval vein (~90% vs ~75%), we were able to check and confirm the position of the catheter tip in the renal vein throughout the experiments by measurements of oxygen saturation. A radial artery was catheterized with a 20-gauge catheter (BD Arterial Cannula: 1.1 mm OD, length 45 mm, Becton Dickinson, Franklin Lakes, New Jersey, USA) for blood sampling. Blood was collected simultaneously from the radial artery and the renal vein throughout the experiments as described below. After approximately 2 hours of 51Cr-EDTA infusion, 2 baseline blood sample pairs were drawn followed by start of a 3-hour infusion of either vehicle (0.9% NaCl) or native GLP-1 (1.5 pmol/kg/min) (1) or a combination of a 3.5-hour infusion of Ex 9–39 (900 pmol/kg/min) started 30 minutes before a 3-hour infusion of GLP-1 (1.5 pmol/kg/min) (8). The solutions were prepared freshly. Participants were blinded with respect to the contents.
Materials for intravenous infusion
Synthetic human GLP-1 (7-36)amide was purchased from Bachem (Bubendorf, Switzerland) and demonstrated to be ≥97% pure and identical to the natural human peptide by high-performance liquid chromatography, mass, and sequence analysis. GLP-1 (7-36)amide was dissolved in saline, containing 0.5% human serum albumin (human albumin; CSL Behring, Marburg, Germany). Exendin 9–39 acetate salt was purchased as a lyophilized sterile powder at pharmaceutical grade from from Bachem (Bubendorf, Switzerland) and demonstrated to be ≥97% pure by high-performance liquid chromatography and to have the correct structure by mass and sequence analysis. Exendin 9–39 was dissolved in saline containing 0.5% human serum albumin. 51Cr-EDTA was purchased from GE Healthcare.
Blood and urine analyses
Samples of blood were drawn simultaneously from the radial artery and the renal vein every 20 minutes from time −20 minutes to 180 minutes (Fig. 1). All arterial as well as venous blood samples were analyzed for GLP-1, glucose, sodium, lithium, hydrogen, potassium, hematocrit, oxygen saturation, and 51Cr activity. Renin, ANG II, and aldosterone were analyzed only in arterial blood samples. The amount of collected blood was carefully substituted with a similar amount of isotonic saline during the experiments. Plasma samples were assayed for total GLP-1 immunoreactivity (ie, intact GLP-1 + the primary metabolite GLP-1 [9-36]amide) as previously described (9). Plasma electrolyte concentrations, glucose, hematocrit, and oxygen saturation were measured by an automated benchtop blood analyzer system (ABL 700 series, Radiometer Medical Aps, Brønshøj, Denmark). Plasma osmolality was measured directly by freezing point depression (Osmometer Model 3250; Advanced Instruments, Norwood, Massachusetts). Plasma lithium concentrations were measured by atomic absorption (Atomic absorption spectrophotometer model 2380, PerkinElmer, Norwalk, Connecticut). Plasma was analyzed for gamma radiation activity on a WIZARD3 1480 automatic gamma counter (PerkinElmer, Waltham, Massachusetts). Each sample (0.5 mL) was counted for 60 minutes (>10 000 counts). Plasma renin concentrations were measured by radioimmunoassay of ANG I through the antibody-trapping method of Poulsen and Jørgensen (10), using EDTA plasma (100 μL) incubated with plasma from a nephrectomized sheep for 3 hours. Inter-assay coefficient of variation was 15%. ANG II peptide hormone concentrations in plasma were measured by radioimmunoassay as described previously (11). Plasma aldosterone concentrations were measured, using a commercial enzyme immunoassay kit ELISA (MS E-5200, Labor Diagnostika Nord GmbH & Co. KG, Germany) as described by the manufacturer. Between-assay coefficient of variation was 10%. Urinary electrolyte and lithium concentrations were measured by atomic absorption (Atomic absorption spectrophotometer model 2380, PerkinElmer, Norwalk, Connecticut). Urinary pH was measured, using a XC161 Combination pH electrode (Radiometer Medical Aps, Brønshøj, Denmark). Urinary osmolality was measured directly by freezing point depression.
Calculations
Renal extraction of GLP-1 was calculated as: ([GLP-1]arterial – [GLP-1]renal venous)/[GLP-1]arterial at steady state.
Renal plasma flow was calculated as: 51Cr-EDTA infusion-rate/([51Cr-EDTA]arterial – [51Cr-EDTA]renal venous) at steady state.
Glomerular filtration rate was calculated as: renal plasma flow·([51Cr-EDTA]arterial – [51Cr-EDTA]renal venous)/[51Cr-EDTA]arterial at steady state.
Renal electrolyte clearance (Cx) was calculated as follows: Cx = Ux·Vu/Px, where Ux and Px are the concentrations of substance X in urine and plasma, respectively, and Vu is the urinary flow rate.
Renal free water clearance (CH2O) was calculated as follows: CH2O = Vu – Cosm, where Vu is the urinary flow rate, and Cosm is the osmolar clearance.
Statistical analysis
The primary endpoint in the present study was the urinary sodium excretion. When using a 2-tailed α = 0.05 and requiring an 80% power threshold, the sample size n = 6 was calculated to be required to detect an appreciable effect of exogenous GLP-1 on renal sodium excretion. This calculation was based on previous human experiments in which a 3-hour intravenous GLP-1 infusion increased natriuresis by about 2-fold (1).
Data were analyzed, using GraphPad Prism 8 (GraphPad Software, Inc., La Jolla, CA, USA). The area under the curve (AUC) was calculated, using the trapezoidal rule. A one-way analysis of variance (ANOVA) for repeated measures followed by a pairwise planned contrast analysis after Bonferroni correction was conducted to determine whether changes of the mean values of a variable in the 6 participants were statistically significant (P < 0.05) between the 3 study days; saline infusion (Day 1), GLP-1 infusion (Day 2), and Ex 9–39 and GLP co-infusions (Day 3). In addition, the Friedman Test was conducted as a nonparametric alternative to the 1-way ANOVA for repeated measures. The t test (2-tailed) for paired data was used for comparing renal extraction of GLP-1 between Day 2 and Day 3. Values of P < 0.05 were considered statistically significant. Normal distribution of the data was assured before the analyses, using the Shapiro-Wilk test.
Results
Standardized sodium chloride intake
All subjects completed the mixed diet for 4 days prior to the experiment and on the last day of the 4-day period with standardized sodium chloride intake, all 24-hour urine collections were completed successfully. In the third series, 24-hour urine variables were similar to previous series (Table 2).
24-Hour Urinary Excretions During Baseline
| 24-hour urine variable | Day 1 | Day 2 | Day 3 |
|---|---|---|---|
| Volume (mL) | 2364 ± 241 | 2618 ± 257 | 2420 ± 315 |
| Sodium (mmol) | 175 ± 16 | 189 ± 20 | 189 ± 21 |
| pH | 6.6 ± 0.2 | 6.9 ± 0.3 | 6.7 ± 0.3 |
| Potassium (mmol) | 58 ± 5 | 65 ± 5 | 66 ± 4 |
| 24-hour urine variable | Day 1 | Day 2 | Day 3 |
|---|---|---|---|
| Volume (mL) | 2364 ± 241 | 2618 ± 257 | 2420 ± 315 |
| Sodium (mmol) | 175 ± 16 | 189 ± 20 | 189 ± 21 |
| pH | 6.6 ± 0.2 | 6.9 ± 0.3 | 6.7 ± 0.3 |
| Potassium (mmol) | 58 ± 5 | 65 ± 5 | 66 ± 4 |
The participants took part in a recent, reported study (Day 1 and 2) (1) and were invited to participate in the present add-on protocol (Day 3). Data are presented as means ± SE. The published data (1) from Day 1 and 2 are shown here for comparison with permission. There were no statistically significant differences between the 3 study days for any of the 24-hour urine variables.
Arterial blood levels of glucose
During co-infusion of Ex 9–39 and GLP-1, arterial blood glucose levels did not change significantly over time (Fig. 2). During GLP-1 infusion, arterial blood glucose levels were significantly lower compared to the co-infusion of Ex 9–39 and compared to vehicle (Fig. 2). The arterial blood glucose levels during co-infusion of Ex 9–39 were not significantly different from levels during vehicle (Fig. 2).
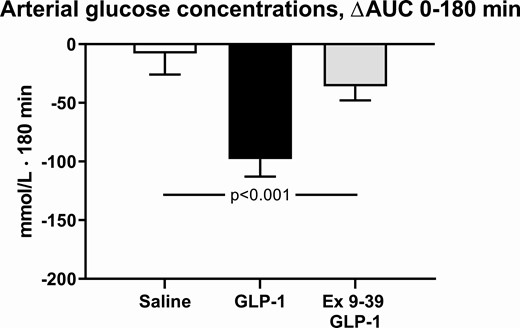
The integrated arterial blood glucose concentrations during infusions, from 0 to 180 minutes compared to baseline levels. The participants took part in a recent, reported study (1) and published data from this study during a 3-hour infusion of saline or a 3-hour infusion of GLP-1 are shown here for comparison with permission. A nonparametric alternative to the 1-way ANOVA for repeated measures was conducted, using the Friedman Test, leading to P = 0.006. Data are presented as means ± SE.
During GLP-1 infusion, arterial blood glucose levels reached a nadir of 4.05 ± 0.15 mmol/L at 40 minutes and a range of 3.65 to 5.65 mmol/L within the first 60 minutes (data not shown). None of the subjects developed symptoms of hypoglycemia.
Renal function and hemodynamics
During co-infusion of Ex 9–39 and GLP-1, mean urinary sodium and osmolar excretions remained at baseline levels similar to vehicle, whereas during GLP-1 infusion alone excretions increased 2-fold (Fig. 3A and 3B). The increase in urinary sodium excretion accounted for the observed increase in urinary osmolar excretion. Urinary flow rate tended to increase during GLP-1 infusion (Fig. 3C). Urinary pH and potassium excretion were not significantly different between the 3 study days (data not shown).
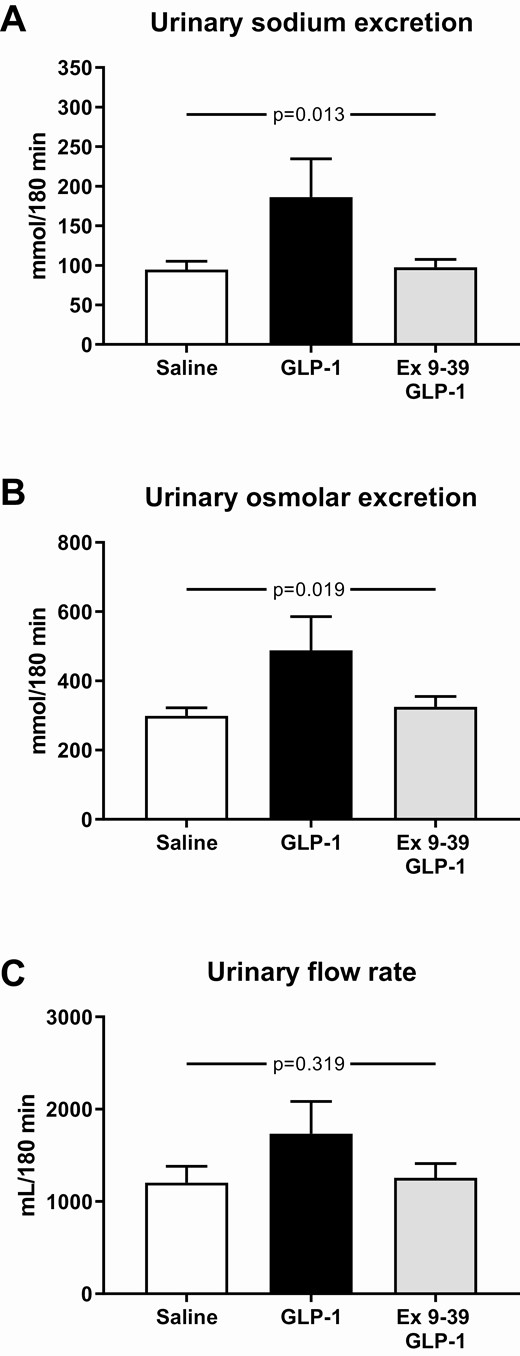
Mean urinary sodium excretion (A), urinary osmolar excretion (B), and urinary flow rate (C) during the infusions from 0 to 180 minutes. The participants took part in a recent, reported study (1) and published data from this study during a 3-hour infusion of saline or a 3-hour infusion of GLP-1 are shown here for comparison with permission. A nonparametric alternative to the 1-way ANOVA for repeated measures was conducted, using the Friedman Test, leading to P < 0.001 (urinary sodium excretion), P = 0.003 (urinary osmolar excretion), P = 0.908 (urinary flow rate). Data are presented as means ± SE.
Arterial and renal venous plasma concentrations of osmolytes, sodium, chloride, potassium, and hydrogen remained unchanged during the 3 study days (data not shown). Renal free water and lithium clearances were not significantly different between the 3 study days (data not shown).
Co-infusion of Ex 9–39 and GLP-1 had no effect on RPF (830 ± 69 mL/min) and GFR (130 ± 8 mL/min) over 180 minutes and values were not different from previous 2 days of examination. The filtration fraction was normal (~20%) (data not shown).
The renin-angiotensin-aldosterone system
During co-infusion of Ex 9–39 and GLP-1 with saline infusion, arterial plasma renin concentrations decreased, whereas aldosterone levels remained unchanged (Fig. 4A and 4C). The decrease in renin levels was similar on all 3 study days (Fig. 4A).
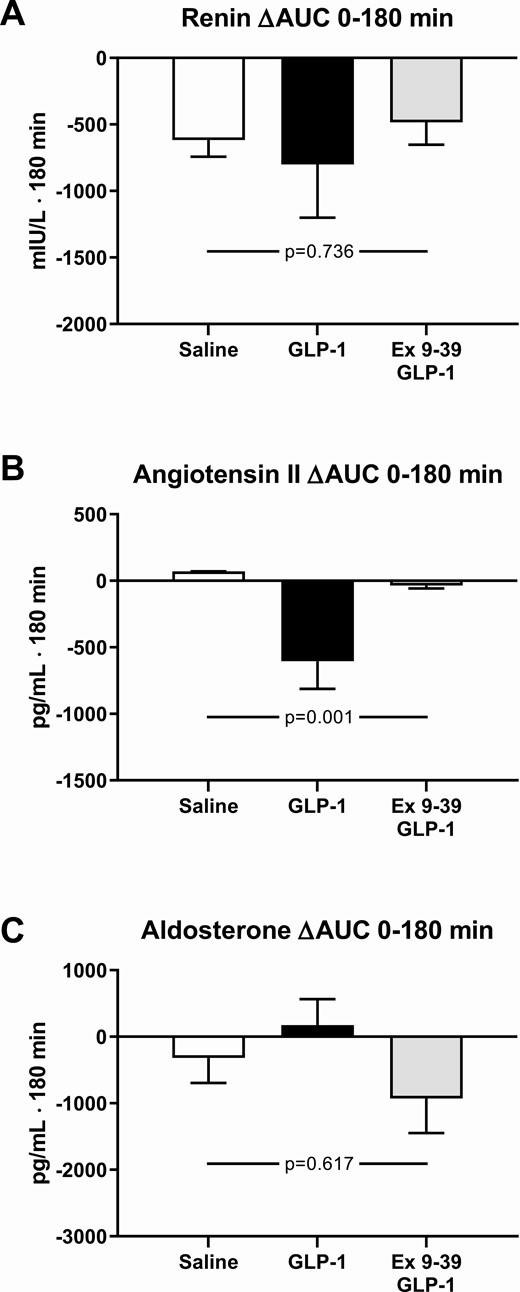
The integrated arterial plasma concentrations of renin (A), angiotensin II (B), and aldosterone (C) during infusions from 0 to 180 minutes compared to baseline levels. The participants took part in a recent, reported study (1) and published data from this study during a 3-hour infusion of saline or a 3-hour infusion of GLP-1 are shown here for comparison with permission. A nonparametric alternative to the 1-way ANOVA for repeated measures was conducted, using the Friedman Test, leading to P = 0.433 (renin), P = 0.001 (angiotensin II), P = 0.270 (aldosterone). Data are presented as means ± SE.
During co-infusion of Ex 9–39 and GLP-1 arterial plasma ANG II concentrations remained at baseline levels similar to vehicle, whereas during GLP-1 infusion alone ANG II levels decreased significantly by ~20% (Fig. 4B).
Arterial and renal venous plasma levels of GLP-1
Using a similar infusion rate of native GLP-1 as in our previous studies (1), arterial and renal venous plasma concentrations of total GLP-1 reached a steady state ~20 minutes after the commencement of GLP-1 infusion (averaging 142 ± 5 and 88 ± 2 pmol/L, respectively) as well as after the commencement of co-infusion of Ex 9–39 and GLP-1 (averaging 123 ± 3 and 87 ± 2 pmol/L, respectively). During vehicle, arterial and renal venous plasma concentrations of total GLP-1 remained constant and low throughout the experiments, at 10 ± 1 and 11 ± 1 pmol/L, respectively.
During co-infusion of Ex 9–39 and GLP-1, renal extraction of GLP-1 was reduced significantly to ~25% (roughly corresponding to the loss by glomerular filtration) compared with GLP-1 infusion alone (~45%) (Fig. 5). During vehicle, a significant renal extraction of GLP-1 could not be demonstrated, probably because of low concentrations (data not shown).
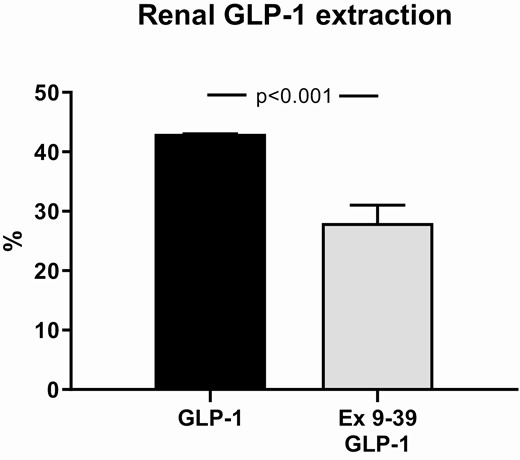
Renal extraction of GLP-1 during infusions calculated using steady state concentrations. The participants took part in a recent, reported study (1) and published data from this study during a 3-hour infusion of GLP-1 are shown here for comparison with permission. Data are presented as means ± SE.
Discussion
The present study showed that the natriuretic effect of GLP-1 during an extracellular fluid volume (ECV) expansion was abolished by the GLP-1 receptor antagonist Exendin 9–39 (Ex 9–39), suggesting that GLP-1-induced natriuresis is dependent on GLP-1 receptor activation. Plasma concentrations of ANG II did not change during co-infusion of Ex 9–39 and GLP-1 in contrast to a significant decrease in ANG II levels during GLP-1 infusion alone which supports the notion that the GLP-1-mediated natriuretic effect is coupled to suppressed ANG II (1, 3). Since natriuresis was independent of changes in total RPF as well as GFR, a direct tubular mechanism in distal nephron segments related to suppression of ANG II is likely. In addition, almost all of the renal GLP-1 extraction that exceeded filtered GLP-1 depended on GLP-1 receptor binding, probably via receptor-mediated endocytosis.
In contrast to the present study, previous studies of healthy participants (4) and patients with type 2 diabetes (5) could not demonstrate a natriuretic effect, when GLP-1 was administered without expansion of ECV. During expansion of ECV, the natriuretic effect of GLP-1 was not associated with increased flow out of the proximal tubule as assessed by lithium clearance and also not by increased urinary flow, hydrogen excretion, and free water clearance. Although indirect, these data point to a natriuretic effect of GLP-1 that does not primarily involve inhibition of proximal sodium–hydrogen exchanger 3 (NHE3) activity but rather an effect mediated by more distal nephron segments. This interpretation is supported by decreased circulating ANG II levels during the GLP-1-induced natriuresis.
The expansion of ECV with isotonic saline infusions (750 mL/hour) during all 3 study days reduced plasma renin levels to a similar extent. We therefore find it interesting that ANG II was reduced only during GLP-1 infusion. The mechanism by which GLP-1 reduces ANG II has not been shown. One explanation may be a direct inhibition of ACE-mediated ANG II synthesis or accelerated conversion/degradation in tissues (12). GLP-1 infusion studies with clamped ANG II levels should clarify whether GLP-1-induced natriuresis depends on ANG II suppression or an unrelated epiphenomenon. The present data would be compatible with GLP-1 acting at several potential sites that influence ANG II levels, eg, suppression of angiotensinogen availability and/or ACE-1 activity, or even by increased activity of ACE-2 and neprilysin with enhanced metabolism and clearance of ANG II.
One reason for the uncoupling between the GLP-1-induced ANG II suppression and unchanged aldosterone concentrations could be the kinetics. The experiment was short term, and whereas ANG II peptide has a rapid turnover, aldosterone simply has slower rates of secretion and degradation. Secondly, aldosterone is controlled by other factors than ANG II, such as adrenocorticotropic hormone, potassium, vascular endothelial growth factor, and glomerulosa cell membrane potential that controls calcium influx. Independent changes in these factors could oppose the effect of a decrease in ANG II signal to the glomerulosa cells. Finally, we cannot rule out that GLP-1 has direct effects on aldosterone release, although in vitro experiments have not been unequivocal (13).
In contrast to rodents (6), the twofold natriuretic effect induced in the current study was independent of measurable changes in proANP and ANP as well as brain natriuretic peptide (1). This is in line with previous studies, thus supporting that a functional GLP-1-ANP axis probably does not exist in humans (4, 5, 14).
GLP-1 receptor expression has been demonstrated in the smooth muscle cells of the preglomerular vasculature, whereas expression was undetectable in the macula densa, tubuli, glomeruli, and endothelial cells within afferent arterioles, although data from human kidney are very limited (15, 16). GLP-1 receptor activation leads to cAMP formation and activation of downstream pathways coupled to protein kinase A (17, 18), which would be expected to lead to vasodilation. It was recently demonstrated that GLP-1 has a vasodilatory effect in adipose tissue and skeletal muscle (19). In contrast to human studies, GLP-1 leads to preglomerular vasodilation in rodents, in turn leading to dose-dependent increases in RPF and GFR as well as natriuresis (20, 21). Differences between species may obviously contribute to explain these discrepancies; however, in the animal experiments, GLP-1 levels have been increased ~100-fold to observe vascular effects which are beyond physiological responses, as opposed to the slightly supraphysiological levels investigated in humans (21).
Nevertheless, another recent study in humans showed, in agreement with the effects of high GLP-1 levels in animal studies and in contrast to the effects of physiological GLP-1 levels in humans, that GLP-1 receptor agonists—under pharmacological concentrations—did increase RPF and GFR in overweight and otherwise healthy participants, pointing to preglomerular vasodilation that was partially NO-dependent together with an independent natriuretic effect (22). This preglomerular vasodilatory effect was absent in patients with type 2 diabetes, perhaps associated with impaired vascular function and/or downregulation of the GLP-1 receptor, whereas the natriuretic effect remained (23). Our data did not uncover any effect on RPF and GFR by blocking the GLP-1 receptor. Altogether, these findings indicate that the renal hemodynamic effects of GLP-1 are dose-dependent and that the hemodynamic and natriuretic effects involve different mechanisms.
The renal extraction of GLP-1 by ~45% during GLP-1 infusion clearly exceeds what can be explained by glomerular filtration in line with previous human studies with healthy participants (4) and patients with type 2 diabetes without nephropathy (5). In this context, it is of interest that marked expression of the GLP-1 receptor has been localized to the renal afferent arterioles, and binding to these with subsequent internalization could be responsible for the additional extraction. This is supported by the current study, demonstrating significantly reduced extraction to ~25% sufficient to account for what can be explained by glomerular filtration, when the GLP-1 receptor was successfully antagonized. This is in line with native GLP-1 being freely filtered in the glomerulus. Effects of the GLP-1-degrading enzyme DPP-4 in the renal vasculature cannot explain the arterial and renal venous concentration difference, because total GLP-1 concentrations are not affected by DPP-4 degradation.
Taken together, the current study demonstrates that GLP-1-dependent ANG II suppression, natriuretic effect, and high renal extraction all depend specifically and fully on GLP-1 receptor activation independent of changes in total RPF and GFR.
Abbreviations
- ACE
angiotensin-converting enzyme
- ANG II
angiotensin II
- ANP
atrial natriuretic peptide
- DPP-4
dipeptidyl peptidase-4
- ECV
extracellular fluid volume
- Ex 9–39
exendin 9–39
- GFR
glomerular filtration rate
- GLP-1
glucagon-like peptide-1
- RPF
renal plasma flow
Acknowledgments
The excellent technical support by technicians Bente Matthiessen (Bispebjerg Hospital, University Hospital of Copenhagen), MA Marquès (I2MC Toulouse), Lene Albæk, Kristoffer Racz, and Ninna Buch Petersen (Department of Biomedical Sciences, University of Copenhagen) and Susanne Hansen and Gitte Kitlen (Department of Cardiovascular and Renal Research, University of Southern Denmark) is gratefully acknowledged.
Financial Support: This study was supported financially by The Board of Research of Bispebjerg University Hospital, The Dagmar Marshalls Foundation, The Danish Heart Foundation, The Arvid Nilssons Foundation, and the Novo Nordisk Foundation.
Additional Information
Disclosure Summary: A.A., J.J.H., and S.M. consulted for Novo Nordisk. No conflicts of interest, financial or otherwise, are declared by the authors.
Data Availability
All data generated or analyzed during this study are included in this published article or in the data repositories listed in References.
References
