


Abstract
Quality of life (QoL) continues to be impaired in acromegaly after treatment.
We conducted the first nationwide survey assessing QoL status among Chinese patients with treated acromegaly and explored correlations with clinical parameters, treatment modalities, and outcomes.
Cross-sectional study.
Survey via Chinese Association of Patients with Acromegaly (CAPA) online platform.
Treated patients from CAPA.
QoL was assessed using acromegaly QoL questionnaire (AcroQoL), 5-level EuroQoL five-dimensional questionnaire (EQ-5D-5L), and 12-item short-form health survey questionnaire (SF-12).
Complete, valid questionnaires from 327 patients (mean age: 39.2 years, 61.5% females) at a mean of 10 years after treatment were included. Biochemical control was satisfied in 52.9% of these patients. The controlled patients had significantly better QoL than the uncontrolled patients in all AcroQoL dimensions, most SF-12 dimensions, and pain/discomfort and anxiety/depression dimensions of the EQ-5D-5L. Patients with either controlled or uncontrolled acromegaly had significantly worse QoL than the age- and sex-adjusted population reference in most SF-12 dimensions except for physical functioning. More acromegaly-associated symptoms and comorbidities at follow-up were independent risk factors for decreased QoL across all questionnaires. Medical treatment, especially with somatostatin analogs (SSAs), and radiotherapy were predictors of worse QoL. Female patients had lower scores of physical-related QoL than male patients.
Our study suggests that biochemical control improved but did not normalize QoL in acromegaly. Numbers of symptoms and comorbidities at follow-up, sex, radiotherapy, and medical treatment with SSAs were factors determining QoL of patients with treated acromegaly.
Acromegaly is a rare chronic endocrine disease caused by excessive growth hormone (GH) and insulin-like growth factor 1 (IGF-1), predominantly associated (>95%) with a GH-secreting pituitary adenoma (1). Prolonged exposure to excessive serum hormones leads to a series of clinical symptoms, including facial appearance changes, extremity enlargement, headache, and visual defects, and a variety of systemic comorbidities, e.g., cardiomyopathy, sleep apnea, pulmonary diseases, skeletal deformities, diabetes mellitus, and mental and psychological changes (2, 3). The above problems severely influence patient well-being, daily work, and social activities and in turn undermine quality of life (QoL) (3, 4). In addition to reflecting the disease and treatment effects, QoL is affected by patients’ concerns, life goals, expectations, cultural context, social connections, and daily events (5). Therefore, the assessment of QoL, performed through questionnaires answered by the patients themselves, or the so-called patient-centered survey, is of great clinical significance because it aids physicians in uncovering how the patient feels, functions, and responds in their life, apart from the objective professional recognition and view of the disease.
Improving QoL is one of the 3 goals of patient-related health outcomes addressed by the World Health Organization (6). After successful treatment, e.g., surgery, medical treatment, or radiotherapy, the levels of GH and IGF-1 decrease, and patient symptoms and comorbidities improve (2). Meanwhile, the impaired QoL also improves but rarely recovers to normal, even in patients with biochemically controlled acromegaly (7-10). Other studies have even demonstrated no QoL improvements in controlled patients (11-13). Regarding the effects of hormone reductions on improvements in QoL, one study demonstrated that GH nadir values after oral glucose tolerance test between 0.3 and 1.0 ng/mL and a normal IGF-1 were correlated with a better QoL (14), while other studies revealed no correlations between hormone reductions and QoL improvements (12, 13, 15). A recent meta-analysis concluded that published data were insufficient to conclude beneficial effects of biochemical control on the QoL of patients with acromegaly (16). Treatment modality also affects QoL in acromegaly. Radiotherapy was recognized as an important predictor of QoL impairment (13, 14, 17). Tseng et al (18) indicated that somatostatin analog (SSA) treatment was negatively correlated with QoL scores, while Coopmans et al (15) concluded that pasireotide long-acting release (LAR), alone or in combination with pegvisomant, improved QoL. Therefore, despite investigations on posttreatment QoL improvements and their clinical determinants in the literature, no satisfactory consensus has been reached. Since the majority of published studies have relatively small samples due to the rarity of acromegaly, which significantly increases the chance of generating false negatives and biases, studies with larger sample sizes are needed to verify and deepen the existing results.
To date, QoL studies on Asian patients with acromegaly have been far from sufficient. Existing acromegaly-associated QoL studies are mostly from European countries, with only a minor proportion from Asian countries, such as Korea (19) and Japan (20, 21), and regions such as Taiwan, China (11, 18). Since China occupies most of the territory of Southeast Asia and is the country with the highest Asian population, we proposed that a nationwide QoL survey of Chinese patients with acromegaly can largely reflect the outcomes of patients in Asia, especially Southeast Asia, and add support to an understanding of QoL. Unfortunately, however, there has been no systematic study on the QoL of patients with acromegaly in mainland China to date, and the recognition, diagnosis and management of acromegaly-associated QoL in our nation still refers to studies published from Western countries, the conclusions of which might not be completely generalizable to Chinese patients. The Chinese Association of Patients with Acromegaly (CAPA) is a nonprofit organization established by patients with treated acromegaly and their families from all over the nation. It was founded in 2012 and currently has over 600 registered members. In this context, the current study was designed to launch a QoL survey via the CAPA network platform. Compared with single-center surveys that may involve selection biases and fail to enroll enough participants with rare diseases, nationwide surveys are more capable of providing a better basis for further generalization of the study findings and obtaining a sufficient number of subjects to satisfy the study aims. In addition, this study selected both a disease-specific questionnaire, the acromegaly quality of life questionnaire (AcroQoL) (22), and generic questionnaires, the 12-item short-form health survey (SF-12) (23) and the 5-level EuroQoL 5-dimensional questionnaire (EQ-5D-5L) (24), for a more comprehensive QoL assessment from multiple angles.
Therefore, we conducted a nationwide QoL survey with 327 patients with treated acromegaly, the largest sample size in the literature, with an average follow-up period of 10 years, for the first time in mainland China to understand QoL status after treatment in Chinese patients with acromegaly. We compared the QoL scores of patients with controlled and uncontrolled acromegaly to explore the effects of biochemical remission on improvements in QoL. We also analyzed the QoL differences between patients with treated acromegaly and the age- and sex-adjusted Chinese reference population to answer the question of whether acromegaly-associated QoL could recover after successful treatment and to assess the importance of endocrine remission to QoL. Additionally, we collected detailed clinical information of patients, including acromegaly-associated symptoms and comorbidities, treatment modalities, therapeutic outcomes, and follow-up results, and performed correlation analyses and regression analyses to attempt to find the determinants of QoL and provide theoretical bases for long-term comprehensive clinical care for patients with treated acromegaly.
Materials and Methods
Patients and ethical approval
Patients with treated acromegaly, aged 18 and older, from CAPA were enrolled in this study. The diagnostic criteria of acromegaly in our country were in accordance with the Endocrine Society Clinical Practice Guideline (25). In China, the primary therapy for patients with untreated, active acromegaly is surgery, mostly through endoscopic or microscopic transsphenoidal approaches. Craniotomy is used for giant and severely aggressive adenomas. Repeated surgery is selected in patients with resectable recurrent or residual tumors. Medical treatment with SSAs, including octreotide-LAR and lanreotide, or with a dopamine agonist (DA) is appropriate after failed surgery, after radiotherapy and before the onset of its hormone-lowering related benefits, before surgery to improve comorbidities that contraindicate surgery, or as the first-line therapy in those with a low probability of surgical remission. Radiotherapy, the second-line therapy, is a candidate only for patients without proper tumor growth control or hormone normalization after surgery and medical treatment. The above principles of management for patients with acromegaly in China are consistent with international guidelines (25, 26). All patients were required to return to the hospital and complete routine follow-up. The frequencies of follow-up can be 3 months, 6 months, or 1 year, depending on the particular medical center. The criteria for cure of acromegaly are consistent with the guidelines (27).
The institutional review board of the Chinese University of Hong Kong and the Ethical Committee of Peking Union Medical College Hospital approved the study protocol and the informed consent form (reference numbers: SBRE-18–268 and SK-814). All participants signed an electronic consent before entering the study.
Nationwide online survey and study design
The survey collected 2 types of information: clinical characteristics and QoL scores. Clinical characteristics included patient demographic information, consisting of sex, age, height, weight, body mass index, and levels of GH and IGF-1, acromegaly-associated symptoms and comorbidities, treatment modality, and the latest follow-up results. The absolute IGF-1 values were then related to the age- and sex-adjusted normal ranges of healthy Chinese populations (28) and converted to the IGF-1 percentage of upper limit of the normal range (IGF-1%ULN). In this survey, the number of symptoms and comorbidities at follow-up were quantified. Patients’ most common symptoms and comorbidities were investigated in advance of the questionnaire survey. Subsequently, the expert group discussed and summarized 24 symptoms and 53 comorbidities and created a table for patients to directly check during the survey (29).
The authors applied for the right to use each of the QoL questionnaires in this survey from the developer/copyright holder.
This survey was part of the 2019 China Rare Disease Survey. It was led by the China Alliance of Rare Diseases, cosponsored by Peking Union Medical College Hospital, coordinated by the Illness Challenge Foundation, and implemented by the JC School of Public Health and Primary Care of the Chinese University of Hong Kong. The survey procedure, implementation, and quality control were designed, monitored, and reviewed by the survey committee, which was composed of senior medical specialists in the field of acromegaly, leaders of CAPA, and our research team. The final survey questionnaire underwent 3 rounds of preinvestigation before its official release, and the number of participants in each preinvestigation was more than 10.
The survey questionnaires were finally distributed on December 17, 2019, via the CAPA network platform, and by January 6, 2020, a total of 474 valid questionnaires had been retrieved, of which 442 were completed by patients themselves and 32 by their families, accounting for approximately 80% of CAPA members. Of the valid questionnaires completed by the patients, data from 327 respondents with complete clinical information and QoL scores were finally included in this analysis.
Questionnaires used for QoL measurement
AcroQoL.
The AcroQoL (22) is the only available disease-specific questionnaire to measure QoL outcomes in patients with acromegaly. It contains 22 questions and is divided into physical and psychological aspects. The psychological scale is further subdivided into appearance and personal relation subscales. Five possible answers are given for each question, and final scores were converted to a scale of 0 to 100. Higher scores represent better QoL.
SF-12.
The SF-12 (23) is a generic QoL questionnaire that consists of 12 items that can be divided into 8 domains: physical functioning (PF), role limitations due to physical problems (RP), bodily pain (BP), general health perceptions (GHP), vitality, social functioning (SF), role limitations due to emotional problems (RE), and general mental health (GMH). The scores for the physical and mental composite summaries (PCS and MCS) were subsequently calculated based on the above domains. The scores in each domain could range from 0 to 100, and higher scores indicated better QoL.
EQ-5D-5L.
The EQ-5D (30) was developed by the EuroQoL group and consists of 5 dimensions: mobility, self-care, usual activities, pain/discomfort, and anxiety/depression. Each dimension on the EQ-5D-5L has 5 possible answers: no problem, slight problems, moderate problems, severe problems, and extreme problems. The answer “no problem” was recognized as the best response, while “extreme problems” was recognized as the worst. We also converted the raw data from patients into standard scores using the MULT8r algorithm (24). The lower the standard score was, the better the QoL. In addition, the EQ-5D provides a calibrated visual analog scale (VAS) for an overall health evaluation, starting from 0 (worst health imagined) to 100 (best health imagined).
Statistical analysis
SPSS version 26.0 (IBM, USA) was used to analyze the data, and Prism 8.4.3 (GraphPad Software, USA) was used to generate graphs. Categorical variables are shown as numbers and proportions. Comparisons of categorical variables were analyzed using the chi-squared test. Continuous variables are presented as the mean ± standard deviation or median plus interquartile range (25th and 75th percentiles), according to the distribution of data that was tested by Levene’s test. Nonpaired t tests were used to assess the differences between normally distributed continuous variables, and Mann-Whitney U tests were used with variables that failed the normality test. The false discovery rate (FDR) algorithm was used for multiple comparisons to control the chance of generating unwanted false positives. Bivariate logistic regression was performed to explore independent factors that predicted better/lower QoL. Statistical significance was defined as P < 0.05. Cronbach’s alpha was calculated to assess the internal consistency of the questionnaires and was 0.924, reflecting good reliability.
Results
Clinical characteristics and follow-up information of the patients
The data of 327 patients with treated acromegaly, 201 females and 126 males, with a mean age of 39.2 ± 9.5 years, from 29 of 31 provinces of mainland China, the Hong Kong Special Administrative Region, and the Macao Special Administrative Region were collected. A summary of the patient clinical characteristics and follow-up information is listed in Table 1. All patients had received treatment for acromegaly: 265 patients (81.0%) had surgery, mostly through the transsphenoidal approach, 160 (48.9%) underwent medical treatment, mostly with SSAs, and 110 (33.6%) were treated with radiotherapy.
Clinical Characteristics, Treatment Modality and Follow-Up Information of Patients With Treated Acromegaly in the Survey
| Patients with treated acromegaly | |
|---|---|
| Age, years | 39.2 ± 9.5 |
| Male, n/% | 126 / 38.5% |
| Body mass index, kg/m2 | 26.6 ± 7.2 |
| GH level at diagnosis, ng/mL | 17.0 (7.2, 40.0) |
| IGF-1 level at diagnosis, ng/mL | 628.0 (415.0, 845.0) |
| IGF-1%ULN at diagnosis, % | 210.9 ± 105.9 |
| Treated with surgery, n/% | 265 / 81.0% |
| Transsphenoidal endoscopic, n/% | 131 / 40.1% |
| Transsphenoidal microscopic, n/% | 122 / 37.3% |
| Transcranial, n/% | 12 / 3.7% |
| Treated with medical treatment, n/% | 160 / 48.9% |
| Somatostatin analog, n/% | 139 / 42.5% |
| Dopamine agonist, n/% | 70 / 21.4% |
| Both above medications, n/% | 49 / 15.0% |
| Treated with radiotherapy, n/% | 110 / 33.6% |
| Total follow-up time, years | 10.0 ± 6.2 |
| Biochemical control, n/% | 173 / 52.9% |
| Number of symptoms at follow-up, n | 6, (4, 10) |
| Number of comorbidities at follow-up, n | 4 (1.5, 7) |
| GH level at follow-up, ng/mL | 1.0 (0.4, 1.9) |
| IGF-1 level at follow-up, ng/mL | 217.0 (140.0, 319.0) |
| IGF-1%ULN at follow-up, % | 42.3 ± 3.3 |
Continuous variables are presented as means ± standard deviations if normally distributed or medians (25th and 75th quartile) if not normally distributed.
Abbreviations: GH, growth hormone; IGF-1, insulin-like growth factor 1; ULN, upper limit of the normal range.
The mean follow-up time from the initial treatment to this survey was 10.0 ± 6.2 years. At the last follow-up, the patients’ median number of symptoms was 6 (4, 10), and the median number of comorbidities was 4 (1.5, 7). The median values for GH and IGF-1 levels at baseline were 17.0 ng/mL and 628.0 ng/mL, which were significantly lower at follow-up, namely, 1.0 ng/mL and 217.0 ng/mL (both P < 0.001). The IGF-1%ULN also decreased significantly at the follow-up assessment compared with the value before treatment (210.9 ± 105.9 vs 42.3 ± 3.3; P < 0.001). At the last follow-up, 173 patients (52.9%) had received biochemical control, while the others (47.1%) remained uncontrolled/active. Compared with the controlled patients, the uncontrolled patients had higher median levels of GH (2.0 vs 0.4 ng/mL) and IGF-1 (285.0 vs 167.0 ng/mL), higher IGF-1%ULN (mean, 93.9 vs 58.5), and more symptoms (median, 7 vs 5) at follow-up (all P < 0.001). In addition, the uncontrolled group had a larger percentage of patients receiving transcranial surgery (5.8% vs 1.7%); medical treatment (55.8% vs 42.8%), especially SSAs (51.3% vs 34.7%); and radiotherapy (41.6% vs 26.6%) than the controlled group (all P < 0.05).
QoL in patients with controlled/uncontrolled acromegaly (Table 2)
AcroQoL scores
The mean global AcroQoL score was 44.1, with similar physical (45.2 ± 26.0) and psychological (43.5 ± 22.7) scores among all treated patients. Among the psychological aspects, the appearance score was the lowest, and the personal relation score was the highest (36.7 ± 21.6 vs 44.1 ± 22.9; P < 0.001). Biochemically controlled patients had higher scores in all AcroQoL dimensions than the uncontrolled patients (all P < 0.05).
Quality of Life (QoL) in Patients With Biochemically Controlled or Uncontrolled Acromegaly
| Total patients (N = 327) | Controlled patients (N = 173) | Uncontrolled patients (N = 154) | P value | |
|---|---|---|---|---|
| AcroQoL scores | ||||
| Global score | 44.1 ± 22.9 | 47.3 ± 22.5 ↑ | 40.5 ± 22.9 | 0.008 |
| Physical | 45.2 ± 26.0 | 48.7 ± 26.1 ↑ | 41.3 ± 25.5 | 0.010 |
| Psychological | 43.5 ± 22.7 | 46.4 ± 22.2 ↑ | 40.1 ± 22.9 | 0.012 |
| Appearance | 36.7 ± 21.6 | 39.3 ± 21.3 ↑ | 33.9 ± 21.5 | 0.023 |
| Personal relationships | 50.2 ± 26.9 | 53.6 ± 26.5 ↑ | 46.3 ± 26.9 | 0.015 |
| SF-12 scores | ||||
| Physical composite summary | 41.3 ± 8.4 | 42.9 ± 7.7 ↑ | 39.6 ± 8.8 | <0.001 |
| Physical functioning | 49.7 ± 8.6 | 50.4 ± 8.0 | 49.1 ± 9.3 | 0.170 |
| Role limitations due to physical problems | 42.8 ± 11.2 | 44.4 ± 10.7 ↑ | 40.9 ± 11.4 | 0.004 |
| Bodily pain | 39.9 ± 11.8 | 42.7 ± 11.2 ↑ | 36.7 ± 11.7 | <0.001 |
| General health perceptions | 33.0 ± 10.4 | 33.9 ± 10.0 | 32.0 ± 10.7 | 0.084 |
| Mental composite summary | 40.4 ± 8.0 | 41.8 ± 7.6 ↑ | 38.9 ± 8.0 | 0.001 |
| Vitality | 46.7 ± 10.8 | 48.4 ± 10.8 ↑ | 44.7 ± 10.6 | 0.002 |
| Role limitations due to emotional problems | 37.0 ± 12.7 | 38.6 ± 12.3 ↑ | 35.1 ± 12.8 | 0.012 |
| Social functioning | 40.1 ± 11.9 | 41.6 ± 11.5 ↑ | 38.3 ± 12.1 | 0.012 |
| General mental health | 38.0 ± 6.1 | 38.6 ± 6.5 ↑ | 37.2 ± 5.6 | 0.033 |
| EQ-5D-5L VAS and scores | ||||
| VAS of EQ-5D | 65.0 ± 20.6 | 66.9 ± 19.5 | 62.8 ± 21.6 | 0.073 |
| Mobility | 0.013/0.000/85.3% | 0.009/0.000/88.4% | 0.018/0.000/81.8% | 0.057 |
| Self-care | 0.003/0.000/94.8% | 0.003/0.000/95.4% | 0.003/0.000/94.2% | 0.886 |
| Usual activities | 0.006/0.000/87.8% | 0.005/0.000/90.2% | 0.070/0.000/85.1% | 0.387 |
| Pain/discomfort | 0.081/0.058/25.1% | 0.059/0.058 ↓ / 36.4% ↑ | 0.106/0.058/12.3% | <0.001 |
| Anxiety/depression | 0.076/0.049/17.4% | 0.064/0.049 ↓ / 23.1% ↑ | 0.089/0.049/11.0% | <0.001 |
P values indicate the differences of QoL scores between controlled patients and uncontrolled patients.
The scores of the 5 dimensions of the EQ-5D-5L are displayed as means (with 3 decimals), medians (with 3 decimals), and percentages of patients checking “no problems.” ↑ and ↓ indicate the trends of QoL scores and percentages of “no problems” in the controlled patients in comparison to the uncontrolled patients.
Abbreviations: AcroQoL, acromegaly quality of life questionnaire; EQ-5D-5L, 5-level EuroQoL 5-dimensional questionnaire; SF-12, 12-item short-form health survey questionnaire.
SF-12 scores.
The PCS (41.3 ± 8.4) and MCS (40.4 ± 8.0) were similar among patients. Among the physical component scores, GHP scored the lowest, while PF scored the highest (33.0 ± 10.4 vs 49.7 ± 8.6; P < 0.001). Among the mental component scores, RE scored the lowest, while vitality scored the highest (37.0 ± 12.7 vs 46.7 ± 10.8; P < 0.001). Compared to the patients with uncontrolled acromegaly, controlled patients had better scores on the PCS, the MCS, all dimensions of the SF-12 mental component, and 2 dimensions of SF-12 physical component (all P < 0.05), with the exceptions of PF (P = 0.170) and GHP (P = 0.084).
EQ-5D-5L scores.
The numbers of patients checking “no problem” on the mobility, self-care, usual activity, pain/discomfort, and anxiety/depression scales were 279 (85.3%), 310 (94.8%), 287 (87.8%), 82 (25.1%), and 57 (17.4%), respectively, and the numbers checking “moderate-severe-extreme problems” were 9 (2.8%), 1 (0.3%), 2 (0.6%), 102 (31.2%), and 116 (35.5%). More controlled patients than uncontrolled patients checked “no problem” on the pain/discomfort scale (36.4% vs 12.3%; P < 0.001) and the anxiety/depression scale (23.1% vs 11.0%; P = 0.004). In terms of MULT8r-converted scores, the controlled patients had lower scores on the pain/discomfort scale (P < 0.001) and anxiety/depression scale (P < 0.001), indicating better QoL, than the uncontrolled patients. The mean EQ-5D-VAS score was 65.0 ± 20.6 among all patients, and the controlled patients had a slightly higher, but not significantly different, VAS score than the uncontrolled patients (66.9 ± 19.5 vs 62.8 ± 21.6; P = 0.073).
QoL of the treated patients with acromegaly in comparison with the reference population
We used the SF-12 data of the Chinese general population from the China General Social Survey of 2010 (CGSS 2010) (http://cgss.ruc.edu.cn/index.php?r=index/sample), available to be freely downloaded on the website of East Asian Social Survey (http://www.eassda.org/modules/doc/index.php?doc=non_01_03&___M_ID=97), as the general population reference. Comparisons of QoL between treated patients and the age- and sex-adjusted reference (patients vs population, 327:654) are illustrated in Fig. 1. Both controlled and uncontrolled patients, with the exception of PF scores (P = 0.821 and P = 0.154), scored all the other SF-12 domains markedly lower than the population (all P < 0.001).
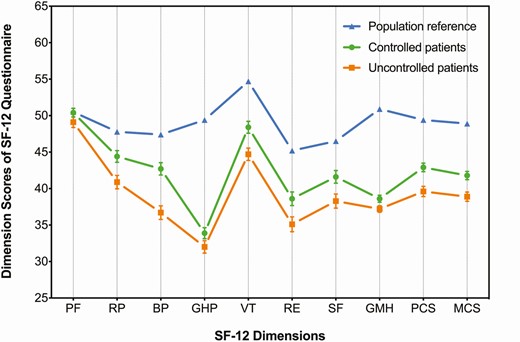
Quality of life (QoL) of the treated patients with biochemically controlled or uncontrolled acromegaly in comparison to the age- and sex-adjusted Chinese general population assessed by the SF-12. Legend: The mean scores of the reference (blue triangles) and the mean scores plus standard errors of the controlled (green dots) and uncontrolled (orange cubes) patients are shown on the graph. Both controlled and uncontrolled patients had statistically significant differences in QoL scores compared to the reference at P < 0.001 on every dimension of the SF-12 questionnaire, except for the PF dimension (P = 0.821 for the controlled patients vs reference; P = 0.154 for the uncontrolled patients vs reference).
Determinants of QoL in Chinese patients with treated acromegaly
The median dimension scores of QoL, including the AcroQoL, SF-12 physical component, SF-12 mental component, and EQ-5D-VAS, for all patients were used to divide patients into those with better or lower QoL. Regarding the 5 dimensions of the EQ-5D, we classified patients into those with “no problem” (better QoL) and those with problems (lower QoL). We collected the clinical characteristics, treatment modality, and follow-up information of the patients, performed univariate correlation analyses and adjusted the results with the FDR algorithm, and subsequently explored the independent risk factors that predicted lower QoL.
Determinants of AcroQoL.
Fewer comorbidities (P < 0.001) and symptoms (P < 0.001) at follow-up were associated with higher global AcroQoL scores, while medical treatment (P < 0.01), especially SSAs (P < 0.01), and radiotherapy (P < 0.01) were associated with lower global scores (Table 3). Apart from the above factors, female sex was associated with lower physical QoL scores (P < 0.01), and medical treatment with a DA was associated with lower psychological scores (P < 0.01) and lower personal relation scores (P < 0.01). The results of the bivariate regression analysis revealed that more comorbidities and symptoms at the follow-up assessment were independent risk factors for lower scores in all AcroQoL dimensions, and that a large female/male ratio was an independent risk factor for lower physical AcroQoL scores.
Determinants of the AcroQoL in Patients With Treated Acromegaly
| Global score of AcroQoL | Physical section | Psychological section | Appearance | Personal relations | ||||||
|---|---|---|---|---|---|---|---|---|---|---|
| Better (N = 163) | Lower (N = 164) | Better (N = 154) | Lower (N = 173) | Better (N = 165) | Lower (N = 162) | Better (N = 148) | Lower (N = 179) | Better (N = 161) | Lower (N = 166) | |
| Age, years | 39.3 ± 9.7 | 39.2 ± 9.4 | 39.4 ± 9.6 | 39.1 ± 9.4 | 38.8 ± 9.8 | 39.7 ± 9.2 | 39.2 ± 9.7 | 39.2 ± 9.4 | 39.3 ± 9.9 | 39.2 ± 9.1 |
| Sex, male/female | 71/92 | 55/109 | 73/81 bde | 53/120 bde | 70/95 | 56/106 | 60/88 | 66/113 | 72/89 a | 54/112 a |
| Body mass index, kg/m2 | 26.3 ± 6.9 | 26.9 ± 7.5 | 26.4 ± 6.2 | 26.9 ± 8.0 | 26.2 ± 6.8 | 27.1 ± 7.6 | 26.4 ± 7.4 | 26.8 ± 7.1 | 26.3 ± 6.9 | 27.0 ± 7.5 |
| GH at diagnosis, ng/ mL | 14.0 (5.5, 34.5) | 20.3 (9.1, 47.3) | 14.0 (6.0, 35.0) | 20.0 (9.0, 43.6) | 14.0 (6.0, 34.9) | 20.0 (9.0, 44.7) | 14.6 (6.0, 34.9) | 20.0 (8.4, 45.5) | 15.0 (6.0, 35.0) | 19.4 (8.9, 42.4) |
| IGF-1 at diagnosis, ng/mL | 628.0 (402.0, 820.0) | 626.0 (420.0, 806.3) | 620.0 (401.0, 818.3) | 632.0 (421.0, 848.0) | 630.0 (400.0, 820.0) | 608.5 (428.0, 857.0) | 625.5 (399.5, 800.3) | 630.0 (428.0, 824.0) | 629.0 (400.0, 813.0) | 621.0 (428.0, 861.8) |
| IGF-1%ULN at diagnosis, % | 207.0 ± 102.7 | 214.8 ± 109.2 | 208.2 ± 103.5 | 213.3 ± 108.2 | 206.8 ± 101.9 | 215.1 ±110.0 | 206.9 ± 103.6 | 214.2 ± 107.9 | 205.7 ± 100.4 | 215.9 ± 111.0 |
| Surgery, n/% | 128 / 78.5% | 137 / 83.5% | 121 / 78.6% | 144 / 83.2% | 131 / 79.4% | 134 / 82.7% | 118 / 79.7% | 147 / 82.1% | 126 / 78.3% | 139 / 83.7% |
| TES, n/% | 60 / 36.8% | 71 / 43.4% | 57 / 37.0% | 74 / 42.8% | 65 / 39.4% | 66 / 40.7% | 60 / 40.5% | 71 / 39.7% | 65 / 40.4% | 66 / 39.8% |
| TMS, n/% | 64 / 39.3% | 58 / 35.4% | 59 / 38.3% | 63 / 36.4% | 62 / 37.6% | 60 / 37.0% | 55 / 37.2% | 67 / 37.4% | 58 / 36.0% | 64 / 38.6% |
| Transcranial surgery, n/% | 4 / 2.5% | 8 / 4.9% | 5 / 3.2% | 7 / 4.0% | 4 / 2.4% | 8 / 4.9% | 3 / 2.0% | 9 / 5.0% | 3 / 1.9% | 9 / 5.4% |
| Medical treatment, n/% | 66 / 40.5% bd | 94 / 57.3% bd | 59 / 38.3% cd | 101 / 58.4% cd | 68 / 41.2% bd | 92 / 56.8% bd | 64 / 43.2% | 96 / 53.6% | 67 / 41.6% bd | 93 / 56.0% bd |
| Somatostatin analog, n/% | 57 / 35.0% bd | 82 / 50.0% bd | 50 / 32.5% bd | 89 / 51.4% bd | 60 / 36.4% a | 79 / 48.8% a | 55 / 37.2% | 84 / 46.9% | 61 / 37.9% | 78 / 47.0% |
| Dopamine agonist, n/% | 27 / 16.6% a | 43 / 26.2% a | 24 / 15.6% a | 46 / 26.6% a | 25 / 15.2% bd | 45 / 27.8% bd | 25 / 16.9% | 45 / 25.1% | 23 / 14.3% bd | 47 / 28.3% bd |
| Both above medication, n/% | 18 / 11.0% a | 31 / 18.9% a | 15 / 9.7% a | 34 / 19.7% a | 17 / 10.3% a | 32 / 19.8% a | 16 / 10.8% | 33 / 18.4% | 17 / 10.6% a | 32 / 19.3% a |
| Radiotherapy, n/% | 42 / 25.8% bd | 68 / 41.5% bd | 42 / 27.3% a | 68 / 39.3% a | 44 / 26.7% bd | 66 / 40.7% bd | 40 / 27.0% a | 70 / 39.1% a | 39 / 24.2% cd | 71 / 42.8% cd |
| Follow-up period, years | 9.7 ± 5.7 | 10.3 ± 6.6 | 9.7 ± 5.5 | 10.2 ± 6.8 | 9.4 ± 5.7 | 10.6 ± 6.6 | 9.5 ± 5.6 | 10.4 ± 6.6 | 9.3 ± 5.6 | 10.5 ± 6.7 |
| Comorbidities at follow-up, n | 2 (1, 5) cde | 6 (3, 10) cde | 2 (1, 5) cde | 6 (2, 10) cde | 2 (1, 5) cde | 6 (3, 11) cde | 2 (1, 5) cde | 5 (2, 10) cde | 2 (1, 5) cde | 6 (3, 10) cde |
| Symptoms at follow-up, n | 4 (3, 7) cde | 9 (6, 12) cde | 5 (3, 7) cde | 8 (5, 11) cde | 5 (3, 7) cde | 8 (6, 11) cde | 4 (3, 7) cde | 8 (6, 11) cde | 4 (3, 7) cde | 8 (6, 11) cde |
| GH at follow-up, ng/mL | 0.7 (0.3, 1.4) | 1.2 (0.5, 2.4) | 0.8 (0.3, 1.5) | 1.1 (0.5, 2.4) | 0.8 (0.4, 1.5) | 1.0 (0.5, 2.3) | 0.7 (0.3, 1.4) | 1.1 (0.5, 2.4) | 0.8 (0.4, 1.5) | 1.1 (0.5, 2.3) |
| IGF-1 at follow-up, ng/mL | 206.7 (144.7, 320.7) | 218.7 (135.9, 312.2) | 206.7 (148.4, 326.0) | 218.7 (133.3, 306.7) | 212.0 (146.7, 306.7) | 217.7 (132.3, 330.8) | 203.7 (134.4, 318.0) | 229.3 (143.4, 316.4) | 206.7 (142.7, 298.7) | 223.7 (137.7, 333.0) |
| IGF-1%ULN at follow-up, % | 75.9 ± 43.1 | 74.4 ± 45.0 | 77.4 ± 44.6 | 73.1 ± 43.5 | 74.3 ± 40.0 | 76.0 ± 47.8 | 72.5 ± 41.8 | 77.3 ± 45.7 | 73.6 ± 41.1 | 76.7 ± 46.7 |
Continuous variables are presented as means ± standard deviations if normally distributed or medians (25th and 75th quartile) if not normally distributed.
Abbreviations: GH, growth hormone; IGF-1, insulin-like growth factor 1; TES, transsphenoidal endoscopic surgery; TMS, transsphenoidal microscopic surgery; ULN, upper limit of the normal range.
a (P < 0.05), b (P < 0.01) and c (P < 0.001) indicate significant differences between patients with lower and better AcroQoL after univariate analysis.
d Indicates statistically significant differences after being justified by the FDR algorithm, used to control the chance of generating false positives during multiple comparisons.
e Indicates the independent factors.
Determinants of SF-12.
For the physical component of the SF-12, the patients with fewer comorbidities (P < 0.001) and symptoms (P < 0.001) at follow-up had better QoL in all dimensions (Table 4). Lower GH levels at follow-up (P < 0.01) and a lower female/male ratio (P < 0.001) were associated with better PCS, while medical treatment (P < 0.01), especially SSAs (P < 0.01), and radiotherapy (P < 0.01) were associated with worse PCS. In addition, older age (P < 0.001), large female/male ratio (P < 0.01), and medical treatment (P < 0.01) were associated with worse PF. Radiotherapy and higher GH levels at follow-up were associated with worse BP (P < 0.01). A large female/male ratio (P < 0.01), medical treatment (P < 0.01), and higher GH level at follow-up were associated with worse GHP. After regression, more comorbidities and more symptoms at follow-up were tested as independent risk factors for lower scores of all physical dimensions of the SF-12. A large female/male ratio was an independent risk factor for worse PCS, PF, and GHP.
Determinants of the SF-12 Physical Component in Patients With Treated Acromegaly
| SF-12 physical composite summary | Physical functioning | Role limitations-physical | Bodily pain | General health perceptions | ||||||
|---|---|---|---|---|---|---|---|---|---|---|
| Better (N = 150) | Lower (N = 177) | Better (N = 178) | Lower (N = 149) | Better (N = 174) | Lower (N = 153) | Better (N = 127) | Lower (N = 200) | Better (N = 109) | Lower (N = 218) | |
| Age, years | 38.0 ± 8.7 a | 40.3 ± 10.0 a | 37.3 ± 8.7 cd | 41.5 ± 10.0 cd | 38.3 ± 9.3 | 40.3 ± 9.7 | 39.0 ± 9.1 | 39.4 ± 9.8 | 38.2 ± 9.1 | 39.7 ± 9.7 |
| Sex, male/female | 76/74 cde | 50/127 cde | 80/98 bde | 46/103 bde | 77/97 a | 49/104 a | 59/68 a | 67/133 a | 55/54 bde | 71/147 bde |
| Body mass index, kg/m2 | 26.6 ± 7.1 | 26.7 ± 7.3 | 26.4 ± 6.7 | 26.9 ± 7.7 | 26.5 ± 7.3 | 26.7 ± 7.1 | 27.0 ± 8.6 | 26.4 ± 6.1 | 26.4 ± 7.8 | 26.8 ± 7.4 |
| GH at diagnosis, ng/mL | 15.0 (6.0, 35.0) | 20.0 (9.0, 43.0) | 14.0 (6.0, 35.0) | 21.3 (9.1, 45.0) | 15.0 (6.0, 40.0) | 19.2 (9.1, 40.0) | 16.1 (6.8, 35.0) | 18.0 (8.7, 43.0) | 17.0 (5.6, 33.0) | 18.6 (8.9, 43.5) |
| IGF-1 at diagnosis, ng/mL | 629.0 (424.5, 850.0) | 622.0 (420.0, 843.0) | 616.5 (414.5, 820.0) | 630.0 (421.0, 848.0) | 630.0 (417.8, 861.5) | 618.0 (400.0, 825.0) | 618.0 (391.0, 816.5) | 630.0 (428.0, 851.3) | 600.0 (376.0, 813.0) | 633.0 (428.0, 860.8) |
| IGF-1%ULN at diagnosis, % | 204.4 ± 100.1 | 216.4 ± 110.5 | 200.5 ± 99.3 | 223.3 ± 112.3 | 208.1 ± 100.7 | 214.1 ± 111.7 | 204.2 ± 104.5 | 215.1 ± 106.8 | 199.7 ± 107.1 | 261.5 ± 105.1 |
| Surgery, n/% | 119 / 79.3% | 146 / 82.5% | 146 / 82.0% | 119 / 79.9% | 139 / 79.9% | 126 / 82.4% | 101 / 79.5% | 164 / 82.0% | 84 / 77.1% | 181 / 83.0% |
| TES, n/% | 55 / 36.7% | 76 / 42.9% | 69 / 38.8% | 62 / 41.6% | 63 / 36.2% | 68 / 44.4% | 47 / 37.0% | 84 / 42.0% | 40 / 36.7% | 91 / 41.7% |
| TMS, n/% | 59 / 39.3% | 63 / 35.6% | 73 / 41.0% | 49 / 32.9% | 70 / 40.2% | 52 / 34.0% | 48 / 37.8% | 74 / 37.0% | 41 / 37.6% | 81 / 37.2% |
| Transcranial surgery, n/% | 5 / 3.3% | 7 / 4.0% | 4 / 2.2% | 8 / 5.4% | 6 / 3.4% | 6 / 3.9% | 6 / 4.7% | 6 / 3.0% | 3 / 2.8% | 9 / 4.1% |
| Medical treatment, n/% | 61 / 40.7% bd | 99 / 55.9% bd | 75 / 42.1% bd | 85 / 57.0% bd | 75 / 43.1% a | 85 / 55.6% a | 58 / 45.7% | 102 / 51.0% | 42 / 38.5% bd | 118 / 54.1% bd |
| Somatostatin analog, n/% | 52 / 34.7% bd | 87 / 49.2% bd | 66 / 37.1% a | 73 / 49.0% a | 64 / 36.8% a | 75 / 49.0% a | 51 / 40.2% | 88 / 44.0% | 36 / 33.0% a | 103 / 47.2% a |
| Dopamine agonist, n/% | 27 / 18.0% | 43 / 24.3% | 35 / 19.7% | 35 / 23.5% | 30 / 17.2% | 40 / 26.1% | 25 / 19.7% | 45 / 22.5% | 16 / 14.7% a | 54 / 24.8% a |
| Both above medication, n/% | 18 / 12.0% | 31 / 17.5% | 26 / 14.6% | 23 / 15.4% | 19 / 10.9% | 30 / 19.6% | 18 / 14.2% | 31 / 15.5% | 10 / 9.2% a | 39 / 17.9% a |
| Radiotherapy, n/% | 38 / 25.3% bd | 72 / 40.7% bd | 50 / 28.1% a | 60 / 40.3% a | 49 / 28.2% a | 61 / 39.9% a | 30 / 23.6% bd | 80 / 40.0% bd | 33 / 30.3% | 77 / 35.3% |
| Follow-up period, years | 9.8 ± 5.9 | 10.2 ± 6.4 | 9.5 ± 5.5 | 10.6 ± 6.9 | 9.6 ± 5.8 | 10.4 ± 6.6 | 9.8 ± 6.3 | 10.1 ± 6.1 | 9.6 ± 5.8 | 10.2 ± 6.4 |
| Comorbidities at follow-up, n | 2 (1, 4) cde | 6 (3, 10) cde | 2 (1, 5) cde | 7 (4, 10) cde | 2 (1, 5) cde | 6 (3, 10) cde | 2 (1, 5) cde | 5 (2, 9) cde | 2 (1, 5) cde | 5 (2, 9) cde |
| Symptoms at follow-up, n | 5 (3, 7) cde | 8 (5, 11) cde | 5 (3, 8) cde | 8 (5, 11) cde | 5 (3, 8) cde | 8 (5, 12) cde | 4 (2, 7) cde | 8 (5, 11) cde | 4 (3, 8) cde | 7 (5, 11) cde |
| GH at follow-up, ng/mL | 0.7 (0.3, 1.4) cd | 1.1 (0.6, 2.4) cd | 0.9 (0.4, 1.6) | 1.0 (0.5, 2.0) | 0.8 (0.4, 1.5) a | 1.1 (0.5, 2.6) a | 0.7 (0.3, 1.4) bd | 1.1 (0.5, 2.4) bd | 0.7 (0.2, 1.4) bd | 1.0 (0.5, 2.4) bd |
| IGF-1 at follow-up, ng/mL | 204.7 (140.2, 303.2) | 229.3 (141.3, 326.0) | 226.7 (153.3, 333.0) | 206.7 (122.7, 292.7) | 208.0 (146.7, 303.7) | 224.0 (126.0, 331.3) | 192.7 (130.7, 283.3) a | 238.7 (147.2, 329.8) a | 204.0 (140.0, 296.7) | 228.3 (140.9, 320.0) |
| IGF-1%ULN at follow-up, % | 70.7 ± 39.3 | 78.9 ± 47.5 | 76.0 ± 42.5 | 74.1 ± 45.9 | 71.9 ± 38.2 | 78.8 ± 49.6 | 67.7 ± 39.8 a | 79.8 ± 46.0 a | 71.2 ± 38.6 | 77.1 ± 46.4 |
Continuous variables are presented as means ± standard deviations if normally distributed or medians (25th and 75th quartile) if not normally distributed.
Abbreviations: GH, growth hormone; IGF-1, insulin-like growth factor 1; TES, transsphenoidal endoscopic surgery; TMS, transsphenoidal microscopic surgery; ULN, upper limit of the normal range.
a (P < 0.05), b (P < 0.01) and c (P < 0.001) indicate significant differences between patients with lower and better SF-12 scores after univariate analysis.
d Indicates statistically significant differences after being justified by the FDR algorithm, used to control the chance of generating false positives during multiple comparisons.
e Indicates the independent factors.
For the mental component, the patients with better QoL in all dimensions except for GMH had fewer comorbidities (P < 0.001) and fewer symptoms (P < 0.001) at follow-up than those with worse QoL (Table 5). More symptoms and comorbidities at follow-up were independent risk factors for lower scores in vitality, RE, and SF dimensions.
Determinants of the SF-12 Mental Component in Patients With Treated Acromegaly
| SF-12 mental composite summary | Vitality | Role limitations-emotional | Social functioning | General mental health | ||||||
|---|---|---|---|---|---|---|---|---|---|---|
| Better (N = 176) | Lower (N = 151) | Better (N = 209) | Lower (N = 118) | Better (N = 161) | Lower (N = 166) | Better (N = 158) | Lower (N = 169) | Better (N = 185) | Lower (N = 142) | |
| Age, years | 38.8 ± 9.3 | 39.7 ± 9.7 | 39.3 ± 9.8 | 39.0 ± 9.1 | 39.1 ± 9.5 | 39.3 ± 9.6 | 38.8 ± 9.4 | 39.7 ± 9.6 | 38.4 ± 8.9 | 40.3 ± 10.2 |
| Sex, male/female | 76/100 | 50/101 | 84/125 | 42/76 | 72/89 a | 54/112 a | 69/89 a | 57/112 a | 73/112 | 53/89 |
| Body mass index, kg/m2 | 26.7 ± 7.7 | 26.6 ± 6.7 | 26.6 ± 7.6 | 26.8 ± 6.5 | 26.8 ± 7.5 | 26.5 ± 7.0 | 26.4 ± 7.0 | 26.8 ± 7.5 | 26.4 ± 7.1 | 26.9 ± 7.4 |
| GH at diagnosis, ng/mL | 15.7 (6.0, 36.2) | 20.0 (9.0, 40.3) | 15.0 (7.0, 40.0) | 20.7 (9.0, 41.7) | 15.7 (6.0, 38.0) | 19.5 (9.0, 40.0) | 16.0 (7.1, 35.0) | 20.0 (7.8, 40.5) | 19.0 (8.2, 40.0) | 16.0 (6.1, 40.0) |
| IGF-1 at diagnosis, ng/mL | 616.5 (415.8, 820.0) | 630.0 (408.5, 367.0) | 623.0 (417.0, 820.0) | 633.0 (404.3, 875.3) | 630.0 (417.0, 848.0) | 622.5 (404.3, 823.8) | 600.0 (407.5, 800.0) | 649.0 (420.0, 890.0) | 630.0 (417.0, 820.0) | 616.5 (414.0, 846.0) |
| IGF-1%ULN at diagnosis, % | 206.2 ± 100.8 | 216.3 ± 111.6 | 209.5 ± 103.3 | 213.4 ± 110.8 | 210.7 ± 100.6 | 211.1 ± 111.1 | 200.4 ± 95.7 | 220.7 ±114.0 | 205.2 ± 97.7 | 218.2 ± 115.7 |
| Surgery, n/% | 139 / 79.0% | 126 / 83.4% | 170 / 81.3% | 95 / 80.5% | 130 / 80.7% | 135 / 81.3% | 125 / 79.1% | 140 / 82.8% | 148 / 80.0% | 117 / 82.4% |
| TES, n/% | 68 / 38.6% | 63 / 41.7% | 81 / 38.8% | 50 / 42.4% | 62 / 38.5% | 69 / 41.6% | 62 / 39.2% | 69 / 40.8% | 70 / 37.8% | 61 / 43.0% |
| TMS, n/% | 66 / 37.5% | 56 / 37.1% | 82 / 39.2% | 40 / 33.9% | 63 / 39.1% | 59 / 35.5% | 59 / 37.3% | 63 / 37.3% | 73 / 39.5% | 49 / 34.5% |
| Transcranial surgery, n/% | 5 / 2.8% | 7 / 4.6% | 7 / 3.3% | 5 / 4.2% | 5 / 3.1% | 7 / 4.2% | 4 / 2.5% | 8 / 4.7% | 5 / 2.7% | 7 / 4.9% |
| Medical treatment, n/% | 81 / 46.0% | 79 / 52.3% | 98 / 46.9% | 62 / 52.5% | 72 / 44.7% | 88 / 53.0% | 74 / 46.8% | 86 / 50.9% | 89 / 48.1% | 71 / 50.0% |
| Somatostatin analog, n/% | 70 / 39.8% | 69 / 45.7% | 81 / 38.8% | 58 / 49.2% | 63 / 39.1% | 76 / 45.8% | 65 / 41.1% | 74 / 43.8% | 76 / 41.1% | 63 / 44.4% |
| Dopamine agonist, n/% | 33 / 18.8% | 37 / 24.5% | 39 / 18.7% | 31 / 26.3% | 27 / 16.8% a | 43 / 25.9% a | 28 / 17.7% | 42 / 24.9% | 44 / 23.8% | 26 / 18.3% |
| Both above medication, n/% | 22 / 12.5% | 27 / 17.9% | 22 / 10.5% b | 27 / 22.9% b | 18 / 11.2% | 31 / 18.7% | 19 / 12.0% | 30 / 17.8% | 31 / 16.8% | 18 / 12.7% |
| Radiotherapy, n/% | 54 / 30.7% | 56 / 37.1% | 63 / 30.1% | 47 / 39.8% | 47 / 29.2% | 63 / 38.0% | 51 / 32.3% | 59 / 34.9% | 71 / 38.4% a | 39 / 27.5% a |
| Follow-up period, years | 10.2 ± 6.0 | 9.8 ± 6.4 | 10.3 ± 6.1 | 9.4 ± 6.3 | 10.0 ± 6.3 | 10.0 ± 6.1 | 10.1 ± 5.9 | 9.9 ± 6.4 | 10.2 ± 6.2 | 9.7 ± 6.2 |
| Comorbidities at follow-up, n | 2 (1, 5) cde | 6 (2, 10) cde | 3 (1, 6) cde | 6 (3, 11) cde | 2 (1, 5) cde | 6 (2, 10) cde | 2 (1, 5) cde | 5 (2, 9) cde | 4 (1, 7) | 5 (2, 7) |
| Symptoms at follow-up, n | 5 (3, 8) cde | 8 (5, 11) cde | 5 (3, 9) cde | 8 (5, 12) cde | 5 (3, 8) cde | 8 (5, 11) cde | 5 (3, 8) cde | 8 (5, 11) cde | 6 (4, 10) | 6 (4, 10) |
| GH at follow-up, ng/mL | 0.8 (0.4, 1.5) | 1.1 (0.5, 2.4) | 0.8 (0.4, 1.5) | 1.1 (0.5, 2.6) | 0.8 (0.4, 1.6) | 1.0 (0.5, 2.1) | 0.8 (0.4, 1.6) | 1.0 (0.5, 2.0) | 0.9 (0.4, 1.5) | 1.1 (0.5, 2.8) |
| IGF-1 at follow-up, ng/mL | 203.0 (139.2, 206.7) | 233.3 (145.7, 323.0) | 204.7 (140.0, 306.7) | 235.0 (145.5, 328.5) | 205.3 (138.7, 298.7) | 218.7 (145.3, 328.5) | 205.7 (140.9, 306.7) | 224.0 (136.7, 320.0) | 209.3 (133.3, 306.7) | 233.3 (145.3, 324.8) |
| IGF-1%ULN at follow-up, % | 73.2 ± 42.0 | 77.4 ± 46.2 | 75.0 ± 45.8 | 75.4 ± 40.8 | 73.9 ± 41.8 | 76.4 ± 46.2 | 73.3 ± 39.0 | 76.9 ± 48.3 | 72.3 ± 41.4 | 78.9 ± 47.0 |
Continuous variables are presented as means ± standard deviations if normally distributed or medians (25th and 75th quartile) if not normally distributed.
Abbreviations: GH, growth hormone; IGF-1, insulin-like growth factor 1; TES, transsphenoidal endoscopic surgery; TMS, transsphenoidal microscopic surgery; ULN, upper limit of the normal range.
a (P < 0.05), b (P < 0.01) and c (P < 0.001) indicate significant differences between patients with lower and better SF-12 scores after univariate analysis.
d Indicates statistically significant differences after being justified by the FDR algorithm, used to control the chance of generating false positives during multiple comparisons.
e Indicates the independent factors.
Determinants of EQ-5D-5L.
The patients with higher EQ-5D-VAS scores had fewer symptoms (P < 0.001) and comorbidities (P < 0.001) at follow-up than those with lower EQ-5D-VAS scores (Table 6). Moreover, fewer symptoms (P < 0.001) and fewer comorbidities (P < 0.001) were associated with better QoL in all EQ-5D-5L dimensions. Radiotherapy was associated with lower QoL on both pain/discomfort and anxiety/depression scales. The regression results showed that more comorbidities and symptoms at follow-up were independent risk factors for lower EQ-5D-VAS scores and decreased QoL in all EQ-5D-5L dimensions.
Determinants of EQ-5D-5L in Patients With Treated Acromegaly
| VAS of EQ-5D-5L | Mobility | Self-care | Usual activities | Pain/discomfort | Anxiety/depression | |||||||
|---|---|---|---|---|---|---|---|---|---|---|---|---|
| Better (N = 156) | Lower (N = 171) | Better (N = 279) | Lower (N = 48) | Better (N = 310) | Lower (N = 17) | Better (N = 287) | Lower (N = 40) | Better (N = 82) | Lower (N = 245) | Better (N = 57) | Lower (N = 270) | |
| Age, years | 39.0 ± 8.6 | 39.4 ± 10.3 | 38.6 ± 8.9 a | 42.7 ± 12.1 a | 39.0 ± 9.2 | 43.4 ± 14.2 | 38.8 ± 9.1 | 42.2 ± 11.6 | 39.3 ± 9.6 | 39.2 ± 9.5 | 41.9 ± 10.0 a | 38.7 ± 9.3 a |
| Sex, male/female | 70/86 a | 56/115 a | 110/169 | 16/32 | 118/192 | 8/9 | 112/175 | 14/26 | 39/43 | 87/158 | 23/34 | 103/167 |
| Body mass index, kg/m2 | 27.3 ± 9.1 | 26.0 ± 4.7 | 26.5 ± 7.2 | 27.2 ± 7.2 | 26.5 ± 7.1 | 28.4 ± 9.3 | 26.6 ± 7.2 | 26.8 ± 7.2 | 27.0 ± 7.5 | 26.5 ± 7.1 | 26.4 ± 6.6 | 26.7 ± 7.3 |
| GH at diagnosis, ng/mL | 16.6 (6.5, 35.0) | 19.0 (8.1, 43.0) | 16.0 (7.1, 39.0) | 34.3 (8.7, 47.3) | 17.0 (7.2, 40.0) | 34.0 (7.8, 48.0) | 16.0 (7.0, 38.5) | 34.5 (9.5, 45.8) | 12.4 (5.0, 23.0) | 20.0 (9.0, 43.0) | 12.4 (5.0, 23.0) | 19.5 (8.9, 40.0) |
| IGF-1 at diagnosis, ng/mL | 629.0 (426.5, 844.3) | 622.0 (399.0, 833.5) | 622.0 (416.0, 822.5) | 640.5 (412.0, 882.5) | 628.5 (404.5, 847.8) | 620.0 (510.0, 780.0) | 618.0 (402.0, 822.5) | 660.0 (459.5, 891.8) | 589.0 (379.0, 800.0) | 634.0 (428.0, 862.0) | 599.0 (376.0, 800.0) | 631.0 (421.3, 860.8) |
| IGF-1%ULN at diagnosis, % | 212.4 ± 105.2 | 209.5 ± 106.8 | 207.0 ± 101.7 | 233.8 ± 126.4 | 209.4 ± 104.8 | 238.9 ± 124.2 | 206.8 ± 103.9 | 239.9 ± 116.3 | 198.4 ± 102.0 | 215.1 ± 107.0 | 206.2 ± 105.3 | 211.9 ± 106.2 |
| Surgery, n/% | 124 / 79.5% | 141 / 82.5% | 223 / 79.9% | 42 / 87.5% | 252 / 81.3% | 13 / 76.5% | 231 / 80.5% | 34 / 85.0% | 59 / 72.0% a | 206 / 84.1% a | 44 / 77.2% | 221 / 81.9% |
| TES, n/% | 56 / 35.9% | 75 / 43.9% | 110 / 39.4% | 21 / 43.8% | 122 / 39.4% | 9 / 52.9% | 113 / 39.4% | 18 / 45.0% | 28 / 34.1% | 103 / 42.0% | 21 / 36.8% | 110 / 40.7% |
| TMS, n/% | 63 / 40.4% | 59 / 34.5% | 104 / 37.3% | 18 / 37.5% | 119 / 38.4% | 3 / 17.6% | 109 / 38.0% | 13 / 35.0% | 29 / 35.4% | 93 / 38.0% | 19 / 33.3% | 103 / 38.1% |
| Transcranial surgery, n/% | 5 / 3.2% | 7 / 4.1% | 9 / 3.2% | 3 / 6.3% | 11 / 3.5% | 1 / 5.9% | 9 / 3.1% | 3 / 7.5% | 2 / 2.4% | 10 / 4.1% | 4 / 7.0% | 8 / 3.0% |
| Medical treatment, n/% | 75 / 48.1% | 85 / 49.7% | 133 / 47.7% | 27 / 56.3% | 152 / 49.0% | 8 / 47.1% | 138 / 48.1% | 22 / 55.0% | 32 / 39.0% a | 128 / 52.2% a | 24 / 42.1% | 136 / 50.4% |
| Somatostatin analog, n/% | 63 / 40.4% | 76 / 44.4% | 118 / 42.3% | 21 / 43.8% | 133 / 42.9% | 6 / 35.3% | 123 / 42.8% | 16 / 40.0% | 27 / 32.9% a | 112 / 45.7% a | 21 / 36.8% | 118 / 43.7% |
| Dopamine agonist, n/% | 29 / 18.6% | 41/ 24.0% | 60 / 21.5% | 10 / 20.8% | 66 / 21.3% | 4 / 23.5% | 59 / 20.6% | 11 / 27.5% | 13 / 15.9% | 57 / 23.3% | 11 / 19.3% | 59 / 21.9% |
| Both above medication, n/% | 17 / 10.9% a | 32 / 18.7% a | 45 / 16.1% | 4 / 8.3% | 47 / 15.2% | 2 / 11.8% | 44 / 15.3% | 5 / 12.5% | 8 / 9.8% | 41 / 16.7% | 8 / 14.0% | 41 / 15.2% |
| Radiotherapy, n/% | 45 / 28.8% | 65 / 38.0% | 89 / 31.9% | 21 / 43.8% | 107 / 34.5% | 3 / 17.6% | 94 / 32.8% | 16 / 40.0% | 17 / 20.7% bd | 93 / 38.0% bd | 11 / 19.3% bd | 99 / 36.7% bd |
| Follow up period, years | 10.2 ± 6.2 | 9.9 ± 6.2 | 9.8 ± 5.7 | 11.3 ± 8.3 | 9.9 ± 5.9 | 11.8 ± 10.6 | 9.8 ± 5.7 | 11.4 ± 8.7 | 9.4 ± 6.0 | 10.2 ± 6.3 | 11.1 ± 6.3 | 9.8 ± 6.2 |
| Comorbidities at follow-up, n | 2 (1, 6) cde | 5 (2, 9) cde | 3 (1, 6) cde | 9 (6, 14) cde | 4 (1, 7) cde | 11 (7, 19) cde | 3 (1, 7) cde | 9 (5, 13) cde | 2 (1, 4) cde | 5 (2, 8) cde | 2 (1, 5) cde | 4 (2, 8) cde |
| Symptoms at follow-up, n | 5 (3, 8) cde | 8 (5, 11) cde | 6 (4, 9) cde | 11 (6, 14) cde | 6 (4, 9) cde | 12 (8, 16) cde | 6 (4, 9) cde | 11 (6, 13) cde | 4 (2, 5) cde | 7 (5, 11) cde | 4 (2, 5) cde | 7 (4, 10) cde |
| GH at follow-up, ng/mL | 0.8 (0.4, 1.6) | 1.0 (0.5, 2.0) | 1.0 (0.4, 1.6) | 1.2 (0.5, 2.7) | 1.0 (0.4, 1.8) | 1.1 (0.8, 2.8) | 1.0 (0.4, 1.6) | 1.2 (0.5, 2.9) | 0.5 (0.2, 1.0) b | 1.1 (0.5, 2.2) b | 0.5 (0.2, 1.5) | 1.0 (0.4, 2.0) |
| IGF-1 at follow-up, ng/mL | 207.0 (139.8, 323.3) | 218.7 (141.0, 312.4) | 217.3 (141.0, 315.0) | 207.0 (133.3, 341.7) | 214.7 (140.2, 316.2) | 264.7 (169.3, 348.7) | 214.0 (137.7, 318.7) | 238.4 (160.4, 311.5) | 185.4 (126.7, 250.7) a | 233.3 (146.7, 332.0) a | 184.0 (138.7, 250.0) a | 229.7 (145.3, 328.7) a |
| IGF-1%ULN at follow-up, % | 74.2 ± 41.0 | 76.0 ± 46.7 | 73.8 ± 41.3 | 82.8 ± 57.1 | 74.5 ± 43.2 | 87.3 ± 57.2 | 74.0 ± 43.7 | 83.4 ± 45.7 | 64.6 ± 40.6 a | 78.7 ± 44.6 a | 65.8 ± 37.2 | 77.1 ± 45.1 |
Continuous variables are presented as means ± standard deviations if normally distributed or medians (25th and 75th quartile) if not normally distributed.
Abbreviations: GH, growth hormone; IGF-1, insulin-like growth factor 1; TES, transsphenoidal endoscopic surgery; TMS, transsphenoidal microscopic surgery; ULN, upper limit of the normal range.
a (P < 0.05), b (P < 0.01) and c (P < 0.001) indicate significant differences between patients with lower and better EQ-5D-5L scores after univariate analysis.
d Indicates statistically significant differences after being justified by the FDR algorithm, used to control the chance of generating false positives during multiple comparisons.
e Indicates the independent factors.
Discussion
The current nationwide study is the first to comprehensively assess QoL status of patients with treated acromegaly in China using 3 questionnaires, the AcroQoL, SF-12, and EQ-5D-5L, with a long follow-up period of 10 years and inclusion of the largest sample size in the literature. The main findings are that biochemically controlled patients had better QoL than uncontrolled patients in all AcroQoL dimensions and several domains of the SF-12 and EQ-5D-5L, and treated patients with controlled and uncontrolled acromegaly both scored significantly lower in comparison to the general population in PCS, MCS, and the subscales of SF-12 except for PF. We also focused on the related factors and determinants of better/lower QoL. The results showed that more symptoms and comorbidities at follow-up were correlated with and were independent risk factors for worse QoL in all AcroQoL dimensions, all EQ-5D-5L dimensions, PCS, MCS, and most SF-12 domains apart from the GMH scale. Medical treatment, especially with SSAs, and radiotherapy were negatively correlated with several subscales of the AcroQoL, SF-12 physical component, and EQ-5D-5L. A higher female/male ratio was related to lower physical-related QoL scores on the SF-12 and AcroQoL.
In recent years, the investigation of QoL has gradually attracted attention as a way to assess patients’ self-perception of disease severity and improvement after successful treatment (2, 5, 7). Several studies have adopted various questionnaires to assess the QoL of patients with acromegaly, including the generic SF-36 (20, 31-34), EQ-5D-3L (8, 30, 35), Nottingham Health Profile (17, 33), Multidimensional Fatigue Index (17, 33), and Psychological General Well-Being (8, 31) questionnaires, which were designed for general populations and patients with any diseases and could be compared between different groups, as well as the disease-specific AcroQoL (4, 9, 15, 17-19, 31), which was designed and used only for patients with acromegaly. Given our study aims, this study adopted both generic and specific questionnaires. Although the SF-36 is the most frequently used generic questionnaire for QoL assessment, we chose the SF-12 in this survey because it comprises fewer items and is more likely to result in greater survey completion rates and has shown reliable correlations with the SF-36 in large-scale surveys (36-38). The EQ-5D has 2 versions: the traditional 3-level questionnaire, EQ-5D-3L, and the newly developed 5-level questionnaire, EQ-5D-5L. Since the EQ-5D-5L has increased reliability and sensitivity and its value set has recently been established for Chinese populations (24), we selected the EQ-5D-5L as another generic questionnaire for QoL evaluation.
Whether patients with biochemically controlled acromegaly after successful treatment achieve better QoL than those without biochemical control remains under debate. Some studies have concluded that controlled patients had better QoL than active or uncontrolled patients. A study from Wolters et al (4) revealed that scores of all AcroQoL dimensions except for personal relations improved after biochemical control. A Finnish study concluded that normalized hormone levels were associated with better AcroQoL scores (14). Tseng et al (18) demonstrated that the cure of acromegaly had a positive association with the AcroQoL appearance score. However, more studies have obtained the opposite results. Many studies have demonstrated that AcroQoL scores showed no differences between patients with controlled and uncontrolled acromegaly (10-13, 15, 19). Rowles et al (13) and Fujio et al (20) also found no correlations between biochemical control and the scores on the generic questionnaires, including the EQ-5D and SF-36. Our results based on 327 Chinese patients showed that the patients with controlled acromegaly had significantly better QoL in most dimensions than the uncontrolled patients, indicating the important roles of biochemical control in improving acromegaly-associated impaired QoL. In detail, the significant differences in QoL between these 2 groups of patients were embodied in all dimensions of the AcroQoL. However, the differences were not significant in 2 of 8 SF-12 domains (PF and GHP) and 3 of 5 EQ-5D-5L scales (mobility, self-care, and usual activities), which might imply that the disease-specific AcroQoL was more capable of detecting small differences in QoL changes in patients with acromegaly than the generic questionnaires.
In this study, SF-12-PCS, SF-12-MCS, and most SF-12 dimension scores in the patients with treated acromegaly, whether controlled or uncontrolled, were significantly lower than the age- and sex-adjusted population reference values, consistent with the point of view that even biochemical control of acromegaly could not completely normalize the impaired QoL scores (4, 10, 14, 31), thus indicating that normal hormone levels did not always reflect the level of patient subjective well-being. Our results detected no difference in the SF-12-PF scores between treated patients and the population reference, while the differences in the other SF-12 dimensions were significant. However, we could not infer directly that the degree of improvement in PF was larger than the other dimensions, since one study revealed that active, untreated patients with acromegaly had similar PF scores compared with the population reference (34).
Acromegaly has varied effects on different dimensions of the QoL questionnaires. Regarding the AcroQoL, as shown in our results, the psychological-appearance dimension scored the lowest and was thus the most affected, while the psychological-personal relation dimension scored the highest and was the least impacted, consistent with the literature (5, 7). Since changes in appearance remain after long-term endocrine remission, patients with acromegaly usually report negative self-concepts that continuously impact their psychological QoL, especially the AcroQoL appearance dimension. The SF-12 results in this study also reflected the varied influences of acromegaly on QoL, showing that GHP scored the lowest and PF scored the highest.
Recent studies have gradually uncovered the effects of acromegaly-associated symptoms and comorbidities on QoL scores (10, 18, 35). Liu et al (35) demonstrated that patients with more symptoms had worse QoL, as indicated by the EQ-5D-3L and AcroQoL. Tseng et al (18) found that several comorbidities had negative correlations with AcroQoL scores. The Jawiarczyk-Przybyłowska group reported that the numbers of symptoms and comorbidities affected AcroQoL scores regardless of the disease activity (10). Therefore, before the survey, we collected the symptoms and comorbidities that patients complain of and those reported in the literature and listed them in a table for checking to further explore their correlations with patient QoL. Our results showed that the numbers of symptoms and comorbidities were negatively related to QoL scores; the patients with better QoL always had fewer symptoms and comorbidities. This result, consistent with the literature, addressed the importance of evaluating the symptoms and comorbidities during follow-up for patients with treated acromegaly. Relieving the symptoms and managing the comorbidities may help improve the impaired QoL.
Different treatment modalities exert different effects on QoL in patients with treated acromegaly. Generally, in the literature, the effects of medical treatments on QoL depended on the medication used. Treatment with octreotide-LAR and lanreotide were shown to have worse effects on the AcroQoL total score and psychological subscale scores (9, 11, 18), while treatment with pasireotide-LAR alone or combined with pegvisomant showed positive correlations with QoL (15). Since pasireotide and pegvisomant are rarely used in China, our results analyzed only the correlations between traditional SSAs and QoL. We found that medical treatment was correlated with worse scores on the physical subscales of both the AcroQoL and SF-12 and worse scores on the psychological subscale of the AcroQoL, and treatment with either octreotide-LAR or lanreotide was correlated with lower QoL scores on the physical subscales. Correlation analysis between DA treatment and patient QoL has rarely been investigated in the literature. Our results showed that DA treatment was correlated with lower AcroQoL psychological scores, especially lower personal relation scores. Further studies are needed to verify this finding, and explanations for this observation also require exploration. In terms of radiotherapy, consensus in the literature has been achieved on its negative effects on QoL (13, 14, 32, 39, 40). Our results paralleled this consensus, showing that radiotherapy was correlated with worse QoL in many domains of QoL, including the AcroQoL global and psychological dimensions, PCS, SF-12-BP, and the pain/discomfort and anxiety/depression dimensions of the EQ-5D-5L.
Older age and female sex, as shown in this study, were also determinants of decreased scores in the AcroQoL physical dimension, PCS, and the physical subscales of the SF-12. A high female/male ratio was tested as the independent risk factor for decreased scores in the physical components of the AcroQoL and SF-12. Few previous studies have demonstrated relationships between patients’ basic information and QoL. Biermasz et al (33) demonstrated that age was an independent predictor for worse physical scores on the SF-36. Wolters et al (4) concluded that male patients with acromegaly had more pronounced QoL improvements than female patients after successful treatment. These results reminded us that more attention needs to be given to older and female patients than to younger and male patients with acromegaly during follow-up, since their QoL is worse and more difficult to deal with and normalize.
In the literature, while some studies found negative correlations between IGF-1 levels and QoL (4, 8, 13), the majority demonstrated no significant correlations between these 2 parameters (7, 31, 33, 41-43). The same was observed regarding GH levels (5, 7, 10, 13, 33, 44, 45). Our results revealed no significant relationships between hormone indexes, including GH levels, IGF-1 levels and IGF-1%ULN, and AcroQoL scores, SF-12 mental scales, and EQ-5D-5L scores. However, we noticed that GH levels at follow-up were negatively correlated with the PCS and the SF-12 physical scales, including BP and GHP, indicating the potential influence of lowering GH in improving patients’ physical-related QoL.
The current study has limitations. First, as part of the 2019 China Rare Disease Survey, this survey on acromegaly did not distribute QoL questionnaires to the general public, leading to a lack of QoL data for controls. Therefore, we used the SF-12 data from CGSS 2010 as the reference/control when comparing the QoL differences between the patients and the general population. We selected adults from CGSS 2010 with the same sex and age spans (10 years) as the patients to be the control group, using a patient-to-control ratio of 1:2, to make the 2 QoL datasets more comparable and to increase the credibility and authenticity of the results. Fortunately, our result that most dimensions of QoL scores in patients with treated acromegaly were lower than the reference was consistent with the literature (5, 7). Second, there have been various QoL questionnaires that could be used for acromegaly. However, to obtain relatively accurate self-perceived views on QoL and to maintain a reasonable completion rate, we applied only 3 of the most representative QoL questionnaires. Future surveys using other questionnaires to acquire a greater understanding of acromegaly-associated QoL from other angles can be performed. Third, we conducted a cross-sectional survey on patients with treated acromegaly who were followed up for a mean period of 10 years but did not include the pretreatment QoL data to investigate the effect of treatment on QoL. The reason was that recalling QoL before treatment that was long ago would generate great bias and in turn lead to inaccurate conclusions. Fourth, the conclusions of this study were derived from Chinese patients and might be applicable to Asian countries but may not be representative for several other patient populations, such as European or American patients; thus, one should be cautious when applying these results and conclusions in distinct populations. Moreover, the influences of GH receptor antagonists and repeated surgeries on the QoL of patients with treated acromegaly were not analyzed in this study. An improved survey questionnaire will be designed for further study to achieve more comprehensive and informative conclusions for clinical use.
In conclusion, we conducted a nationwide cross-sectional study in China on the QoL of 327 patients with treated acromegaly with a long-term follow-up for the first time and explored its determinants. QoL of patients after treatment, regardless of being controlled or uncontrolled, did not recover to the population level. Compared with the uncontrolled patients, the controlled patients had better QoL in most physical and psychological dimensions. Acromegaly-associated symptoms and comorbidities at follow-up, medical treatment, especially with SSAs, and radiotherapy were significant negative predictors of decreased QoL in patients with treated acromegaly. Among them, more symptoms and comorbidities after treatment were recognized as independent risk factors for decreased QoL. Female patients were more likely to have lower scores in physical-related QoL than male patients. We propose that biochemical control should not be considered the only goal of successful treatment of acromegaly. QoL and its determinants, especially the accompanying acromegaly-associated symptoms and comorbidities, need to be taken into serious consideration in combination with the biochemical and radiological parameters during the posttreatment follow-up for patients with acromegaly. Female patients and those who have undergone radiotherapy and medical treatment are vulnerable to having lower QoL and thus need more attention during follow-up.
Abbreviations
- AcroQoL
acromegaly quality of life questionnaire
- BP
bodily pain
- CAPA
Chinese Association of Patients with Acromegaly
- CGSS 2010
China General Social Survey of 2010
- DA
dopamine agonist
- EQ-5D-5L
5-level EuroQoL 5-dimensional questionnaire
- FDR
false discovery rate
- GH
growth hormone
- GHP
general health perceptions
- GMH
general mental health
- IGF-1
insulin-like growth factor 1
- IGF-1%ULN
IGF-1 percentage of upper limit of the normal range
- MCS
mental composite summary
- LAR
long-acting release
- PCS
physical composite summary
- PF
physical functioning
- RE
role limitations due to emotional problems
- RP
role limitations due to physical problems
- QoL
quality of life
- SF
social functioning
- SF-12
12-item short-form health survey questionnaire
- SSA
somatostatin analog
- VAS
visual analog scale
Acknowledgments
We thank all the patients with acromegaly from the Chinese Association of Patients with Acromegaly (CAPA) for participating in this survey and sharing their points of view on quality of life. We thank the doctors and nurses in CAPA for giving routine online lectures and providing help and care to the patients and their families. We thank the Illness Challenge Foundation and China Alliance of Rare Diseases for their support in the survey.
Financial Support: This work was supported by the National Key Research and Development Program of China (Grant No. 2016YFC0901500) and the Center for Rare Diseases Research, Chinese Academy of Medical Sciences, Beijing, China (Grant No. 2016ZX310174-4).
Clinical Trial Registration: Not applicable.
Author Contributions: X.G., K.W., S.Y., B.X., S.Z., and D.D. designed the study; K.W., S.Y., H.Z., and D.D. performed the survey and collected responses; B.X., H.Z., S.Z., and D.D. monitored the entire procedure, implementation, and quality control of the survey; X.G., L.G., and Z.W. performed the statistical analysis and visualization of the data; X.G. and K.W. wrote the manuscript; B.X., S.Z., and D.D. revised the manuscript; the whole team approved the final version of the manuscript.
Additional Information
Disclosure Summary: The authors have nothing to disclose.
Data Availability
Some or all data generated or analyzed during this study are included in this published article or in the data repositories listed in References. Supplementary files are available in Reference 29.
References
Author notes
Xiaopeng Guo and Kailu Wang contributed equally to this work.
These authors have contributed equally to this work as co-corresponding authors.
