


Abstract
Muscle strength and performance are associated with fractures. However, the contribution of their rate of decline is unclear.
To assess the independent contribution of the rate of decline in muscle strength and performance to fracture risk.
Community-dwelling women (n = 811) and men (n = 440) aged 60 years or older from the prospective Dubbo Osteoporosis Epidemiology Study followed from 2000 to 2018 for incident fracture. Clinical data, appendicular lean mass/height2 (ht)2, bone mineral density, quadricep strength/ht (QS), timed get-up-and-go (TGUG), 5 times repeated sit-to-stand (5xSTS), and gait speed (GS) measured biennially. Rates of decline in muscle parameters were calculated using ordinary least squares regression and fracture risk was assessed using Cox’s models.
Incident low-trauma fracture ascertained by x-ray report.
Apart from lean mass in women, all muscle parameters declined over time. Greater rates of decline in physical performance were associated with increased fracture risk in women (Hazard ratios [HRs] ranging from 2.1 (95% CI: 1.5–2.9) for GS to 2.7 (95% CI: 1.9–3.6) for 5xSTS, while in men only the decline in GS was associated with fracture risk (HR: 3.4 [95% CI: 1.8–6.3]). Baseline performance and strength were also associated with increased fracture risk in men (HRs ranging from 1.8 (95% CI: 1.1–3.0) for QS to 2.5 (95% CI: 1.5–4.1) for TGUG, but not in women.
Rate of decline in physical performance in both genders, and baseline strength and performance in men, contributed independently to fracture risk. Sit-to-stand and GS were the tests most consistently associated with fractures. Further studies are required to determine whether muscle strength and/or performance improve the predictive accuracy of fracture prediction models.
Osteoporosis and its outcome of fragility fractures are a substantial burden for the individual and the public health care system (1). Fractures are associated with significant disability and societal cost (2), increased risk of subsequent fracture (3), and increased mortality (4). It is thus essential to identify those at high risk of fracture and their adverse outcomes in order to intervene with effective strategies. Bone mineral density (BMD) is a robust predictor of fracture risk (5). However, more than 56% of fractures occur in people who do not have osteoporosis by bone density criteria (6). Therefore, different fracture risk tools, including FRAX and the Garvan fracture risk calculator (Garvan FRC), have incorporated additional risk factors including age, prior fractures, and falls (7) to improve the ability to identify people at higher risk of fracture. Nevertheless, fracture prediction using these tools remains imperfect (8–10).
Sarcopenia, the age-related progressive and generalized loss of skeletal muscle mass and function (11) has been widely investigated as a risk factor of falls and fractures (12, 13). However, sarcopenia is hampered by the presence of multiple definitions that variably incorporate muscle mass, strength, and/or performance (14–20). It has become increasingly clear that DXA-derived lean mass is not an accurate estimate of muscle mass (21) and is a poor predictor of fracture risk (22, 23). It is likely that muscle strength and performance more predominantly affect fracture risk (22). In a recent meta-analysis, higher risks of fractures were observed when muscle strength and/or performance were included in the definition of sarcopenia (12).
It has been demonstrated that muscle parameters (lean mass, muscle strength, and performance) decline with age (24–26). People lose 0.5% of their lean mass (24), 1.6% of QS (25), and 3% of walk speed (26) every year. This annual rate of decline accelerates to 1% and 6% after the age of 75 for lean mass and GS, respectively (24, 25). Nevertheless, there is substantial variation in the rate of decline across individuals, as these parameters can be altered by exercise, nutritional status, or disuse (27, 28). Greater rates of decline in muscle strength and performance have been associated with disability and mortality (29–32). However, the contribution of the decline in these different muscle parameters to fracture risk independent of age and other risk factors for fracture has not been comprehensively investigated.
Therefore, this study aimed to assess the role of the rate of decline of muscle strength, and performance on fracture risk prediction in a population of elderly community-dwelling women and men, over and above other known risk factors. Additionally, we also aimed to assess the contribution of baseline values of muscle strength, physical performance, and lean mass on fracture risk.
Methods
Setting and study population
This study was part of the ongoing longitudinal Dubbo Osteoporosis Epidemiology Study (DOES), a prospective observational cohort study of community-dwelling women and men residing in the regional city of Dubbo, 400 km northwest of Sydney, Australia. A detailed description of the study goals, design, and methodology has been previously published (33). Briefly, the DOES included 2 phases: DOES 1 that started in 1989 and DOES 2 that started in 2000. All included participants that were aged 60 years or older at study entry. Clinical visits were regularly conducted every 2 or 3 years.
Measures of physical performance were acquired from 2000 onwards. Thus, we included the participants from the second phase of the DOES who were recruited from 2000 and aged 60 years or older at entry (33). The cohort was selected based on participants who had all measures available for muscle strength (ie, QS) and physical performance (timed get-up-and-go [TGUG], 5 times repeated sit-to-stand [5xSTS], or GS) (Fig. 1). This complete case analyses included 811 women and 440 men. A total of 168 participants were excluded from the complete case analysis because they had at least 1 missing measurement of muscle strength or performance. These participants were included in the sensitivity analysis. People who were excluded from the primary analysis (103 women and 65 men) were older, had more prior fractures and falls, and had more cardiovascular illnesses than those who were included. Women who were excluded also had lower femoral neck (FN) bone mineral density (BMD) and were more likely to be smokers than those who were included (data not shown).
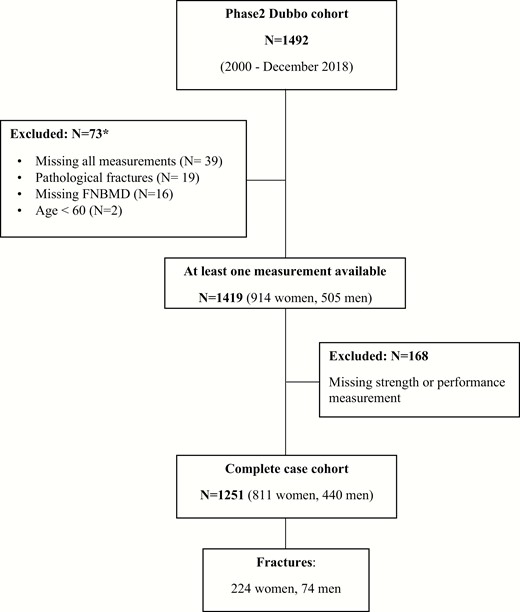
Flow chart of participants included in the study. *The individual numbers do not add to the total, as some participants have more than one exclusion criteria.
All participants provided written informed consent. The study was approved by St Vincent’s Hospital Human Research Ethics Committee (NEAF AU/1/80C517).
Study design and data collection
Data on year of birth, gender, smoking status (current/nonsmoker), alcohol consumption (heavy/light), history of falls in the past 12 months, prior fractures after the age of 50 years (yes/no), and comorbidities (including diabetes, cancer, hypertension, renal failure, neurological, cardiovascular, and respiratory diseases) were collected from a structured questionnaire by qualified nurses at baseline and all subsequent visits. Physical activity was assessed using the metabolic equivalent of task (MET), which is calculated as the average number of hours spent per day in each of 5 levels of activity (ranging from sedentary to heavy exercise), with weighting factors based on associated oxygen consumption for each activity. Anthropometric measurements of weight (kg) and height (m) were obtained at each visit. Bone mineral density was measured at the FN using DXA (GE Lunar Prodigy Pro, Madison, WI). The coefficient of variation for FN BMD at our institution in normal subjects is 1.3%. T-scores were obtained using the Australian Femur reference population which are similar to reference ranges (34, 35) established by the Geelong Osteoporosis Study and recommended to be used in Australia by the Australian and New Zealand Bone and Mineral Society.
Muscle measurements
Muscle strength and physical performance.
Muscle strength was determined by a QS test (36), which measures the maximum isometric muscle contraction of the quadriceps using a horizontal Pocket Balance spring scale (Rebuere, Remscheid, Germany). The maximum force was calibrated to 50 kg. The best measurement out of 3 trials was used in this analysis. As QS may be affected by leg length, height-adjusted QS (kg/m) was used.
Physical performance was evaluated using 3 different tests: (1) timed TGUG test, which was measured as the time in seconds taken to stand up from a sitting position on a standard chair (height = 37 cm), walk 3 meters, turn, walk back, and sit down; (2) 5xSTS, which was measured as the time in seconds required to complete 5 repeated fully extended stands from a seated position on the chair, with arms folded across the chest; and (3) GS, which was measured by the time in seconds required by participants to finish a walking course along a straight 6-meter corridor at their normal walking speed. Gait speed (m/s) was then computed as the distance in meters divided by the time in seconds.
Lean mass.
Body composition (total and regional body measures of lean mass) was measured from a total body scan at the same time as the FN BMD scan using DXA densitometer. As lean mass correlates with body size (37), appendicular lean mass index (ALMI) was calculated as the sum of both lean mass in the arms and legs in kilograms divided by height squared (ALM/ht2). This index was first suggested by Baumgartner et al (14) and found to be associated with certain adverse outcomes (38). To assess the robustness of the index used in the analysis, appendicular lean mass was also normalized to (1) body mass index (BMI) (20) and (2) height and fat mass (residual method) (15). Lean mass measurements were available for 290 women and 160 men.
Outcome measures
Fractures were prospectively ascertained by review of all x-ray reports in the 2, and at times 3, radiology services available in Dubbo. Circumstance of fracture was obtained by interview. Only minimal trauma fractures were included. Fractures of the head, toes, and fingers were excluded. Subjects with pathological fractures (eg, malignancy or metabolic bone disease) were excluded from the analysis. Mortality was ascertained through local sources and was verified from the Registry of Births, Deaths and Marriages in New South Wales. Time to fracture was calculated from the baseline measurement date until the first incident low trauma fracture, death, or end of study data collection (December 31, 2018).
Statistical analysis
All analyses were gender specific because of the substantial difference in the magnitude of osteoporosis and fracture risk between genders. Fracture incidence rates (number of fractures per 1000 person-years of follow-up) were calculated using a Poisson assumption.
Contribution of baseline muscle parameters to fracture risk.
Age- and Garvan FRC–adjusted (ie, age, FN BMD, prior fractures, and falls in the previous year) Cox proportional hazards models were constructed to assess the contribution of individual muscle parameters (ie, lean mass, strength, and performance, including TGUG, 5xSTS, and GS), measured at baseline to fracture risk. In addition, a multivariable-adjusted analysis was conducted to assess whether further adjustment for other clinical risk factors, predefined from the current literature (ie, BMI, smoking, alcohol, and comorbidities including diabetes, neurological diseases, cardiovascular diseases, cancer, hypertension, respiratory diseases, and renal failure) and physical activity affected the impact of baseline muscle parameters on fracture risk. Apart from physical activity there were no missing data for the risk factors included in the multivariable models. For those who had missing data on physical activity (N = 10), values from the subsequent visit (2 years later) were used. Additional adjustment for weight loss, calculated using the same approach used to calculate the rate of change in muscle parameters, was also performed.
As the association between several muscle measurements and fracture risk was not linear, even after transforming the data to the inverse, square, or logarithm format, we examined the contribution of worse performance, operationally dichotomized using the worst quartiles of the specific measurement to fracture risk.
Contribution of the rate of change in muscle parameters to fracture risk.
The annual rates of change of lean mass, muscle strength, and physical performance were estimated for participants with at least 2 measurements available. Repeated measurements taken before the fracture date were used to calculate the rate of change for those who sustained fractures, while all available measurements were used for those who remained fracture-free. The rates of change were estimated by fitting an ordinary least square regression to the data of each individual muscle parameter against time to obtain the intercept and slope for each participant. The ordinal least square regression allows use of the “real” data obtained at the “real” time of measurements. The annual rate of percentage change was calculated as the ratio of slope over the intercept multiple by 100.
Similar to baseline analysis, age-, Garvan FRC–, and multivariable-adjusted Cox proportional hazards models were constructed to assess the contribution of the rate of change in muscle parameters to fracture risk. In addition to the risk factors, the analyses made further adjustment for the corresponding baseline measurement.
We also assessed the association between sarcopenia, defined according to the revised definition of the European Working Group on Sarcopenia in Old People (EWGSOP) (39), and fracture risk. Sarcopenia status was defined as probable sarcopenia (low muscle strength [QS/height ≤ 11 kg/m for women and ≤18 kg/m for men]), confirmed sarcopenia (low muscle strength and low muscle mass [ALMI ≤ 5.5 kg/m2 for women and ≤7 kg/m2 for men]), and severe sarcopenia (low muscle strength, low muscle mass, and poor muscle performance [GS ≤ 0.8 m/s for women and men]). We used QS as a direct measure of muscle strength rather than sit-to-stand test (the recommended test by EWGSOP) as the former is widely accepted as direct measure of muscle strength and also because more data were available on quadriceps strength than 5xSTS test. The cutoff points used were defined as the lowest gender-specific quartiles. The contribution of sarcopenia status to fracture risk was assessed using gender specific age- and Garvan FRC–adjusted Cox models.
Sensitivity analysis.
In order to include more participants, who had at least 1 but not all muscle tests available, sensitivity test-specific cohort analyses were separately conducted for each muscle parameter. Therefore, 5 separate test-specific cohorts were constructed for lean mass, muscle strength, and the 3 physical performance tests, and the analyses were carried out separately for each test. A TGUG test was introduced later to the study (in 2004) and, therefore, fewer data were available on this particular test.
Analyses were conducted using SAS version 9.4 (SAS Institute Inc, Cary, NC). A 2-sided P-value < 0.05 was considered statistically significant. In addition to the P-value, we primarily focused our interpretation of the results on the magnitude of the effect estimates and their precision (confidence intervals) as recommended by Stern and Smith (40).
Results
Baseline characteristics
The analysis included 1251 participants (65% women and 35% men) who had values for all muscle strength and performance measures (Fig. 1). Mean age (SD) was 68.6 (4.24) years in women and 69.2 (3.80) years in men (Table 1). During a median of 10 years of follow-up, 224 women and 74 men sustained at least 1 fracture to yield a fracture incidence rate of 30 fractures (95%CI: 26-34) per 1,000 person-years in women and 18 fractures (14–23) per 1,000 person-years in men.
Baseline characteristic of women and men stratified by fracture status
| Women (n = 811) | Men (n = 440) | |||
|---|---|---|---|---|
| Fracture 224 (27.6%) | No fracture 587 (72.4%) | Fracture 74 (16.8%) | No fracture 366 (83.2%) | |
| Age (yr)a | 69.1 (4.2) | 68.3 (4.2) | 69.9 (3.9) | 69.1 (3.8) |
| BMI (kg/m2)b | 27.6 (25.2–30.2) | 27.3 (24.2–30.8) | 28.7 (26.9–30.7) | 27.7 (25.9–30.5) |
| FN BMD (g/cm2)a | 0.81 (0.11) | 0.86 (0.13) | 0.94 (0.14) | 0.95 (0.14) |
| FN BMD T-scorea | -1.45 (0.93) | -1.01 (1.05) | -1.00 (1.09) | -0.90 (1.03) |
| Prior fracturee | 56 (25) | 123 (21) | 13 (18) | 49 (13) |
| Fallse | 97 (43) | 196 (33) | 29 (39) | 109 (30) |
| Comorbiditiesd,b | 1 (0–2) | 1 (0–2) | 1 (1–2) | 1 (1–2) |
| Smokere | 9 (4) | 18 (3) | 6 (8) | 19 (5) |
| Alcohol (heavy)e | 19 (8) | 59 (10) | 14 (19) | 48 (13) |
| Physical activityb | 3 (2–3) | 3 (2–3) | 3 (3-3) | 3 (3-3) |
| Muscle parameter | ||||
| QS (kg/m)b | 13.4 (10.6–16.0) | 13.8 (10.9–17.1) | 20.8 (16.3–24.4) | 22.1 (18.1–26.4) |
| TGUG (s)b | 8 (7–9) | 7 (6–9) | 8 (7–9) | 7 (6–8) |
| 5xSTS (s)b | 12.2 (10.0–15.0) | 11.5 (9.2–14.3) | 13.3 (10.3–16.1) | 11.1 (9.3–14.0) |
| GS (m/s)b | 0.88 (0.75–0.97) | 0.87 (0.77–0.98) | 0.84 (0.73–0.94) | 0.88 (0.79–0.98) |
| ALMI (kg/m2)b,c | 6.08 (5.76–6.53) | 6.15 (5.68–6.72) | 8.19 (7.75–8.92) | 8.06 (7.58–8.46) |
Bold values indicate statistically significant differences between fracture and non-fracture groups.
Abbreviations: ALMI, appendicular lean mass index; BMI, body mass index; FN BMD, Femoral neck bone mineral density; GS, gait speed; QS, quadricep strength; STS, sit-to-stand; TGUG, timed get-up-and-go.
Values presented as: aMean (SD), bMedian (interquartile range), and eNumber (%).
cData on lean mass was available for 290 women and 160 men.
dThe total number of the following comorbidities: cancer, renal failure, hypertension, diabetes, rheumatoid arthritis, cardiovascular, neurological, respiratory, and liver diseases.
Compared to women with no fracture, women who sustained a fracture were older, had lower FN BMD, and experienced more falls in the previous 12 months. Although these characteristics did not differ between fracture and no fracture for men, men who sustained a fracture had a higher BMI than those who did not. Comorbidities were not different between the fracture groups for either gender (Table 1).
Women and men who sustained a fracture had lower baseline QS and worse performance in TGUG and 5xSTS tests. Gait speed was also lower in men who sustained a fracture. However, baseline measurements of lean mass were not different between the fracture and non-fracture groups for either gender (Table 1).
Contribution of baseline muscle parameters to fracture risk
In women, none of the baseline muscle parameters was associated with fracture risk in either age- adjusted or Garvan FRC–adjusted models (Table 2). In men, however, the picture was quite different. Low baseline muscle strength and performance measurements were all independent predictors of fracture risk. The worst quartile of QS (≤18 kg/m), TGUG (>8 s), 5xSTS time (≥14.5 s), and GS (≤0.8 m/s) were all associated with a 2- to 3-fold increase in fracture risk in both age- and Garvan FRC–adjusted models (Table 2).
Contribution of muscle parameters measured at baseline and their rate of decline to fracture risk among men and women
| HR (95% CI) | |||||
|---|---|---|---|---|---|
| Muscle Parameters | Study Groupa | Fractures/Total Number | Age-adjusted Model | Garvan FRC– adjusted Modelc | Multivariable-adjusted Modeld |
| Baseline measurements | |||||
| Women | |||||
| QS (kg/m) | ≤11.0 | 224/811 | 1.12 (0.85–1.49) | 1.12 (0.84–1.48) | 1.05 (0.79–1.39) |
| TGUG (s) | >9 | 224/811 | 0.77 (0.56–1.05) | 0.77 (0.57–1.06) | 0.74 (0.54–1.01) |
| STS (s) | ≥14.5 | 224/811 | 1.26 (0.93–1.71) | 1.26 (0.93–1.70) | 1.17 (0.86–1.59) |
| GS (m/s) | ≤0.8 | 224/811 | 1.20 (0.90–1.60) | 1.20 (0.90–1.60) | 1.10 (0.82–1.49) |
| ALMI (kg/m2)b | ≤5.5 | 79/290 | 0.78 (0.43–1.42) | 0.71 (0.39–1.30) | 0.82 (0.61–1.11) |
| Men | |||||
| QS (kg/m) | ≤18 | 74/440 | 1.74 (1.08–2.82) | 1.77 (1.08–2.88) | 1.81 (1.09–3.03) |
| TGUG (s) | >8 | 74/440 | 2.67 (1.65–4.30) | 2.69 (1.67–4.34) | 2.49 (1.52–4.08) |
| STS (s) | ≥14.5 | 74/440 | 2.34 (1.45–3.78) | 2.30 (1.43–3.72) | 2.20 (1.33–3.62) |
| GS (m/s) | ≤0.8 | 74/440 | 2.05 (1.28–3.29) | 2.06 (1.28–3.30) | 1.87 (1.14–3.05) |
| ALMI (kg/m2)b | ≤7 | 23/160 | 0.62 (0.18–2.14) | 0.68 (0.19–2.45) | 1.04 (0.61–1.77) |
| Rates of changee | |||||
| Women | |||||
| QS | ≤-3.56 | 178/690 | 1.30 (0.93–1.81) | 1.25 (0.90–1.75) | 1.29 (0.92–1.81) |
| TGUG | ≥4.57 | 174/685 | 2.34 (1.71–3.19) | 2.26 (1.66–3.09) | 2.29 (1.66–3.14) |
| 5xSTS | ≥3.9 | 171/673 | 2.44 (1.80–3.32) | 2.55 (1.87–3.48) | 2.65 (1.92–3.64) |
| GS | ≤-3.45 | 173/673 | 2.02 (1.47–2.79) | 2.04 (1.48–2.82) | 2.05 (1.47–2.86) |
| ALMI | ≤-0.25 | 36/190 | 2.89 (1.49–5.58) | 2.78 (1.40–5.51) | 5.45 (2.33–12.73) |
| Men | |||||
| QS | ≤-3.48 | 52/366 | 1.15 (0.59–2.23) | 1.09 (0.56–2.12) | 1.08 (0.55–2.14) |
| TGUG | ≥3.47 | 51/360 | 1.46 (0.78–2.75) | 1.50 (0.79–2.83) | 1.53 (0.79–2.95) |
| 5xSTS | ≥3.4 | 46/352 | 1.89 (1.04–3.46) | 1.91 (1.04–3.51) | 1.65 (0.87–3.10) |
| GS | ≤-3.27 | 48/355 | 3.11 (1.72–5.65) | 3.18 (1.73–5.85) | 3.38 (1.80–6.34) |
| ALMI | ≤-0.91 | 7/83 | 1.68 (0.37–7.52) | 1.70 (0.34–8.47) | 1.96 (0.22–17.06) |
Bold font indicates statistical significance.
Abbreviations: 5xSTS, 5 times repeated sit-to-stand; ALMI, appendicular lean mass index; GS, gait speed; QS, quadriceps strength; TGUG, timed get-up-and-go.
aStudy group includes participants with the worst quartile of each muscle parameter.
bLean mass data was available for 290 women and 160 men.
cGarvan FRC–adjusted models accounted for age, FN BMD, prior fractures, and falls.
dMultivariable-adjusted models accounted for age, FN BMD, prior fractures, falls, BMI, smoking, alcohol, physical activity, diabetes, neurological diseases, cardiovascular diseases, cancer, hypertension, respiratory diseases, and renal failure.
eRate of change models (age- and Garvan FRC–adjusted) were additionally adjusted for the corresponding baseline measurement.
Multivariable-adjusted models showed that further adjustment for BMI, smoking, alcohol, physical activity, and comorbidities (ie, diabetes, neurological diseases, cardiovascular diseases, cancer, hypertension, respiratory diseases, and renal failure) did not change the impact of baseline muscle strength and performance on fracture risk (Table 2, Fig. 2). Additional adjustment for weight loss did not modify the primary analysis results (data not shown).
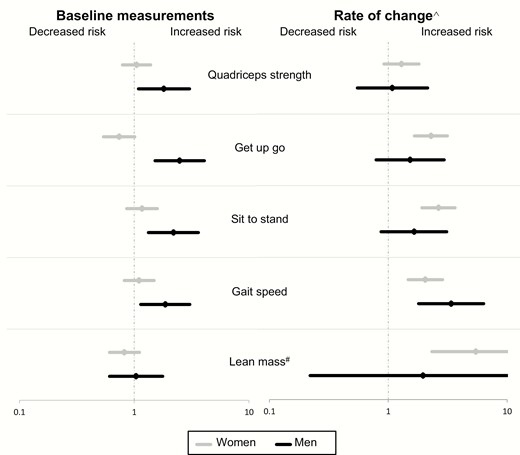
Contribution of muscle parameters measured at baseline and their rate of decline to fracture risk among men and women (multivariable-adjusted models*). *Multivariable-adjusted models accounted for age, FN BMD, prior fractures, falls, BMI, smoking, alcohol, physical activity, diabetes, neurological diseases, cardiovascular diseases, cancer, hypertension, respiratory diseases, and renal failure. #Lean mass data was available for 290 women and 160 men. ^ Rate of change models were adjusted for the risk factors and the corresponding baseline measurement. Participants in the lowest (worst) quartile of each muscle parameter measurement were compared with those in the upper 3 quartiles.
Low baseline lean mass assessed as appendicular lean mass normalized to height squared (≤5.5 kg/m2 in women and ≤7 kg/m2) was not associated with higher fracture risk in women or men. Normalizing appendicular lean mass to BMI or to height and fat mass yielded similar results (data not shown).
Contribution of the rate of change in muscle parameters to fracture risk
As expected, there was deterioration in muscle strength and performance over time for both women and men. Women had a median loss of 1.8% per year in QS and 1.5% per year in GS (Table 3). There was an increase in TGUG time by 0.4% per year and 5xSTS time by 0.9% per year. The corresponding rates for men were 2.0% for QS, 1.5% for GS, 0.2% for TGUG, and 0.7% for 5xSTS. Lean mass declined in men by a median of 0.2% per year but not in women (median 0.4% per year increase).
Annual rate of change of muscle parameters (percentage of changes per year) in women and men
| Muscle Parameter | Women | Men |
|---|---|---|
| QS | -1.80 (-2.02 to -1.53) | -2.02 (-2.20 to -1.77) |
| TGUG | 0.41 (0.11 to 0.89) | 0.22 (0.00 to 0.75) |
| 5xSTS | 0.86 (0.51 to 1.12) | 0.75 (0.08 to 1.27) |
| GS | -1.47 (-1.69 to -1.15) | -1.46 (-1.75 to -1.20) |
| ALMI | 0.40 (0.25 to 0.53) | -0.24 (-0.45 to -0.12) |
Values presented as median (95% confidence interval) of annual percentage changes. The bias-corrected bootstrap confidence intervals were estimated using bootstrap resampling (2000 times).
Abbreviations: ALMI, appendicular lean mass index; GS, gait speed; QS, quadriceps strength; TGUG, timed get-up-and-go; STS, sit-to-stand.
In age-adjusted, Garvan FRC–adjusted, and the multivariable-adjusted models, greater deterioration in muscle performance and lean mass, but not strength, was associated with a 2- to 3-fold increased fracture risk in women and men independent of the baseline values and other confounding effects (Table 2). However, this association did not reach the level of significance for all tests in men, likely due to the small sample size. Notably, 5xSTS and GS were the physical performance tests most consistently associated with fractures in men and women although rate of change of 5xSTS was not significant in men.
Sarcopenia and fracture risk
Sarcopenia status was determined in 562 women and 264 men who had all lean mass, strength, and GS measurements recorded. In this subgroup, there were 154 incident fractures in women and 42 fractures in men. The prevalence of sarcopenia was low, with 75 (13%) women and 31 (12%) men having confirmed sarcopenia, and 62 (11%) women and 29 (11%) men having severe sarcopenia.
In both age-adjusted and Garvan FRC–adjusted models, there was no association between sarcopenia and fracture risk in women (Table 4). By contrast, sarcopenic men had a 2- to 3-fold increased fracture risk. Similar overall results were obtained after modeling sarcopenia defined using 5xSTS as a measure of muscle strength rather than QS. However, the confidence intervals were wider due to somewhat smaller numbers of participants having data for 5xSTS test.
Contribution of sarcopenia, as defined by the revised definition of the EWGSOP, to fracture risk in women and men
| HR (95% CI) | ||
|---|---|---|
| Sarcopenia Statusa | Age-adjusted model | Garvan FRC–adjusted modelb |
| Probable sarcopenia | ||
| Women | 1.09 (0.76–1.56) | 1.03 (0.71–1.48) |
| Men | 2.07 (1.10–3.91) | 2.09 (1.10–3.95) |
| Confirmed sarcopenia | ||
| Women | 0.98 (0.60–1.60) | 0.89 (0.54–1.45) |
| Men | 3.08 (1.29–7.36) | 2.66 (1.11–6.35) |
| Severe sarcopenia | ||
| Women | 1.05 (0.62–1.79) | 0.97 (0.57–1.65) |
| Men | 3.73 (1.55–8.97) | 3.35 (1.38–8.11) |
Bold font indicates statistical significance.
aSarcopenia status could be determined for 562 women and 264 men.
bGarvan FRC–adjusted models adjusted for age, FN BMD, prior fractures, and falls.
Sensitivity analysis
There were 914 women and 505 men who had at least 1 muscle strength and performance measure available. Separate test-specific cohort analyses were conducted for individual muscle parameters, all supplementary tables are located in a digital research materials repository (41) (Table S1a, b). Importantly, the results of the sensitivity test-specific cohort analyses were consistent with the primary analysis for both baseline and rate of change, suggesting that those people who had at least 1, but not all tests, did not have a significant impact on the magnitude or the direction of the associations (Table S2) (41). The results of the sensitivity test-specific cohort analyses confirm the robustness of our primary findings.
Discussion
This is the first prospective study, to our knowledge, to comprehensively investigate in women and men the contribution of muscle strength and physical performance to fracture risk prediction over and above BMD and other known risk factors. The rates of decline in physical performance were significantly associated with a 2- to 3-fold increase in fracture risk in women and men. Baseline measurements of muscle strength and performance were also independently associated with similar magnitude of fracture risk in men. By contrast, low lean mass derived from DXA was not a predictor of increased fracture risk in either gender.
Our data demonstrated the independent association between the rate of decline in 3 measures of physical performance and fracture risk in both genders. There has only been 1 previous study in women that has examined the association between change in muscle performance and fracture risk independent of BMD, although that study only examined hip fractures as an outcome (31). In that prospective study of 7015 women, the greatest rates of decline in 5xSTS and GS were both associated with higher risks of hip fracture (HR: 1.26; 95% CI: 1.03–1.54 and HR: 1.28; 95% CI: 1.03–1.58, respectively) (31).
The rate of decline in muscle strength was not associated with fracture risk in our study. There has also been an earlier study (25) of the Dubbo cohort that, in contrast to the current analysis, reported an association between the deterioration in muscle strength and fracture risk in men. The difference between this previous finding and the current analysis might be explained by differences in study population (33). The previous study was based on phase 1 of the Dubbo cohort in which the participants were, in general, older and recruited 10 years before the current cohort.
The current study also demonstrated the independent association between poor baseline physical performance measures (ie, TGUG, 5xSTS, and GS) and fracture risk in men, which is consistent with previous reports in the literature (7, 22, 42, 43). By contrast, the current study found no association between the 3 baseline muscle performance measurements and fracture risk in women. Indeed, previous literature on the association between muscle performance and fracture risk in women is controversial. One study reported an association between TGUG and nonvertebral and hip but not clinical vertebral fractures (44). On the other hand, 5xSTS test has not been found to be associated with fracture risk (45–47). The results for GS have been mixed, with some studies reporting an association with hip fracture risk (48–50), while others have found no association (45, 47, 51–53). Thus, while baseline muscle performance appears to play a role in fracture risk in men there is little consistent data on fracture risk in women. A recent cross-sectional study in women aged 70 years and over found that lower limb force, a new performance measure, assessed using jumping mechanography, was associated with BMD and fracture risk indices derived by finite element analysis (54). However, prospective studies are needed to support the utility of this new method in the clinical evaluation of physical function in the elderly.
The finding that low lean mass, until recently the most important diagnostic parameter of sarcopenia (16) did not predict fracture risk in either women or men is consistent with findings from other prospective studies (22, 42, 45, 55–58). Recent reports suggest that lean mass derived from DXA is not an accurate measure of muscle mass (21) and of limited value in fracture risk prediction (22). Lean mass derived by DXA can be spuriously increased by increasing adiposity and total body water even when lean mass itself does not change (59). However, 2 prospective studies have reported a positive association between low lean mass measured by DXA and fracture risk (60, 61). The first study included healthy women aged 48 years and over (60) and the second included men aged 63–67 years (61). The relatively younger age of participants in these 2 studies compared to our study may explain the discrepancies between results, as there is likely to be less adiposity in younger participants. Alternative measures of muscle mass, such as quantitative computed tomography, magnetic resonance imaging or vit D3-creatine (D3-Cr) dilution (21, 62) may help to elucidate whether this is a real finding or due to errors in the DXA measurement.
The association between sarcopenia and fracture risk, after accounting for known risk factors including BMD, was apparent only in men. Fracture risk increased progressively from 2.1-fold for probable sarcopenia, 2.7-fold for confirmed sarcopenia to 3.4-fold for severe sarcopenia. This gender difference has been highlighted by other studies (13, 63), including a meta-analysis of 9 prospective cohort studies of community-dwelling older people (13). Consistent with the current study, these studies have reported significant associations between sarcopenia and fracture risk for men but not women. However, the current study explored this association in more depth and found that the association between sarcopenia and fracture risk in men was driven by the effect of baseline muscle strength and performance but not lean mass. That highlights the importance of the regular assessment of muscle strength and performance in daily clinical practice to help identify older people at higher risk of fracture.
The strengths of this study include a well-established cohort with a long follow-up, robust analysis method, and systematic assessment of repeated measurements. The Dubbo study involves a well-established prospective cohort of community-dwelling older women and men, with long follow-up and well-ascertained fractures. We performed a robust analysis adjusting for multiple known risk factors for fracture including age, FN BMD, falls, prior fractures, BMI, smoking, alcohol, and specific comorbidities. Measurements of lean mass, strength, and performance were systematically assessed from multiple visits, allowing for the calculation of annual rates of change and hence assessment of their role in fracture risk. Nonetheless, a few limitations must be noted. The Dubbo cohort consisted of community-dwelling healthy Caucasian women and men who were able to perform all strength and performance tests, and thus our findings may not be generalizable to different races or a less healthy population. However, the test-specific cohort sensitivity analysis, which utilized data on people who were missing some of the tests, revealed similar results, confirming the robustness of the findings. Another limitation is that dementia was not included in our multivariable models because the prevalence was very low (7 women and 2 men).
In summary, this study highlighted the significant association between the rate of decline in physical performance and fracture risk in women and men independent of age, BMD, and other common risk factors. Baseline measurements of muscle strength and performance were also independently associated with fracture risk in men. DXA-driven lean mass on the other hand was not associated with fracture risk in either gender. Thus, our findings suggest that repeated measurements of muscle strength and performance may help identify older people at high fracture risk. Further studies would be required to determine whether incorporating muscle strength and performance measurements to the current fracture risk prediction tools would improve their predictive accuracy.
Acknowledgments
We thank Denia Mang for her technical support. We also thank the participants of Dubbo Study, Australia.
Financial Support: This work was supported by the National Health Medical Research Council Australia Projects 1073430, 1070187, and 1137462. Other funding bodies included the Bupa Health Foundation (formerly MBF Foundation); Mrs Gibson and Ernest Heine Family Foundation; and untied grants from Amgen, Merck Sharp & Dohme, Sanofi-Aventis, Servier and Novartis. The first author is the recipient of an Australian Government Research Training Program (RTP) Scholarship.
Author Contributions: Study design: D.A., D.B., T.T., and J.R.C. Data collection: D.A., T.V.N., J.A.E., and J.R.C. Data analysis and interpretation: D.A., D.B., T.T., and J.R.C. Manuscript drafting: D.A., D.B., T.T., and J.R.C. Revising manuscript content: D.A., D.B., T.T., J.A.E., and J.R.C. Approving the final version of manuscript: D.A., D.B., T.T., T.V.N., J.A.E., and J.R.C. D.A. takes responsibility for the integrity of the data analysis.
Additional Information
Disclosure Summary: D.A., D.B., and T.T. have no competing interests to declare. J.A.E. has consulted for and/or received research funding from Amgen, deCode, Merck Sharp and Dohme, Bayer, and Sanofi-Aventis. T.V.N. has received honoraria for consulting and symposia from Merck Sharp and Dohme, Roche, Servier, Sanofi-Aventis and Novartis. J.R.C. has consulted for and/or given educational talks for Merck Sharp and Dohme, Amgen, Actavis, Sanofi-Aventis, Bayer, and received research support form Amgen. The study sponsors had no role in the study design, collection, analyses, and interpretation of the data, the writing of this manuscript, or the decision to publish this manuscript.
Data Availability: The datasets generated during and/or analyzed during the current study are not publicly available but are available from the corresponding author on reasonable request.
References
