


Abstract
Mild autonomous cortisol secretion (MACS) affects up to 50% of patients with adrenal adenomas. Frailty is a syndrome characterized by the loss of physiological reserves and an increase in vulnerability, and it serves as a marker of declining health.
To compare frailty in patients with MACS versus patients with nonfunctioning adrenal tumors (NFAT).
Retrospective study, 2003-2018
Referral center
Patients >20 years of age with adrenal adenoma and MACS (1 mg overnight dexamethasone suppression (DST) of 1.9-5 µg/dL) and NFAT (DST <1.9 µg/dL).
Frailty index (range 0-1), calculated using a 47-variable deficit model.
Patients with MACS (n = 168) demonstrated a higher age-, sex-, and body mass index–adjusted prevalence of hypertension (71% vs 60%), cardiac arrhythmias (50% vs 40%), and chronic kidney disease (25% vs 17%), but a lower prevalence of asthma (5% vs 14%) than patients with NFAT (n = 275). Patients with MACS reported more symptoms of weakness (21% vs 11%), falls (7% vs 2%), and sleep difficulty (26% vs 15%) as compared with NFAT. Age-, sex- and BMI-adjusted frailty index was higher in patients with MACS vs patients with NFAT (0.17 vs 0.15; P = 0.009). Using a frailty index cutoff of 0.25, 24% of patients with MACS were frail, versus 18% of patients with NFAT (P = 0.028).
Patients with MACS exhibit a greater burden of comorbid conditions, adverse symptoms, and frailty than patients with NFAT. Future prospective studies are needed to further characterize frailty, examine its responsiveness to adrenalectomy, and assess its influence on health outcomes in patients with MACS.
Adrenal tumors are discovered incidentally in 7% of adults undergoing cross-sectional abdominal imaging and a majority of these tumors represent benign adrenal cortical adenomas (1). Adrenal cortical adenomas can be functioning, with either overt or mild adrenal hormone excess, or nonfunctioning, without any detectable hormone excess (2). Mild autonomous cortisol secretion (MACS) is evident in functioning adrenal adenomas and is reported in approximately 50% of patients with adrenal cortical adenomas (1). The 2016 guidelines on management of adrenal incidentaloma published by the European Endocrine Society and the European Network for Study of Adrenal Tumors recommend that cortisol should be measured after an overnight 1 mg dexamethasone suppression test (DST) in any patient with an adrenal mass, and interpreted as a “possible autonomous cortisol secretion” when concentrations are 1.9 to 5.0 μg/dL and “confirmed autonomous cortisol secretion” when >5.0 μg/dL (2).
Patients with MACS demonstrate increased rates of cardiovascular risk factors (e.g., hypertension, obesity, dyslipidemia, and type 2 diabetes mellitus), cardiovascular events, and mortality (3, 4). In addition, patients with MACS have higher prevalence of osteopenia, osteoporosis, and fractures (5, 6). Adrenalectomy results in reversal or improvement of several cardiovascular risk factors in some, but not all, patients with MACS (7). In contrast, patients managed conservatively demonstrate progression of cardiovascular comorbidities (3). Nevertheless, recommendation for adrenalectomy is reserved for patients with a more severe degree of MACS (DST >5 µg/dL) and when comorbidities are already present (2). As such, the majority of patients with MACS are followed conservatively, and identifying a patient most likely to benefit from adrenalectomy remains challenging.
Frailty is a geriatric syndrome characterized by physiological decline and an increased vulnerability to adverse health outcomes, including surgical complications, falls, institutionalization, disability, and death (8). The frailty deficit index has been developed as a measure of this syndrome (9) and been shown to correlate and predict risk for death in a community-dwelling population (2), patients with multiple comorbidities, and patients undergoing surgery (10-12). Frailty index can be also applied to nonelderly patients, and it has been previously shown to predict adverse health outcomes in patients with lupus and younger critically ill patients (13, 14). The frailty index is constructed based on deficits available in the electronic medical record and, thus, can be applied in retrospective studies.
In this study, our objectives were to 1) develop a frailty index applicable to patients with adrenal cortical adenomas utilizing the deficit accumulation model as a unique measure of health status; and 2) determine the prevalence of frailty in patients with MACS and patients with nonfunctioning adrenal tumors (NFAT; DST < 1.9 µg/dL). We hypothesized that patients with MACS are more frail than patients with NFAT.
Methods
This is a retrospective study of consecutive adult patients with adrenal adenomas evaluated at Mayo Clinic, Rochester, Minnesota, between December 8, 2003 and December 31, 2018. The study protocol was approved by the Mayo Clinic Institutional Review Board. Inclusion criteria were: 1) patients ≥20 years of age with incidentally discovered adrenal cortical adenoma and 1 mg DST <5 µg/dL; and 2) follow-up of at least 1 year. Exclusion criteria were 1) exogenous glucocorticoid use; 2) another adrenal disorder, including overt adrenal hormone excess, another concomitant adrenal mass other than adenoma, adrenal insufficiency, or congenital adrenal hyperplasia; and 3) patients with absent current visit information (CVI), a form completed by patients prior to any appointment, with questions of interest within ±1 year from index. Medical records were reviewed for comorbidities and to confirm the diagnosis of adrenal mass and results of DST. CVI was used to extract symptoms and assess activities of daily living (ADL). MACS was defined as cortisol of 1.9 to 5.0 μg/dL after 1 mg DST and no overt features of cortisol excess (2).
We identified 47 variables to construct a frailty index using a deficit accumulation model (Table 1), based on a previously described method (9). In brief, frailty index variables include symptoms, signs, disabilities, ADL, self-rated health, and comorbidities selected based on the following criteria: 1) deficits must be associated with health status; 2) the prevalence of the deficit must generally increase with age, although some clearly age-related adverse conditions can decrease in prevalence at very advanced ages due to survivor effect; 3) deficits must not saturate too early (for example presbyopia is almost universal and saturates at 55 years of age); 4) deficits must cover a range of organ systems; 5) if a single frailty index is to be used longitudinally on the same cohort of patients, the items that make up the frailty index need to be the same; and 6) frailty index must include at least 30 to 40 variables. In our construct of frailty index, we have selected 14 ADLs and 13 symptoms from CVI (out of a total of 66) that fulfilled the above criteria (Supplemental Tables 1 and 2) (15). CVI completed within ± 1 year from the time of DST (index date) was used for each patient. Symptoms that were not relevant or represented acute symptoms were excluded. In addition to ADL and symptoms in CVI, frailty included the following chronic comorbidities: hypertension, congestive heart failure, coronary artery disease, atrial fibrillation, hyperlipidemia, stroke, arthritis, asthma, cancer, chronic kidney disease, chronic obstructive pulmonary disease, dementia, depression, diabetes mellitus, osteoporosis, anxiety, and fractures, all defined based on at least 1 diagnosis code within 5 years prior and up to 6 months after the index date. Diagnosis was based on the International Classification of Diseases, 9th revision code and the United States Department of Health and Human Services (DHHS) definitions of chronic conditions (16). We used 20 chronic comorbidities defined by DHHS to study multimorbidity. However, we excluded HIV infections, autism spectrum disorders, hepatitis, and schizophrenia because of rarity in our population (16, 17). We added anxiety, fracture at osteoporotic site, and atrial fibrillation as these are associated with aging population and common in our population (18-20) All variables in the frailty index were given 1 point when present and 0 points when not present, with the exception of BMI (underweight [<18.5 kg/m2] or obese [≥30 kg/m2] = 1; overweight [25 to <30 kg/m2] = 0.5; normal [18.5 to <25 kg/m2] = 0), and the ADL, climbing 2 flights of stairs without rest (no, can’t do at all = 1; yes, with difficulty = 0.5; yes, with no difficulty = 0), Table 1. The frailty index was calculated as the cumulative points divided by 47 and reported as frailty index with a range of 0 to 1. Frailty was defined based on frailty index: non-frail (frailty index <0.11), prefrail (frailty index of 0.11-0.25), and frail (frailty index ≥0.25) (10, 21-23).
Variables Used to Calculate the Frailty Indexa
| Variables used in frailty index | Points assigned |
|---|---|
| Comorbidities | |
| Body mass index, kg/m2 | <18.5 or ≥30 = 1 25 to <30 = 0.5 18.5 to <25 = 0 |
| Hypertension | Yes = 1, No = 0 |
| Diabetes | Yes = 1, No = 0 |
| Hyperlipidemia | Yes = 1, No = 0 |
| Chronic kidney disease | Yes = 1, No = 0 |
| Coronary artery disease | Yes = 1, No = 0 |
| Cardiac arrhythmia | Yes = 1, No = 0 |
| Atrial fibrillation | Yes = 1, No = 0 |
| Congestive heart failure | Yes = 1, No = 0 |
| Stroke | Yes = 1, No = 0 |
| Cancer | Yes = 1, No = 0 |
| Chronic obstructive pulmonary disease | Yes = 1, No = 0 |
| Asthma | Yes = 1, No = 0 |
| Dementia | Yes = 1, No = 0 |
| Depression | Yes = 1, No = 0 |
| Anxiety | Yes = 1, No = 0 |
| Substance Abuse disorders | Yes = 1, No = 0 |
| Osteoporosis | Yes = 1, No = 0 |
| Fracture at osteoporotic site | Yes = 1, No = 0 |
| Arthritis | Yes = 1, No = 0 |
| Symptoms | |
| Excessive bruising | Yes = 1, No = 0 |
| Joint pain/stiffness | Yes = 1, No = 0 |
| Muscle pain/stiffness | Yes = 1, No = 0 |
| Back pain/stiffness | Yes = 1, No = 0 |
| Weakness in arms/legs | Yes = 1, No = 0 |
| Fall easily | Yes = 1, No = 0 |
| Weight gain >10 pounds | Yes = 1, No = 0 |
| Sleep difficulty | Yes = 1, No = 0 |
| Sad most of the time | Yes = 1, No = 0 |
| Restless and irritable | Yes = 1, No = 0 |
| Anxious or nervous | Yes = 1, No = 0 |
| Difficulty concentrating | Yes = 1, No = 0 |
| Little interest in relationships or activities | Yes = 1, No = 0 |
| Activity of Daily living | |
| Difficulty preparing meals | Yes = 1, No = 0 |
| Difficulty eating | Yes = 1, No = 0 |
| Difficulty dressing | Yes = 1, No = 0 |
| Difficulty using toilet | Yes = 1, No = 0 |
| Difficulty housekeeping | Yes = 1, No = 0 |
| Difficulty climbing stairs | Yes = 1, No = 0 |
| Difficulty bathing | Yes = 1, No = 0 |
| Difficulty walking | Yes = 1, No = 0 |
| Difficulty using transportation | Yes = 1, No = 0 |
| Difficulty getting in/out of bed | Yes = 1, No = 0 |
| Difficulty taking medications | Yes = 1, No = 0 |
| Need assistive device | Yes = 1, No = 0 |
| Need device for breathing | Yes = 1, No = 0 |
| Climbing 2 flights of stairs | No, can’t do at all = 1 Yes, with difficulty = 0.5 Yes with no difficulty = 0 |
aThe Frailty index is calculated as the cumulative points divided by 47 (range of 0-1).
Statistical analysis
Descriptive data are presented as frequencies for categorical variables and medians with ranges for continuous variables. Multiple logistic regression was used to predict DST group status using age, sex, and BMI. A propensity score approach was used to compare the prevalence of comorbidities in the 2 DST groups, adjusting for age, sex, and BMI. Inverse probability weights were estimated using predictions from the logistic regression model and these weights were applied to each subject to determine adjusted (weighted) percentages and P values. Similar subgroup analyses were repeated stratifying on age (<65, 65+). Finally, the Pearson partial correlation was used to quantify the relationship between the Frailty Index and DST after adjusting for age, sex, and BMI. Analyses were run using the R statistical environment (version 3.6.2). Weighted chi-square and Wilcoxon rank sum tests were calculated using the sjstats R package (24). P values less than 0.05 were considered statistically significant.
Results
Of 1081 patients with adrenal adenoma and a DST evaluated at Mayo Clinic during the study period, 2 patients age <20 years were excluded, no consent was obtained from 8 patients, and 268 patients were excluded due to no CVI that included questions of interest within ± 1 year of index. Another 302 patients were excluded due to lack of prior medical records of at least 1 year, and another 58 patients due to another concomitant adrenal disorder (Fig. 1). Ultimately, our cohort included 443 patients with adrenal adenoma: 168 (38%) patients with MACS and 275 (62%) patients with NFAT. Patients with MACS were older at the time of evaluation (median age of 66 years (range, 30-91) in MACS patients vs median age of 59 years (range, 21-84) years in patients with NFAT; P < 0.01). Patients with MACS and NFAT demonstrated a female predominance, without differences between subgroups (MACS, 113 [67%] vs NFAT, 167 (61%); P = 0.17). BMI was similar between patients with MACS and patients with NFAT (Table 2).
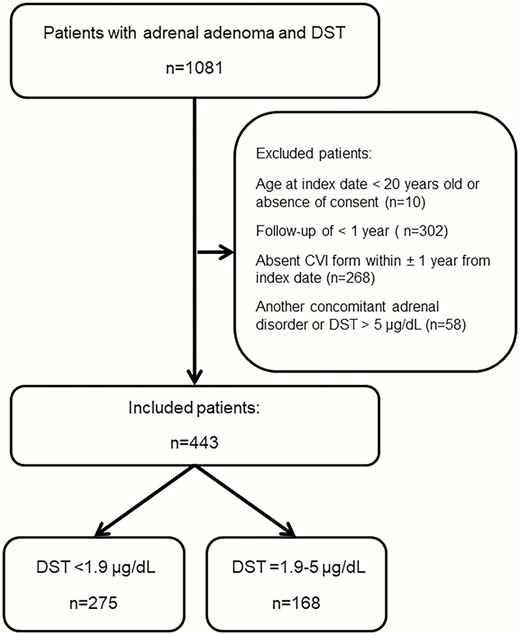
Flow diagram for selection of cohort.
Baseline Characteristics of Patients With Adrenal Adenoma
| DST <1.9 μg/dL | DST = 1.9-5.0 μg/dL | P value | |
| N | 275 | 168 | |
| Age, years; median (range) | 59.5 (20.8-83.9) | 66.1 (29.9-91.2) | <0.001 |
| Women, n (%) | 167 (60.7) | 113 (67.3) | 0.166 |
| DST, μg/dL; median (range) | 1.2 (0.9-1.8) | 2.6 (1.9-4.9) | |
| ACTH, pg/mL; median (range) Missing | 14.0 (5.0-38.0) 207 | 10.5 (4.9-59.0) 116 | 0.066 |
| DHEA-S, mcg/dL; median (range) Missing | 57.0 (1.9-538.0) 216 | 36.0 (14.0-223.0) 123 | 0.006 |
| BMI, kg/m2; median (range) BMI, n (%) 10-18.9 19-25.9 26-29.9 30+ Missing | 32 (15-68) 2 (0.7) 39 (14.2) 63 (22.9) 171 (62.2) 0 | 31 (18-58) 2 (1.2) 35 (21.0) 41 (24.6) 89 (53.3) 1 | 0.041 0.202 |
| Tumor sizea, mm Median (range) Missing | 17 (3-71) 3 | 26 (5-110) 1 | <0.001 |
| Duration of prior medical history, years Median (range) | 21.7 (1.0-42.2) | 22.9 (1.0-40.7) | 0.942 |
| Smoke or other tobacco use, n(%) Never Former Current Missing | 108 (41.2) 96 (36.6) 58 (22.1) 13 | 56 (36.4) 65 (42.2) 33 (21.4) 14 | 0.502 |
| You/Others felt you needed to reduce alcohol consumption, n (%) Missing | 17 (6.9) 30 | 11 (7.0) 11 | 0.979 |
| Elixhauser indexb, sum (median, range) Elixhauser, n (%) 0-1 2-4 5+ | 2 (0-17) 93 (33.8) 113 (41.1) 69 (25.1) | 4 (0-15) 42 (25.0) 64 (38.1) 62 (36.9) | 0.002 0.020 |
Abbreviations: ACTH, adrenocorticotropic hormone; BMI, body mass index; DHEA-S, dehydroepiandrosterone sulfate; DST, 1 mg dexamethasone suppression test.
aLarger diameter (if >1 tumor) on closest image to index date (median days from image to index was 18 days (IQR = 1 day to 87 days prior to index date; range -16 years-9 years after index date).
bElixhauser comorbidity index categorizes comorbidities of patients based on the International Classification of Diseases diagnosis codes; data within 5 years prior to the index date was used for this calculation.
Age, sex, and BMI-adjusted analysis of comorbidities demonstrated a higher prevalence of most comorbidities in patients with MACS as compared with patients with NFAT (Table 3). Hypertension was the most common comorbidity with higher prevalence in patients with MACS (71.4% vs 59.4%) than in patients with NFAT (P = 0.014). Patients with MACS have also demonstrated higher prevalence of cardiac arrhythmias (49.7% vs 39.8%; P = 0.049) and chronic kidney disease (25.3% vs 16.9%; P = 0.044) when compared with patients with NFAT. In contrast, prevalence of asthma was 3 times less prevalent in patients with MACS (14.5% versus 5.4%) than in patients with NFAT (P = 0.005).
Prevalence of Deficits in Patients with MACS and NFAT
| DST <1.9 μg/dL N = 275 | DST = 1.9-5.0 μg/dL N = 168 | P value | |
| Comorbidities, n(%)a | |||
| Hypertension | 59.4 | 71.4 | 0.014 |
| Diabetes | 40.1 | 41.9 | 0.801 |
| Hyperlipidemia | 59.5 | 62.1 | 0.682 |
| Chronic kidney disease | 16.9 | 25.3 | 0.044 |
| Coronary artery disease | 25.5 | 29.5 | 0.411 |
| Cardiac arrhythmia | 39.8 | 49.7 | 0.049 |
| Atrial fibrillation | 6.7 | 10.0 | 0.271 |
| Congestive heart failure | 4.9 | 9.4 | 0.086 |
| Stroke | 8.7 | 10.8 | 0.654 |
| Cancer | 32.1 | 36.8 | 0.371 |
| Chronic obstructive pulmonary disease | 18.4 | 16.6 | 0.700 |
| Asthma | 14.5 | 5.4 | 0.005 |
| Dementia | 4.3 | 6.8 | 0.282 |
| Depression | 28.2 | 21.8 | 0.163 |
| Anxiety | 21.2 | 20.2 | 0.846 |
| Substance Abuse disorders | 14.5 | 13.8 | 1.000 |
| Osteoporosis | 10.7 | 11.7 | 0.855 |
| Fracture at osteoporotic site | 2.4 | 4.6 | 0.169 |
| Arthritis | 40.9 | 45.8 | 0.342 |
| Symptoms, n (%)a | |||
| Excessive bruising | 4.0 | 7.1 | 0.188 |
| Joint pain/stiffness | 25.8 | 28.4 | 0.640 |
| Muscle pain/stiffness | 19.1 | 24.5 | 0.213 |
| Back pain/stiffness | 28.4 | 35.1 | 0.162 |
| Weakness in arms/legs | 10.8 | 20.7 | 0.006 |
| Fall easily | 2.3 | 6.9 | 0.023 |
| Weight gain > 10 pounds | 11.7 | 17.0 | 0.153 |
| Sleep difficulty | 14.9 | 26.3 | 0.005 |
| Sad most of the time | 4.8 | 7.5 | 0.306 |
| Restless and irritable | 8.1 | 10.2 | 0.605 |
| Anxious or nervous | 11.3 | 16.9 | 0.128 |
| Difficulty concentrating | 10.3 | 8.7 | 0.717 |
| Little interest in relationships or activities | 6.5 | 4.5 | 0.530 |
| Activity of daily living, n (%)a | |||
| Difficulty preparing meals | 2.9 | 5.2 | 0.309 |
| Difficulty eating | 0.3 | 0.4 | 1.000 |
| Difficulty dressing | 1.9 | 3.3 | 0.349 |
| Difficulty using toilet | 0.5 | 1.1 | 0.562 |
| Difficulty housekeeping | 11.2 | 10.7 | 0.925 |
| Difficulty climbing stairs | 16.5 | 21.1 | 0.272 |
| Difficulty bathing | 3.8 | 4.3 | 0.805 |
| Difficulty walking | 10.5 | 14.7 | 0.259 |
| Difficulty using transportation | 2.8 | 4.1 | 0.591 |
| Difficulty getting in/out of bed | 2.3 | 3.1 | 0.756 |
| Difficulty taking medications | 2.1 | 4.7 | 0.167 |
| Need assistive device | 8.4 | 11.6 | 0.339 |
| Need device for breathing | 10.1 | 11.1 | 0.899 |
| Climbing 2 flights of stairs “No, can’t do at all” “Yes, with difficulty” “Yes, with no difficulty” | 8.6 27.5 63.9 | 14.7 30.2 55.1 | 0.071 |
aWeighted percentages adjusted for age, sex, and BMI.
Twice as many patients with MACS than patients with NFAT reported symptoms of arm and leg weakness at the time of evaluation (20.7% vs 10.8%; P = 0.006), with a 3-fold higher tendency to fall easily in patients with MACS (6.9% vs 2.3%; P = 0.023). Patients with MACS also more frequently reported having sleeping difficulty (26.3% vs 14.9%; P = 0.005).
Age-, sex-, and BMI-adjusted frailty index was higher in patients with MACS (0.17 [range, 0-0.6] vs 0.15 [range, 0-0.6] in patients with NFAT; P = 0.009) (Fig. 2). The overall prevalence of patients classified as frail and prefrail was 24.2% and 53.7%, respectively, in patients with MACS and 18.0% and 48.7%, respectively, in patients with NFAT (Fig. 3). Subgroup analysis of patients with NFAT and MACS based on age demonstrated no significant differences in the number of comorbidities and frailty index in patients <65 years of age, but significantly higher frailty index in those ≥65 years of age (MACS median, 0.18 [range, 0.03-0.6] vs NFAT median, 0.15 [0.01-0.45]) (Supplemental Table 4) (15). After adjusting for age, sex, and BMI, cortisol after DST was associated with frailty index (partial correlation = 0.14; P = 0.004), Supplemental Figure 1 (15).
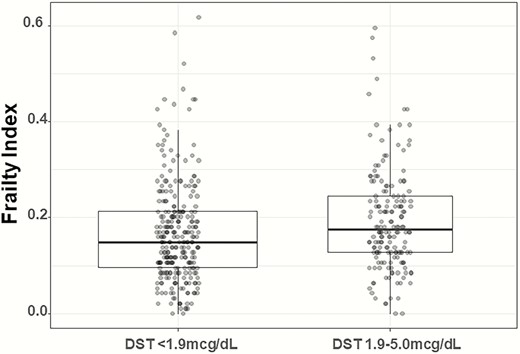
Distribution of frailty index in patients based on DST category.
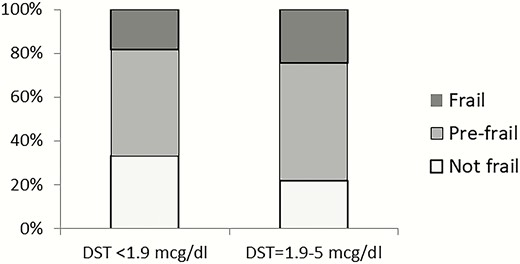
Proportion of frail, prefrail, and not frail patients based on DST category.
Discussion
In this study, we found that patients with MACS present with a higher burden of comorbidities, adverse symptoms, and frailty compared with patients with NFAT.
Frailty is a state of increased vulnerability to adverse outcomes and is a unique way of looking into overall health status (9). Frailty index is one of the methods of frailty assessment that works on the principle that multiple small deficits may not be clinically significant, however, when coexisting can have an impact on overall health (14). Frailty, assessed through frailty index, was previously reported to predict adverse health outcomes in the community-dwelling older population and patients with comorbidities such as HIV, systemic sclerosis, and chronic kidney disease (25-27).
In our study we have found that patients with MACS presented with a higher median frailty index when compared with patients with NFAT. Using a frailty index cutoff of 0.25 to define frailty, 24% of patients with MACS were frail, versus 18% of patients with NFAT, confirming that mild but chronic cortisol excess is associated with frailty. Previous studies on patients without adrenal mass reported higher cortisol concentrations, blunting of circadian cortisol secretion, and suboptimal suppression with DST in frail patients when compared to non-frail patients (28-30). Patients with MACS have mild but chronic exposure to endogenous cortisol, possibly making them vulnerable to premature aging and development of frailty. Notably, median frailty index of 0.15 in our patients with NFAT was higher than the frailty index of 0.13 reported in a community-dwelling population of similar age (31, 32). One of the explanations for higher frailty index in patients with NFAT could be abnormal cortisol secretion not detected by the standard-of-care DST. Patients with NFAT have been previously reported to have lower skeletal mass and higher prevalence of cardiovascular risk factors in comparison with patients with no adrenal mass (3, 33). Another explanation for higher frailty index in patients with NFAT is a selection bias in our cohort, as patients diagnosed with NFAT represent patients who seek medical attention and are more likely to be diagnosed with other medical conditions. Subgroup analysis based on an age cutoff of 65 years further demonstrated a higher frailty index only in older patients with MACS as compared to those with NFAT. This could be explained by a longer duration of exposure, or possibly a higher susceptibility of older patients to cortisol excess, and thus higher prevalence of comorbidities and symptoms contributing to frailty in older patients with MACS.
Fall risk and ADLs are important components of physical health evaluation of an aging individual. Besides direct fall-related injury, the presence of fear of falling increases risk of all-cause mortality in the aging population (34), through a multifactorial process associated with greater functional decline, anxiety, and depression along with increased use of medical services (35, 36). In our study, patients with MACS have 3-fold higher tendency to fall in comparison to patients with NFAT, suggesting an effect of mild abnormal cortisol secretion on multiple systems. Patients with MACS have been reported to have a higher risk of fractures, thought to be related to cortisol-induced abnormal bone metabolism, and abnormal bone density and bone quality (5). The higher tendency to fall in patients with MACS may reflect underlying deconditioning and sarcopenia, and it represents an additional risk factor for fractures.
We found that patients with MACS have a higher prevalence of hypertension, cardiac arrhythmia, and chronic kidney disease in comparison with patients with NFAT. Patients with MACS were previously reported to have a high prevalence of cardiovascular risk factors (such as hypertension, obesity, dyslipidemia, and type 2 diabetes) (3, 4). With follow-up, patients with MACS are more likely to develop or worsen the existing cardiovascular risk factors (3), while adrenalectomy resulted in improvement in several cardiovascular risk factors (7). A recent study found a higher prevalence of atrial fibrillation at baseline (8.5% vs 3.1%), as well as at the end of a 7.7 year follow-up period (20% vs 12%) in patients with MACS as compared with patients with NFAT (37). In our study, higher prevalence of atrial fibrillation in patients with MACS (10% vs 6.7% in NFAT) has not reached statistical significance. However, almost half of patients with MACS were diagnosed with cardiac arrhythmias (as opposed to 39.8% in NFAT). It is unclear whether some of the diagnoses of atrial fibrillation in our study were included under a more general diagnosis of cardiac arrhythmia; nevertheless, our results are concordant with the recently reported association of hypercortisolism with abnormal cardiac conduction. We found that prevalence of CKD was significantly higher in patients with MACS compared with NFAT, possibly due to direct effect of cortisol on kidney function, or due to a higher prevalence of hypertension in patients with MACS. Another interesting finding from our study was the lower prevalence of asthma in patients with MACS in comparison to those with NFAT. It is possible that chronic cortisol secretion in MACS is protective or curative in asthma, similar to low dose prednisone therapy.
The strengths of this study are the relatively large sample size, robust inclusion criteria, and the novel use of frailty index to characterize the overall health status of patients with adrenal tumors. In the construction of a frailty index to assess our population, we followed the recommended construct previously validated in other studies. Inclusion of ADLs and symptoms in addition to comorbidities resulted in a more representative assessment of overall health status in our population. Our study has several limitations. Due to retrospective nature of our study, information bias is likely. We relied on ICD9 codes for diagnosis of comorbidities and CVI information reported by patients at the time of the visit. We attempted to minimize this bias by excluding patients with <1 year clinical history at our institution or incomplete CVI. As patients were evaluated at the outpatient endocrine clinic, selection bias towards patients with other endocrine conditions is likely, and prevalence of diabetes (the only endocrine condition included in the frailty index) could be inflated. We acknowledge that patients evaluated at a tertiary center may have a higher frailty index than those evaluated for adrenal adenoma in other settings. We included only patients with available DST and at least 1 year of follow-up, possibly reflecting a higher level of care or morbidity in our cohort, and our results may not be generalizable to other settings. While the overall prevalence of frailty may be higher in our patients, the difference between MACS and NFAT should represent a true estimate. In addition, while we have demonstrated an association of frailty with MACS, we are not able to establish causality, and it is possible that frail patients are more likely to have an abnormal DST (as opposed to MACS causing frailty). Frailty index in patients with MACS needs to be further validated prospectively.
Frailty index assessment in patients with adrenal adenomas may have several clinical implications. Frailty index is easy to calculate (based on patient current visit information and diagnostic codes) and integrate in clinical care. It could be useful in baseline assessment when discussing management options of follow-up versus adrenalectomy with the patient. Frailty index could also be followed longitudinally in a patient with MACS followed conservatively to estimate any decline in health, and possibly reassess management options. Frailty index potential reversibility with adrenalectomy could be a more objective measure of therapeutic success and could be integrated in both clinical and research settings.
In conclusion, we assessed frailty in patients with adenomas using a comprehensive frailty index constructed from 47 symptoms, ADL, and comorbidities. In a sex-, age-, and BMI-adjusted analysis, we found that patients with MACS present with a higher prevalence of frailty when compared with patients with NFAT, suggestive of detrimental effect of cortisol on aging. Frailty index could be a useful clinical tool to individualize discussion on management options with patients with MACS. The impact of adrenalectomy on reversal of frailty needs to be determined in longitudinal studies.
Abbreviations
- ADL
activities of daily living
- BMI
body mass index
- CVI
current visit information
- DST
dexamethasone suppression test
- MACS
mild autonomous cortisol secretion
- NFAT
nonfunctioning adrenal tumors
Acknowledgments
Financial Support: This research was supported by the James A. Ruppe Career Development Award in Endocrinology (I.B.) and the Catalyst Award for Advancing in Academics from Mayo Clinic (I.B.). This research was partly supported by the National Institute of Diabetes and Digestive and Kidney Diseases (NIDDK) of the National Institutes of Health (NIH) under award K23DK121888 (to I.B.). The views expressed are those of the author(s) and not necessarily those of the National Institutes of Health.
Additional Information
Disclosure Summary: I.B. reports advisory board participation with Corcept and HRA Pharma outside the submitted work.
Data Availability: The datasets generated during and/or analyzed during the current study are not publicly available but are available from the corresponding author on reasonable request.
References
