


Abstract
Malignant thyroid tumor with distant metastasis is associated with poor outcome. Early detection of distant metastasis is of great clinical importance.
Thyroid tumor infiltrated with T cells can serve as a biomarker for monitoring metastasis.
A retrospective analysis was performed of patient clinical samples collected between 2012 to 2018, using T-cell receptor sequencing (TCR-seq) for clinical exploration.
This study took place at Zhejiang Cancer Hospital.
Sixty-eight patients with papillary thyroid cancer (PTC) (distinct metastatic status) and 21 patients with benign nodules were enrolled. All patients had not received any treatment before surgery.
The characteristics of TCRβ complementary-determining region 3 (CDR3) for each patient were determined by high-throughput sequencing.
The TCRβ diversity of malignant tumors is significantly higher than benign nodules both in blood and tumor samples (Shannon index, blood, P < .01; tumor, P < .001). The malignant tumors with distant metastasis or invasiveness showed lower TCRβ diversity than nonmetastasis (Shannon index, P < .01) or noninvasive (Shannon index, P < .01) malignant tumors. Analysis of the Morisita-Horn similarity index indicated significant TCRβ repertoire similarity between tumor and blood in distant-metastatic patients (comparison with nonmetastasis, P < .05). According to the discrepancy of the CDR3 among patients with different clinicopathological status, the classifier was constructed to discriminate distant-metastatic individuals. A promising area under the curve value of 83.8% was obtained with the number of overlapping CDR3 clonotypes.
The availability and reliability of TCR-seq render it prospective to translate these intrinsic attributes into clinical practice for monitoring distant metastasis in PTC patients.
Thyroid cancer is the most common endocrine cancer in the world, and it is unique in that benign thyroid nodules have been found in up to 35% of cases (1). Globally, the significant increase of thyroid cancer incidence is predominantly due to an increased number of cases of diagnosed papillary thyroid cancer (PTC) (2, 3), which is the most common subtype, representing about 80% to 90% of thyroid cancers (4). Traditionally, thyroid nodules are evaluated by palpation, ultrasound, and fine-needle aspiration (FNA) cytology. However, approximately 15% to 30% of thyroid nodules assessed by FNA are not definitely benign or malignant (5). The uncertainty is mainly attributed to their indeterminate cytologic phenotypes, encompassing “atypia (or follicular lesion) of undetermined significance,” “follicular neoplasm or suspicious for follicular neoplasm,” and “suspicious for malignancy” (6, 7). A continually updated next-generation sequencing panel (ThyroSeq), which simultaneously detects point mutations, indels, gene fusions, copy number alterations, and gene expression, has made great progress in reducing the overdiagnosis of benign thyroid disease (8-11).
The PTC commonly follows a less-severe clinical course; however, distant metastases of tumor cells that disseminate from primary PTC to locations mainly including lung, bone, and brain have demonstrated unfavorable prognosis (12-14). Previous studies have shown early detection and appropriate management of the metastatic lesion can lead to ameliorated long-term survival (15, 16). Consequently, the early detection of distant metastasis derived from primary PTC is of great clinical significance. Nevertheless, neither FNA cytology nor ThyroSeq are capable of metastasis detection. Thus, we proposed a hypothesis that the high-dimensional characteristics of thyroid tumor infiltrated by T cells can serve as a biomarker for monitoring tumor malignancy and indicating metastasis, to further guide treatment decisions, leading to more scientific disease management and prolonged overall survival for patients.
T-cell receptor (TCR) is a mediator for T cells to recognize the antigen. The majority of TCRs are heterodimers that consist of α and β chains. The variable regions of TCRα chains are encoded by a V (variable) gene and J (joining) gene, whereas the TCRβ chains further include a D (diversity) gene (17). Additionally, TCRβ chains contain 3 variable regions, namely complementary-determining regions (CDR1-3); among them CDR3 can directly interact with antigen, which is encoded by the junctional region of V, D, and J genes. Consequently, CDR3 is highly variable and frequently used to determine T-cell clonotype (18). Whole TCRs in one individual are termed the TCR repertoire, which can reflect the overall immune status during disease initiation and progression, indicate prognosis, and evaluate clinical outcomes (19). TCR repertoires have been characterized within different cancer types, including colorectal cancer (20), esophageal squamous cell carcinoma (21), ovarian cancer (22), pancreatic cancer (23), breast cancer (24, 25), and a large-scale pancancer study (26). The clues derived from TCR repertoires of cancer patients will be considerably informative for developing novel clinical applications.
In this study, we characterized the tumor TCRβ repertoires with matched peripheral blood and normal tissues. The TCRβ CDR3 sequences were amplified by multiplex polymerase chain reaction (PCR) with several V-primers and J-primers; these amplicons were then subjected to high-throughput sequencing. We demonstrated TCRβ repertoires are distinct between benign nodules and malignant tumors regarding T-cell clonotypes and diversity. More intriguing, we further shed light on the discrepancy of TCR repertories within PTC, discriminating the distant-metastatic and nonmetastatic patients. This evidence renders it promising to diagnose and treat metastatic PTC patients more precisely to achieve a better prognosis.
Materials and Methods
Specimen collection
Sixty-eight patients with PTC (20 distant metastasis and 46 distant metastasis free) and 21 patients with benign nodules were enrolled from Cancer Hospital of University of Chinese Academy of Sciences (Zhejiang Cancer Hospital). All patients had not received any treatment before surgery, which could possibly reshape the immune repertoires of the patients. This study was approved by the institutional review board of Zhejiang Cancer Hospital. Written informed consent was obtained from each patient. Thyroid tumor tissues, normal tissues, and peripheral blood were collected during surgery. Clinicopathological characteristics (including age, sex, tumor stage, tumor size, metastasis, invasiveness, and other pathological features) of patients were obtained from the hospital’s case management system (Table S1) (27). All the solid tumor specimens and peripheral blood were placed in –80°C for long-term storage. High-quality genomic DNA was extracted from the frozen tissues and blood.
High-throughput sequencing of T-cell receptor β
The complementary-determining region 3 (CDR3) of T-cell receptor β chains were amplified by 2 rounds of multiplex PCR (PCR1 and PCR2). During PCR1, 10 cycles were run to amplify all possible V(D)J combinations with 32 forward primers of V genes, and 13 reverse primers of J genes from QIAGEN Multiplex PCR Kit. The PCR1 reaction conditions were: 1 cycle at 95°C for 15 minutes, 10 cycles at 94°C for 30 seconds, and 10 cycles at 60°C for 90 seconds and extension at 72°C for 30 seconds. PCR2 was performed employing Illumina universal primers. Paired-end sequencing libraries were generated with a read length of 100 base pairs by the Illumina NovaSeq platform.
Sequencing data analysis
Sequencing data were processed and analyzed using the following procedure: (1) sequencing reads of low quality or primers missing for multiplex PCR were removed from the clean data (28); (2) the remaining high-quality pair-end reads were merged to obtain contigs by Pear (29); (3) the merged reads were aligned to the V, D, and J germline sequences, and the CDR3 regions were spotted using MiXCR (30). The Shannon index and clonality were used to characterize the diversity of the T-cell repertoire. The Shannon index was calculated based on the clonal abundance of all productive TCR sequences, which could reflect both the relative number of clonotypes and the relative abundance of each clonotype. Clonality was defined as normalized Shannon’s entropy, determined by dividing Shannon’s entropy by the natural logarithm of the unique clonotypes (31). The Morisita-Horn overlap index (MH overlap) was adopted to determine similarities of each TCR repertoire (32).
Statistics analysis
TCR clones of healthy peripheral blood were acquired from another study on lung cancer (33). The significance of difference between subgroups was estimated using the Wilcoxon test. A 2-sided P value of less than .05 was considered statistically significant.
Receiver operating characteristic curve construction
The ROC curve was constructed by R package pROC (version 1.16.2). Briefly, the geometric mean of relative overlap frequencies of the CDR3 clonotype of any sample compared with each sample from 2 different categories was calculated and averaged. Then, the average value from 2 categories was subtracted, representing the difference in distance of the sample from 2 categories. Finally, this difference in distance was used as a threshold to identify each sample by ROC curves. To better discriminate the distant-metastatic patient, we calculated the number of overlapping CDR3 clonotypes between tumor tissues and blood samples for each PTC patient.
Results
Specimen collection and clinicopathological status of each patient
We collected 231 specimens from 89 patients, among whom 21 patients were diagnosed with benign nodules including 3 thyroid adenomas, 1 subacute thyroiditis, and 17 nodular goiters with or without other benign lesions; 68 patients were diagnosed as malignant PTC including 20 cases with distant metastasis, 22 with lymphatic metastasis and 24 metastasis free. Clinicopathological characteristics comprising patient age, sex, tumor diameter, tumor stage, metastatic status, and invasive status are listed in Table 1. To better understand the specimen distribution, the numbers of patients with different tissue origins and clinicopathological status are also depicted in Fig. 1.
Clinicopathological characteristics comprising patients’ age, sex, tumor diameter, tumor stage, metastatic status, and invasive status
| Total | Benign | Malignant | |
|---|---|---|---|
| Age, y | |||
| < 55 | 60 (67.4%) | 12 (13.5%) | 48 (53.9%) |
| ≥ 55 | 29 (32.6%) | 9 (10.1%) | 20 (22.5%) |
| Sex | |||
| Male | 26 (29.2%) | 3 (3.4%) | 23 (25.8%) |
| Female | 63 (70.8%) | 18 (20.2%) | 45 (50.6%) |
| Tumor diameter, cm | |||
| ≤ 3 | 57 (64%) | – | 57 (64%) |
| > 3 | 11 (12.4%) | – | 11 (12.4%) |
| Tumor stage | |||
| I | 42 (47.2%) | – | 42 (47.2%) |
| II | 19 (21.3%) | – | 19 (21.3%) |
| III | 1 (1.1%) | – | 1 (1.1%) |
| IV | 6 (6.7%) | – | 6 (6.7%) |
| Metastasis | |||
| Free | 26 (29.2%) | – | 26 (29.2%) |
| Lymph node | 22 (24.7%) | – | 22 (24.7%) |
| Distant | 20 (22.5%) | – | 20 (22.5%) |
| Invasiveness | |||
| Noninvasive | 36 (40.4%) | – | 36 (40.4%) |
| Mini-invasive | 19 (21.3%) | – | 19 (21.3%) |
| Invasive | 13 (14.6%) | – | 13 (14.6%) |
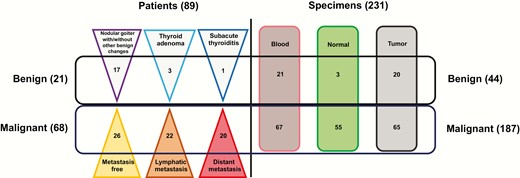
Thyroid tumor specimen collection: The left panel shows the numbers of patients with benign nodules and malignant tumors (including metastatic status); the right panel shows the numbers of specimens with different tissue origins.
Tumors show more T-cell receptor β complementary-determining region 3 clonotypes and higher heterogeneity than normal tissues
The TCRβ CDR3 sequence of each specimen was determined by high-throughput sequencing after multiplex PCR using several V and J primers. After bioinformatics analysis, we performed a series of statistical analyses to determine the overall CDR3 diversity from different tissues. Results showed that peripheral blood had the highest number of unique clonotypes (median = 16 120) and the number in tumor tissues (median = 4950) was approximately 2.6-fold larger compare against normal tissues (median = 1917, P < .001) (Fig. 2A). The clonality is a metric to evaluate TCR clonal expansion. As shown in Fig. 2B, tumors (median = 0.176) and normal tissues (median = 0.178) had the same level of clonality (P = .93), whereas blood had significantly lower clonality (median = 0.112) than other tissues (P < .001). Furthermore, the Shannon index was used to depict TCRβ diversity. Consistent with what was observed in the clonotype, the Shannon index in tumor tissues was higher than normal tissues (P < .001) and blood had the highest TCRβ diversity (Fig. 2C). The fraction was calculated to represent the distribution of TCR clonal frequency, and here we used a line chart to summarize the sequential fractions. The blood showed a sharper line than normal and tumor tissues, indicating that blood has less clonal expansion (Fig. 2D). All these metrics indicate that the TCRβ CDR3 is more diverse in tumor tissues than in normal tissues.
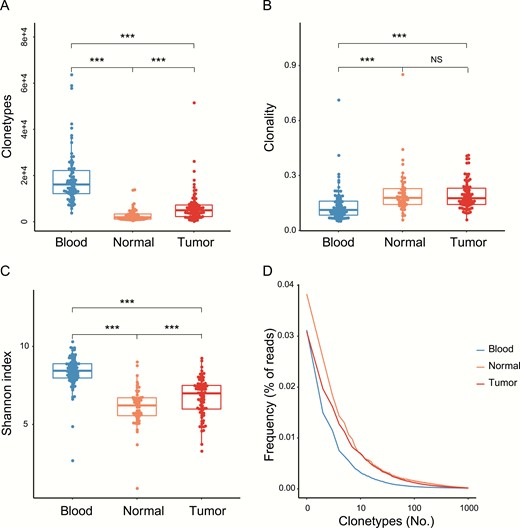
Tumor tissues show more complementary-determining region 3 (CDR3) clonotypes and higher diversity than normal tissues. A, Clonotypes represent the unique CDR3 amino acid sequence. B, Clonality represents the distribution of clone sizes and is defined as 1 minus the normalized Shannon entropy of the T-cell receptor β (TCRβ) abundances. C, Shannon index and D, frequency, distribution of blood and normal and tumor tissues. *P less than .05; **P less than .01; ***P less than .001.
Malignant tumors show more diverse T-cell receptor β repertoires than benign nodules
To thoroughly elucidate the disparities of TCRβ features between benign and malignant tumors, we collected peripheral blood specimens from healthy people as controls (33). Results showed that the healthy blood had a smaller number of clonotypes (median = 10 623) than benign blood (median = 13667, P < .01) and malignant blood (median = 16 658, P < .001). Moreover, the malignant blood exhibited a higher number of CDR3 clonotype than benign blood, albeit not at statistical significance (Fig. 3A, P = .15). The same situation was observed in the Shannon index analysis. Malignant blood (median = 8.58) showed significantly higher CDR3 diversity than benign blood (median = 8.03, P < .01) and healthy blood (median = 8.14, P < .001, Fig. 3B). These results suggest that the malignant tumors have extensive heterogeneity, and accordingly, the matched malignant blood also presents higher CDR3 diversity.
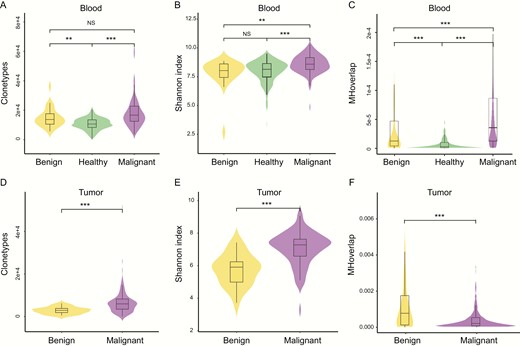
Malignant tumors show more diverse T-cell receptor β (TCRβ) repertoires than benign nodules A, clonotypes, B, Shannon index, C, Morisita-Horn (MH) overlap in blood specimens, D, clonotypes, E, Shannon index, F, MH overlap in tumor tissues. MH overlap index is used to determine similarities of TCR repertoires between samples, *P less than .05; **P less than .01; ***P less than .001.
To assess the intrasimilarity of patients with the same disease status, we calculated the MH similarity index of any 2 blood specimens within healthy, benign, and malignant people. In patients with a malignant tumor, any 2 blood specimens had significantly higher similarity than benign patients (P < .001) and healthy people (P < .001, Fig. 3C). This result suggests that more similar antigens of pathogenic mutations are generated in patients with a malignant thyroid tumor, leading to a higher similarity in TCRβ repertoires.
Additionally, TCRβ repertoires from tumor tissues reflect a T-cell infiltrating process. The overall clonotype (median = 5938, P < .001) and diversity (median = 7.28, P < .001) of CDR3 were significantly higher in malignant tumor tissues than in benign tumor tissues (median = 2890; 5.90, Fig. 3D and 3E). The MH similarity index was also calculated to compare the intraoverlap of tissue CDR3 within any 2 benign or malignant patients. Interestingly, the similarity of tissue CDR3 was lower in malignant tumor tissues than in benign tumor tissues (P < .001, Fig. 3F), which was contrary to the observation in blood, and we inferred the possible cause is that malignant tumor tissue has a higher heterogeneity in the TCR repertoire, therefore less similarity was observed.
T-cell receptor β repertoire diversity is distinct among malignant tumor subtypes
The malignant tumors consisted of several subtypes in this study, with respect to discrepancies in metastasis status, invasiveness, tumor stages, tumor sizes, and malignant concomitant benign features. The Shannon index shows that malignant tumors with distant metastasis have lower CDR3 diversity (median = 6.46) than with lymph node (LN) metastasis (median = 7.53, P < .001) or nonmetastasis (median = 7.26, P < .01) in tumor tissues, whereas the differences in diversity are nonsignificant in blood specimens (Fig. 4A). It is therefore indicated that tumor tissues with distant metastasis undergo the most extensive TCR clonal expansion due to hypermalignancy.
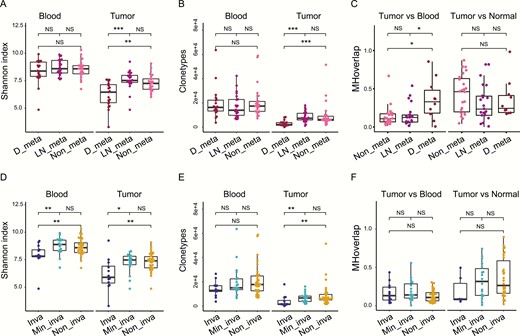
T-cell receptor β (TCRβ) repertoires are distinct within malignant tumor subtypes. A, Shannon index comparison of different metastasis subtypes in tumor and blood T-cell clones. B, Clonotypes comparison of different metastatic subtypes in tumor and blood T-cell clones. C, Morisita-Horn (MH) overlap within tumor vs blood or tumor vs normal group of different metastatic subtypes. D, Shannon index comparison of different invasive subtypes in tumor and blood T-cell clones. E, Clonotypes comparison of different invasive subtypes in tumor and blood T-cell clones. F, MH overlap within tumor vs blood or tumor vs normal group of different invasive subtypes. *P less than .05; **P less than .01; ***P less than .001. Inva, invasive; Min_inva, minimally invasive; Non_inva, noninvasive.
Our results also showed the same trends in subtypes with different invasiveness. Invasive subtypes exhibited less diversity (median = 5.90) than mini-invasive (median = 7.47, P < .05) and noninvasive (median = 7.39, P < .01) subtypes in tumor tissues (Fig 4D). In blood specimens, invasive subtypes (median = 7.82) also exhibited significantly less diversity than the other 2 subtypes (mini-invasive, median = 8.88, P < .01; noninvasive, median = 8.59, P < .05; Fig 4D). The CDR3 clonotype also reflects TCRβ diversity, therefore we observed that distant-metastatic (median = 2127) and invasive subtypes (median = 1557) had fewer clonotypes than other subtypes (LN metastasis, median = 7368, P < .001; nonmetastasis, median = 6267, P < .001; mini-invasive, median = 6699, P < .01; noninvasive, median = 6029, P < .01) in tumor tissues (Fig. 4B and 4E), whereas the clonotypes in blood were not significantly different across subtypes (Fig. 4B and 4E).
Similarly, we compared the TCRβ repertoires overlap of different subtypes in the tumors vs blood group and the tumors vs normal tissue group using the MH similarity index. Results showed that distant-metastatic subtypes had a higher TCRβ similarity in the tumors vs blood group than LN metastasis (P < .05) and nonmetastatic subtypes (P < .05, Fig. 4C), whereas the MH similarity index in the tumors vs normal tissue group showed no significant difference among distant, LN, and nonmetastatic subtypes (Fig. 4C). The MH similarity index in all groups indicated no significant difference across subtypes with different invasiveness (Fig. 4F). These results suggest that distant metastasis in blood generates collective TCRβ repertoires with original tumor tissues, whereas the normal tissues have no tumorigenic antigen production, therefore they have lower TCRβ similarity with tumor tissues.
Moreover, the Shannon index and MH similarity in subtypes stratified by other clinicopathological characteristics were compared as well, including patient sex, tumor stage, tumor size, and the status of malignancy. However, most of these comparisons yielded no statistical significance except for the MH similarity comparison of the malignant concomitant benign phenotype against malignant phenotype (Supplementary Fig. 1) (27).
Discriminating distant-metastatic patients by various complementary-determining region 3 indexes
The specificity in TCR repertoires of benign nodules, malignant tumors, and distant-metastatic lesions may provide the possibility of discriminating different patient clusters. As mentioned in “Materials and Methods,” we gauged the geometric mean of relative overlap frequencies (GMROFs) of CDR3 to calculate the distance between each patient cluster, then the ROC curve was delineated to evaluate performance of this classifier. The area under the curve (AUC) values of tumor tissues and blood samples were 97.8% and 83.5%, respectively, for discriminating benign nodules and malignant tumors (Supplementary Fig. 2A and 2B) (27). Although discriminating benign nodules and malignant PTC is of less clinical significance, it remains informative for us to distinguish other patient clusters by TCR repertoires. Following this evidence, we completed calculations of the GMROF for discriminating distant-metastatic and nondistant-metastatic patients, which is more significant for clinical management. The AUC values were 75.9% and 62.7% by using tumor tissues and blood samples, respectively (Fig. 5A and 5B). To improve the performance of the classifier in distant-metastatic cases, the number of overlapping CDR3 clonotypes was calculated between tumor tissues and blood samples. We believe a higher number of overlapping clonotypes, representing a higher similarity of tumor and blood samples, are more likely to occur in distant-metastatic patients. A promising performance with an AUC value of 83.8% was observed in the ROC curve (Fig. 5C), suggesting distinct TCR repertories between distant-metastatic and nondistant-metastatic patients.
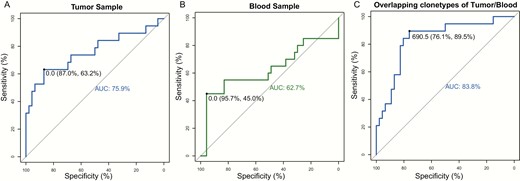
The distant metastasis discriminating receiver operating characteristic curve for geometric mean of relative overlap frequencies of complementary-determining region 3 (CDR3) using A, tumor samples and B, blood samples. C, The classification power of overlapping CDR3 clonotypes of tumor and blood samples for discriminating distant metastatic patients. The area under curve (AUC) is indicated in the figure.
Discussion
In this study, we first characterized the TCRβ repertoires of thyroid tumor patients by high-throughput sequencing. Compared with traditional staining, high-sensitivity TCR sequencing (TCR-seq) allows scientists to obtain bulk T-cell repertoires directly with genomic DNA input, avoiding missing any rare TCR clone (34). Comprehensive TCRβ repertoires were compared across varying groups, such as malignant vs benign and distant metastatic vs nondistant metastatic. The primary conclusions include 1) the diversity of the TCRβ repertoires in tumor tissues is higher than in normal tissues; 2) in malignant patients, diversity of the TCRβ repertoires is negatively associated with the degree of malignancy; and 3) the diversity of the TCRβ repertoires in malignant tumors are higher than in benign nodules.
Notably, our results show that malignant PTC tumors have significantly higher TCRβ diversity than benign tumors (Fig. 3B and 3E). On the contrary, some studies of other tumor types, such as clear cell renal cell carcinomas (35), colorectal tumors (20), esophageal squamous cell carcinoma (21), and breast cancer (25), have reported that TCRβ diversity in tumor tissues is lower than in adjacent normal tissues. However, epidemiological and histological data have shown that PTC always occurs in the microenvironment under thyroid inflammation, such as Hashimoto thyroiditis (36). A recent study reported that the frequent coexistence of Hashimoto thyroiditis and PTCs should not be neglected (37). Although how PTC and inflammation were functionally correlated is still debatable, their link has long been recognized. These pieces of evidence demonstrated that the thyroiditis might be a precancerous condition. Furthermore, a previous study also confirmed that significantly more presence of lymphocytic infiltration is observed in PTC patients than in benign patients (38). In conclusion, the microenvironment of malignant PTC provides excess inflammatory T-cell infiltration.
We further found the PTC TCRβ diversity is associated with tumor malignancy. PTCs with distant metastasis have lower TCRβ diversity than those with LN metastasis or no metastasis. Similarly, PTCs with high invasiveness have lower TCRβ diversity than mini-invasive and noninvasive tumors. The Cancer Genome Atlas and other studies reported that PTC has a low frequency of somatic alterations, with the majority harboring mutually exclusive activating mutations in BRAF (60%) and RAS-family genes (13%), as well as other fused oncoproteins (39, 40). In addition, a TCR repertoire analysis of multifocal PTC showed that the number of nonsynonymous somatic mutations is small in tumors with low mutation rates, but these mutations still play an essential role in activating neoantigen-specific tumor-infiltrating lymphocytes (41). A recent report further demonstrated that although thyroglobulin harbored the somatic mutation in only 3% of their PTC cohort, it is significantly enriched in the metastatic patients, which revealed apparent clonal expansion (42). Therefore, clonal expansion might be the reason for less TCRβ diversity in the distant metastatic and invasive tumors. However, the malignant evolution in our cohort requires further substantiation.
The MH similarity analysis further revealed the disparities in TCRβ repertoire among subtypes with different metastatic status and invasive degrees. Distant-metastatic subtypes exhibited higher overlap in the tumor vs blood group than the subtypes with LN metastasis or nonmetastasis, whereas the invasive subtypes have no significant difference in similarity compared with the mini-invasive or noninvasive subtypes (Fig. 4C and 4F). These results are predominantly because an invasive tumor does not penetrate blood vessels as does the metastatic tumor. Thus, no common tumorigenic antigen was shared between tumor tissues and blood samples, so there appears to be no significant difference in TCRβ MH similarity in the tumor vs blood group.
Assessing the TCRβ discrepancy between malignant and benign nodules or between distant-metastatic and nondistant-metastatic PTC, we strived to construct a classifier to stratify patients with different TCRβ features. The GMROF of CDR3 was employed to calculate the distance of any sample to other patients’ clusters. We obtained excellent AUC values 97.8% and 83.5% in tumors and blood samples, respectively. Because there is no clear premalignant phase of PTC and the routine FNA cytology test can specify most PTC cases, discriminating malignant and benign nodules is of less clinical significance. Nonetheless, we wondered whether the discrepancy of TCRβ within malignant PTC will facilitate the identification of distant-metastatic patients. This detection is always implemented with postoperative radioactive iodine scanning (43). In this study, the GMROF was calculated between distant-metastatic and nonmetastatic patients; for the tumors and blood samples the AUC values were 75.9% and 62.7%, respectively. Furthermore, the numbers of overlapping CDR3 clonotypes between tumors and blood samples were calculated and used to construct the distant metastasis ROC curve. The AUC value of this metric is 83.8%, suggesting the robust performance of tumor tissues in company with blood samples. This result is consistent with the observation of significantly higher TCRβ MH similarity between tumor and blood samples. Taking advantage of the specific interaction of TCR and tumorigenic antigen, the multidimensional TCRβ repertoires can be used as an excellent biomarker to discriminate thyroid patients with distinct attributes. The clinical significance of early detection of distant metastasis can facilitate appropriate management of the metastatic lesion and lead to long-term survival in patients. However, owing to the lack of other thyroid tumor subtypes, such as follicular thyroid carcinoma or hepatocellular carcinoma, extensive validation is needed in further research.
Our model requires collecting only tissues or blood, sequencing the TCRβ repertoires, and fitting the model. No prior knowledge of the TCR specificities is needed, and no additional experiments are required to enrich tumor-specific TCRs. The availability and reliability of TCR-seq render it promising to translate these intrinsic attributes into clinical practice. Predictably, the comprehensive immune infiltration states elucidated by TCR-seq will promote the diagnostic and therapeutic benefits across various cancer types.
Abbreviations
- AUC
area under the curve
- CDR3
complementary-determining region 3
- D
diversity
- FNA
fine-needle aspiration
- GMROF
geometric mean of relative overlap frequency
- J
joining
- LN
lymph node
- MH
Morisita-Horn
- PCR
polymerase chain reaction
- PTC
papillary thyroid cancer
- ROC
receiver operating characteristic
- seq
sequencing
- TCR
T-cell receptor
- V
variable
Acknowledgments
Financial Support: This work was funded by National Natural Science Foundation of China 81702645(X.L.), 81702653 (J.C.), 81602349 (J.W.), 81802674 (J.X.), 81672642 (M.G.), and 81872170 (M.G.), China Postdoctoral Science Foundation 2018M642488 (X.L.), Medical and Health Research Program of Zhejiang Province 2016KYA054 (C.Z.), Zhejiang Province Natural Science Foundation of China LY17H070003 (X.Z.), and Zhejiang Cancer Hospital Young Talent Program 2017 (X.L.).
Author Contributions: Conception and design: M.G.; acquisition of data (acquired and managed patients, provided facilities, etc): Z.T., C.Z., C.C., X.Z., J.W., J.X., and X.Z.; analysis and interpretation of data (eg, statistical analysis, biostatistics, computational analysis): X.L., J.C., K.Y., C.Z., Q.Z., X.G., C.W., C.Z., Z.T., and W.W.; writing, review, and/or revision of the manuscript: X.L., J.C., K.Y., C.Z., Y.H., X.Y., and M.G.
Additional Information
Disclosure Summary: The authors have nothing to disclose.
Data Availability: The sequencing data have been deposited in NCBI Sequence Read Archive under BioProject PRJNA642967.
References
Author notes
These authors contributed equally to this work.
