


Abstract
First-generation somatostatin receptor ligands (fg-SRLs) represent the mainstay of medical therapy for acromegaly, but they provide biochemical control of disease in only a subset of patients. Various pretreatment biomarkers might affect biochemical response to fg-SRLs.
To identify clinical predictors of the biochemical response to fg-SRLs monotherapy defined as biochemical response (insulin-like growth factor (IGF)-1 ≤ 1.3 × ULN (upper limit of normal)), partial response (>20% relative IGF-1 reduction without normalization), and nonresponse (≤20% relative IGF-1 reduction), and IGF-1 reduction.
Retrospective multicenter study.
Eight participating European centers.
We performed a meta-analysis of participant data from 2 cohorts (Rotterdam and Liège acromegaly survey, 622 out of 3520 patients). Multivariable regression models were used to identify predictors of biochemical response to fg-SRL monotherapy.
Lower IGF-1 concentration at baseline (odds ratio (OR) = 0.82, 95% confidence interval (CI) 0.72–0.95 IGF-1 ULN, P = .0073) and lower bodyweight (OR = 0.99, 95% CI 0.98–0.99 kg, P = .038) were associated with biochemical response. Higher IGF-1 concentration at baseline (OR = 1.40, (1.19–1.65) IGF-1 ULN, P ≤ .0001), the presence of type 2 diabetes (oral medication OR = 2.48, (1.43–4.29), P = .0013; insulin therapy OR = 2.65, (1.02–6.70), P = .045), and higher bodyweight (OR = 1.02, (1.01–1.04) kg, P = .0023) were associated with achieving partial response. Younger patients at diagnosis are more likely to achieve nonresponse (OR = 0.96, (0.94–0.99) year, P = .0070). Baseline IGF-1 and growth hormone concentration at diagnosis were associated with absolute IGF-1 reduction (β = 0.90, standard error (SE) = 0.02, P ≤ .0001 and β = 0.002, SE = 0.001, P = .014, respectively).
Baseline IGF-1 concentration was the best predictor of biochemical response to fg-SRL, followed by bodyweight, while younger patients were more likely to achieve nonresponse.
First-generation somatostatin receptor ligands (fg-SRLs) represent the mainstay of medical therapy for acromegaly (1, 2). Medical treatment is usually indicated for patients for whom trans-sphenoidal surgery is not an option or is not curative. Long-acting fg-SRLs act mainly by binding and activating somatostatin receptor subtype 2 (SST2), which together with SST5 receptor is the most frequently expressed SST subtype of growth hormone (GH)-secreting pituitary adenomas (3-5). Overall, the efficacies of fg-SRLs, such as lanreotide autogel (ATG) and octreotide long-acting release (LAR), seem to be similar (6), and patients have biochemical response rates varying from 25% to 45% (6-9).
Although fg-SRLs can control hormonal hypersecretion in GH-secreting pituitary adenomas, many patients are at least partially resistant to treatment and will be exposed to high GH and insulin-like growth factor 1 (IGF-1) concentrations. Excess of serum GH and/or IGF-1 leads to cardiovascular, metabolic, and musculoskeletal comorbidities, which, in turn, increase mortality as a result of cardiovascular, cerebrovascular, and respiratory morbidities (10, 11). However, mortality in patients with acromegaly significantly declined over time and could be explained by the availability of new medical treatment options (11, 12).
Previous studies have reported several clinical predictors of biochemical response to fg-SRL monotherapy, including age at diagnosis, sex, bodyweight, height, serum (nadir) GH, and IGF-1 at diagnosis and baseline, tumor size, genetic mutations (eg, aryl-hydrocarbon receptor interacting protein), T2-weighted magnetic resonance imaging signal intensity, pathological features (granulation pattern and SSTs receptors of the adenoma) and the presence of type 2 diabetes (DM; antidiabetic medication use) as well as previous treatment modalities (surgery and medical therapy) (3-5, 13-26). Overall, these studies have used widely differing definitions of biochemical response over time and varying study entry criteria (de novo, postsurgery, or preselected sensitivity to fg-SRLs) (22). Although no validated criteria for fg-SRL therapy failure exist, only a small minority (<10%) should be considered to be fully resistant to fg-SRLs (27). More importantly, previous studies have not been able to identify patient-specific clinical predictors for different biochemical response groups, including partial responders and nonresponders to fg-SRL therapy.
Given the importance of biochemical control in acromegaly but the lack of studies investigating predictors for the different biochemical response groups, we aim to identify clinical predictors of the biochemical response to initial treatment with the maximum dose of fg-SRLs monotherapy for at least 6 months. We categorized patients into groups by biochemical response (biochemical response, partial response, and nonresponse) and by IGF-1 reduction criteria (absolute and relative). These prediction models can be used to guide and individualize treatments and could avoid the consequences with ineffective treatment with fg-SRLs such as prolonged biochemical and metabolic disease.
Patients and Methods
Cohort description
Patients were included from 2 retrospective cohorts: (1) the Rotterdam cohort and (2) the Liège Acromegaly Survey (LAS) cohort (21, 28, 29). The Rotterdam cohort contains data from acromegaly patients using fg-SRL monotherapy collected at the outpatient clinic of the Pituitary Center Rotterdam, Erasmus University Medical Center in Rotterdam between 1977 and 2018. The LAS cohort (n = 3194 from 10 centers) was created using a software tool that enables hospitals throughout Europe to include acromegaly patients and report patient, biochemical, and tumor characteristics (21). For this study, only patients using fg-SRL monotherapy were enrolled from an additional 7 European centers. The inclusion period was between 1990 and 2018. Patients receiving fg-SRL monotherapy could have previously undergone surgery; however, patients that had undergone radiotherapy were excluded from the study.
Rotterdam cohort.
Clinical and biochemical data were collected from acromegaly patients initially treated with the maximum dose of fg-SRL monotherapy (ie, lanreotide ATG 120 mg or octreotide LAR 30 mg every 28 days) for at least 6 months. We excluded 26 patients because they were not initially treated with the maximum dose of fg-SRL monotherapy for at least 6 months. We were able to select 326 potential patients using fg-SRL monotherapy. We excluded 132 patients for 2 reasons: (1) IGF-1 normalization was achieved (defined as ≤1.3 × upper limit of normal (ULN)) at baseline (ie, before initiating fg-SRL monotherapy, n = 44), and (2) follow-up data during SRL monotherapy were missing (n = 88). In total (n = 194) patients remained in the cohort. The subjects then visited our outpatient clinic between every 16 and 24 weeks. At each visit to our outpatient clinic, standard measurements were performed including assessments of IGF-1 and GH concentrations. From all patients written informed consent was obtained prior to inclusion, and the study was approved by the Medical Ethics Committee of the Erasmus University Medical Center in Rotterdam.
LAS cohort.
Acromegaly patients from the LAS database treated with initially the maximum dose of fg-SRL monotherapy for at least 6 months were selected. We excluded 197 patients because they were not initially treated with the maximum dose of fg-SRL monotherapy for at least 6 months. From the LAS database, we were able to select 590 potential patients using fg-SRL monotherapy. We excluded 162 patients for 2 reasons: (1) IGF-1 normalization was achieved at baseline (defined as ≤1.3 × ULN before initiating fg-SRL monotherapy, n = 91), and follow-up data during SRL monotherapy were missing (n = 71). In total (n = 428) patients remained in the cohort. The medical ethics committee from the Liège University hospital approved the protocol and was covering the other European centers.
Outcome
The primary endpoint was the biochemical response to treatment with fg-SRLs classified as (1) biochemical response, defined as a normalized IGF-1 (IGF-1 ≤ 1.3 × ULN) irrespective of normalized GH (GH ≤ 2.5 µg/L) concentration achieved after at least 6 months of treatment; (2) partial resistance, defined as a >20% relative reduction of IGF-1 without normalization; and (3) nonresponse, defined as a failure to decrease IGF-1 concentration by >20%, which represents the intra-assay variability. The primary endpoint was independent of GH values. The secondary endpoints were absolute and relative IGF-1 reduction (between serum IGF-1 at baseline versus lowest IGF-1 during fg-SRL monotherapy).
Blood measurements.
In the Rotterdam cohort, total IGF-1 and GH concentrations were measured with different assays. IGF-1 concentration before and after fg-SRL treatment were analyzed using different assays: Immulite 2000 assay, a solid-phase, validated enzyme-labelled chemiluminescent immunometric assay (DPC Biermann GmbH/Siemens, Fernwald, Germany; intra-assay variability of 2-5%, interassay variability of 3-7%) and 2 different radioimmunoassays (Diagnostic Systems Laboratories, Webster, TX, USA, intra-assay coefficient of variation (CV) 3.9%, interassay CV 4.2%; and Medgenix Diagnostics, Fleurus, Belgium, intra-assay CV 6.1%, interassay CV 9.9%). GH concentration was initially measured by immunoradiometric assay (CIS Bio International, Gif-sur-Yvette, France, intra-assay CV 2.8%, inter-assay CV 4.4%). Since February 2013, IGF-1 and GH concentrations were analyzed using an immunometric assay (IDS-iSYS, Boldon, UK), which is free of interference from pegvisomant. Interassay CVs for GH and IGF-1 were <5% (GH; n = 190) and (IGF-1; n = 190) in serum-based internal quality control measurements over a period of 1 year.
In the LAS cohort, containing acromegaly patients from 7 European centers, GH and IGF-1 serum measurements were assessed locally and consequently performed with different assays. In this study, the IGF-1 concentration was chosen to be expressed as the ULN of the reference ranges used in the local center (the IGF-1 divided by the age- and sex-specific ULN). GH concentration was measured as a single random sample and expressed as absolute value.
Candidate predictors
Variables that were considered as possible pretreatment predictors required to achieve disease control during fg-SRL monotherapy were selected based on previous studies (4, 5, 13-21, 25, 26, 30-33), biological plausibility and availability of robust data ascertainment in both cohorts and included: age at diagnosis and baseline, sex, bodyweight, height, serum (nadir) GH, and IGF-1 at diagnosis and baseline, tumor size (microadenoma, macroadenoma, and nonvisible at diagnosis) and the presence of type 2 DM at baseline as well as previous treatment modalities (surgery and medical therapy with a [partial] dopamine agonist). Bodyweight, GH, and IGF-1 concentrations were collected between 6 months before and at the time of fg-SRL initiation. Other data were collected at baseline (as indicated), were fixed data in the patient’s record, or were established during the disease process.
Statistical analysis
Data are expressed as median (interquartile range [IQR]). Differences between two subgroups were analyzed using an unpaired t-test or the Mann-Whitney U test (in case of a nonparametric distribution). Nominal variables were analyzed using Fisher’s exact test. For all regression models, the residuals were normally distributed, final models were not affected by multicollinearity, and nonlinearity was assessed utilizing restricted cubic splines with 3 or 4 knots. We used univariable linear regression models to assess the association between each candidate predictor and the outcome. The decision for linear regression models instead of multiple models for the identification of predictors was based on Akaike information criteria and log-likelihood tests comparing multilevel models with random intercepts and/or slope per cohort versus standard linear regression correcting for cohort. To allow for optimal generalizability of effect estimates that predict the outcome, we performed standard linear regression correcting for cohort. We selected useful predictors using forward selection based on the change in regression coefficients and residual explained variability of the model, with P < .20 to keep predictors liberally in the model. To cope with (differentially) missing values of the candidate predictors, missing data on candidate predictors were multiple imputed (50 times). The imputation model included most candidate predictor variables (missing values Rotterdam/LAS cohort as percentage, bodyweight 27.8/19.9%; height: 8.3/1.4%; GH at diagnosis 17.5/11.2%; tumor size 2.1/5.1%; panhypopituitarism 0/69.6%; age at baseline 0/0.5%; GH at baseline 13.9/11.7%) and the outcome variables. The candidate predictors age at diagnosis, gender, IGF-1 (×ULN) at diagnosis and baseline, the presence of type 2 DM and previous treatment modalities (surgery and medical therapy) had no missing values. There was no difference between the original or any of the imputed datasets. All analyses were performed in each of the completed datasets, and final results were pooled using Rubin’s rules. We investigated the predictive discriminative ability of significant predictors from the multivariable analyses by performing receiver-operating-characteristics analysis. A P value <0.05 (two-tailed) was used as a cut-off for statistical significance. All statistical analyses were performed using Statistical Package of Social Sciences, version 25.0 for Windows (SPSS) or using R statistical software, version 3.5.2 (packages foreign, mice, pROC, and rms).
Results
Cohort characteristics
After exclusions, the final study population comprised 662 patients (Fig. 1), the characteristics and previous treatment modalities of which are depicted in Table 1. Patients included in the LAS cohort were younger at diagnosis (44.0 vs 49.0 years) and more likely to be diagnosed with a macroadenoma (81.5% vs 74.2%). Patients from the LAS cohort more often underwent surgery and received medical treatment (ie, (partial) dopamine agonist therapy) before the start of fg-SRL and had a lower baseline IGF-1 concentration. In the total cohort the median duration of fg-SRL therapy is 132.4 months (IQR 36.4-215.3) and 284 (45.7%) patients received fg-SRL as primary treatment. Observed biochemical response occurred in 80% of patients and a partial or nonsignificant response occurred in 13% and 7%, respectively. No significant differences were observed in the Rotterdam and LAS cohort between excluded and included patients.
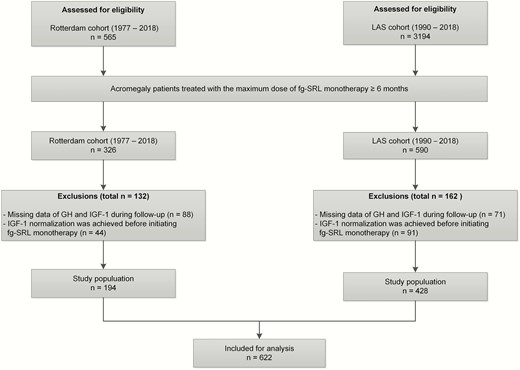
Flowchart of the selection procedure. IGF-1, insulin-like growth factor 1; fg-SRL, first-generation somatostatin receptor ligand; ULN, upper limit of normal.
Cohort demographics and clinical characteristics of the total group, Rotterdam cohort and LAS cohort
| Total cohort (n = 622) | Rotterdam cohort (n = 194) | LAS cohort (n = 428) | |
|---|---|---|---|
| Age at diagnosis (years) | 46.0 (36.0–55.0) | 49.0 (39.8–58.0) | 44.0 (34.0–53.0)* |
| Sex (female) | 295 (47.4) | 95 (49.0) | 200 (46.7) |
| Bodyweight (kg) | 82.8 (71.0–96.4) | 90.0 (75.2–100.1) | 80.0 (70.0–95.0)* |
| Height (cm) | 172.0 (166.0–180.0) | 176.0 (168.8–182.3) | 172.0 (165.0–179.3)* |
| Nadir GH at diagnosis (µg/L) | 5.8 (2.4–15.3) | 4.3 (1.9–10.6) | 6.0 (2.5–18.0)* |
| GH at diagnosis (µg/L) | 8.5 (3.9–21.8) | 12.2 (5.9–28.3) | 7.3 (3.6–19.8)* |
| IGF-1 at diagnosis (×ULN) | 2.7 (2.0–3.6) | 2.9 (2.4–4.1) | 2.6 (1.9–3.5)* |
| Tumor size | |||
| Microadenoma | 103 (16.7) | 46 (23.7) | 57 (13.5)* |
| Macroadenoma | 493 (80.2) | 144 (74.2) | 349 (81.5)* |
| Nonvisible adenoma | 19 (3.1) | 4 (2.1) | 15 (3.5) |
| Presence of type 2 DM | 227 (36.5) | 76 (39.2) | 151 (35.3) |
| Oral medication | 196 (31.5) | 66 (34.0) | 130 (30.4) |
| Insulin therapy | 44 (7.1) | 10 (5.2) | 34 (7.9) |
| Previous treatment | |||
| Surgery | 205 (33.0) | 38 (19.6) | 167 (39.0)* |
| Surgical reintervention | 22 (3.5) | 8 (18.6) | 14 (8.4) |
| Medical treatment | 111 (17.8) | 12 (6.2) | 99 (23.1)* |
| Panhypopituitarism | 44 (7.1) | 27 (13.9) | 17 (4.0)* |
| Age at baseline (years) | 47.0 (37.0–56.5) | 50.0 (40.0–59.0) | 46.0 (36.0–55.0)* |
| GH at baseline (µg/L) | 7.6 (3.5–20.1) | 8.1 (3.2–21.8) | 7.3 (3.6–19.9) |
| IGF-1 at baseline (x ULN) | 2.7 (1.9–3.6) | 2.9 (2.2–4.1) | 2.6 (1.9–3.5)* |
| Octreotide LAR | 311 (50) | 123 (63.4) | 188 (43.9)* |
| Treatment response | |||
| Biochemical response | 498 (80.1) | 114 (58.8) | 384 (89.7)* |
| Partial response | 79 (12.7) | 50 (25.8) | 29 (6.8)* |
| Non-response | 45 (7.2) | 30 (15.5) | 15 (3.5)* |
| Duration fg-SRL therapy (months) | 132.4 (36.4–215.3) | 17.7 (8.5–66.7) | 177.2 (116.7–243.3)* |
Data are mean (SD), median (IQR) or n (%). Asterisk represents P = ≤.05 for the comparisons between Rotterdam and LAS cohort and are derived from the Student’s t test (continuous variables) and Pearson’s chi-square test (categorical variables).
Abbreviations: IGF-1, insulin-like growth factor 1; fg-SRL, first-generation somatostatin receptor ligand; Octreotide LAR, Octreotide long-acting release; ULN, upper limit of normal.
Univariable predictors of the biochemical response
All univariable analyses of the candidate predictors of biochemical response to fg-SRL monotherapy, including predictors of IGF-1 reduction, are depicted in Table 2.
Univariable analysis of the predictors of the biochemical response during first-generation SRL monotherapy
| Biochemical response | Partial response | Nonresponse | Absolute IGF-1 reduction | Relative IGF-1 reduction | |
|---|---|---|---|---|---|
| Age at diagnosis (years) | — | — | Younger* | Nonlinear* | Nonlinear b |
| Sex | — | — | — | Male* | — |
| Bodyweight (kg) | ↓ Bodyweight** | ↑ Bodyweight** | ↓ Bodyweightb | — | |
| Height (cm) | Smaller* | Tallerb | Tallera | Nonlinearb | Smaller** |
| Nadir GH at diagnosis (µg/L) | Nonlinear b | Nonlinear* | — | Nonlinear** | Nonlinear* |
| GH at diagnosis (µg/L) | ↓ GH* | Nonlinear* | ↑ GHa | Nonlinear** | — |
| IGF-1 at diagnosis (×ULN) | ↓ IGF-1*** | ↑ IGF-1*** | — | ↑ IGF-1*** | ↑ IGF-1*** |
| Tumor size | |||||
| Microadenoma | — | — | — | — | — |
| Macroadenoma | — | — | Macroadenomab | Macroadenomab | — |
| Nonvisible adenoma | — | - | — | — | — |
| Presence of type 2 DM | |||||
| Oral medication | — | Yesb | — | — | — |
| Insulin therapy | — | Yesb | — | — | — |
| Previous treatment | |||||
| Surgery | Yes** | Yes*** | No* | No** | Yesb |
| Surgical reintervention | — | — | — | — | — |
| Medical treatment | Yes** | Yes*** | Nob | No** | — |
| Panhypopituitarism | No** | Yes* | Yes** | — | No** |
| Age at baseline (years) | — | Older* | Younger* | — | — |
| GH at baseline (µg/L) | Nonlineara | Nonlinearb | — | ↓ GH** | Non-linear** |
| IGF-1 at baseline (×ULN) | ↓ IGF-1*** | ↑ IGF-1*** | — | ↑ IGF-1*** | ↑ IGF-1*** |
| Octreotide LAR | — | — | — | — | — |
Abbreviations: IGF-1, insulin-like growth factor 1; SRL, somatostatin receptor ligand; octreotide LAR, octreotide long-acting release; ULN, upper limit of normal.
*P < 0.05,**P < 0.01,***P < .0001.
aBorderline significance at P < .07.
bTrend towards significance at P < .20.
Predictors of biochemical response
In multivariable analyses, baseline IGF-1 concentration and bodyweight were determinants of biochemical response (Table 3). A lower IGF-1 concentration at baseline was associated with a higher chance of achieving biochemical response (OR 0.82, 95% CI 0.72-0.95 IGF-1 ULN, P = .0073, Table 3). Moreover, a lower bodyweight was associated with a higher chance of a biochemical response (OR 0.99, 95% CI 0.98-0.99 kg, P = .038, Table 3). The combined discriminative ability of IGF-1 concentration and bodyweight combined to predict biochemical response was adequate (AUC 0.77, 95% CI 0.72-0.81; all supplementary material and figures are located in a digital research materials repository (34)).
Multivariable analysis to predict biochemical, partial and non-response
| OR | 95% CI | P value | |
|---|---|---|---|
| Biochemical response | |||
| IGF-1 at baseline (×ULN) | 0.82 | (0.72–0.95) | .0073 |
| Bodyweight (kg) | 0.99 | (0.98–0.99) | .0379 |
| Partial response | |||
| IGF-1 at baseline (×ULN) | 1.40 | (1.19–1.65) | <.0001 |
| Type 2 DM and oral medication a | 2.48 | (1.43–4.29) | .0013 |
| Type 2 DM and insulin therapy a | 2.65 | (1.02–6.70) | .0451 |
| Bodyweight (kg) | 1.02 | (1.01–1.04) | .0023 |
| Nonresponse | |||
| Age at diagnosis (years) | 0.96 | (0.94–0.99) | .0070 |
| Surgery at baseline | 0.48 | (0.22–1.05) | .0666 |
| Macroadenomab | 2.64 | (0.89–7.84) | .0814 |
| Nonvisible adenomab | <0.01 | (<0.01–∞) | .9868 |
DM, diabetes mellitus; IGF-1, insulin-like growth hormone factor 1; SE, standard error; SRL, somatostatin receptor ligand.
aCompared with patients without type 2 DM.
bCompared with patients harboring a microadenoma.
Predictors of partial response
In the multivariable analyses, baseline IGF-1 concentration, the presence of type 2 DM and bodyweight were determinants of partial response (Table 3). A higher IGF-1 concentration at baseline was associated with a higher chance of achieving partial response (OR 1.40, 95% CI 1.19-1.65 IGF-1 ULN, P ≤ .0001, Table 3). The presence of type 2 DM was associated with a higher chance of a partial response (oral medication OR 2.48, 95% CI 1.43–4.29, P = .0013; insulin therapy OR 2.65, 95% CI 1.02-6.70, P = .045, Table 3). Moreover, a higher bodyweight was associated with a higher chance of a partial response (OR 1.02, 95% CI 1.01-1.04 kg, P = .0023, Table 3). The combined discriminative ability of the IGF-1 concentration, the presence of type 2 DM and bodyweight to predict partial response was good (AUC 0.80, 95% CI 0.76-0.86 (34)).
Predictors of nonresponse
In multivariable analyses, age at diagnosis, surgery, and tumor size at diagnosis were determinants of nonresponse (Table 3). Younger patients at diagnosis had a higher chance of achieving nonresponse (OR 0.96, 95% CI 0.94-0.99 year, P = .0070, Table 3). Surgery at baseline tended to be inversely associated with a higher chance of a non-response (OR 0.48, 95% CI 0.22-1.05, P = .067, Table 3). In other words, nonresponse patients underwent surgery less often. In addition, the presence of a macroadenoma (vs microadenoma) at baseline tended to be associated with a higher chance of a nonresponse but failed to reach significance (OR 2.64, 95% CI 0.89-7.84, P = .081, Table 3). Age at diagnosis, surgery and tumor size combined had an adequate discriminative ability to predict non-response (AUC of 0.78, 95% CI 0.69-0.85 (34)).
Predictors of IGF-1 reduction
Multivariable analyses to predict absolute IGF-1 reduction detected a positive association for baseline IGF-1 concentration (β = 0.90, SE = 0.02, P ≤ .0001; Fig. 2A and Table 4). A significant inverse association was seen between GH concentration at diagnosis and absolute IGF-1 reduction (β = –0.002, SE = 0.001, P = .014; Fig. 2B and Table 4).

Predictors of IGF-1 reduction. Association between absolute IGF-1 reduction and (A) IGF-1 (×ULN) before start fg-SRL therapy and (B) GH concentration at diagnosis. Association between relative IGF-1 reduction and (C) IGF-1 (× ULN) and (D) height before start fg-SRL therapy. The grey shade represents the 95% confidence interval of the predicted mean. IGF-1, insulin-like growth factor 1; fg-SRL, first-generation somatostatin receptor ligand; ULN, upper limit of normal.
Multivariable analysis to predict IGF-1 reduction
| β | SE | P value | |
|---|---|---|---|
| Absolute IGF-1 reduction | |||
| IGF-1 at baseline (×ULN) | .90 | 0.02 | <.0001 |
| GH at diagnosis (µg/L) | –.002 | 0.001 | .0136 |
| Relative IGF-1 reduction | |||
| IGF-1 at baseline (×ULN) | 6.24 | 0.66 | <.0001 |
| Height (cm) | –.19 | 0.09 | .0266 |
| β | SE | P value | |
|---|---|---|---|
| Absolute IGF-1 reduction | |||
| IGF-1 at baseline (×ULN) | .90 | 0.02 | <.0001 |
| GH at diagnosis (µg/L) | –.002 | 0.001 | .0136 |
| Relative IGF-1 reduction | |||
| IGF-1 at baseline (×ULN) | 6.24 | 0.66 | <.0001 |
| Height (cm) | –.19 | 0.09 | .0266 |
Abbreviations: IGF-1, insulin-like growth hormone factor 1; SE, standard error.
With regards to relative IGF-1 reduction, the multivariable analyses include a positive association for baseline IGF-1 concentration (β = 6.24, SE = 0.66, P ≤ .0001; Fig. 2C and Table 4). In addition, height was inversely associated with relative IGF-1 reduction (β = –0.1912, SE = 0.0860, P = .027; Fig. 2D and Table 4).
Discussion
This is the first large cohort study to focus on identifying clinical predictors of the biochemical response to treatment with fg-SRLs by categorizing patients into groups by response (biochemical response, partial response, and nonresponse) and by IGF-1 reduction criteria (absolute and relative). The main findings of this study are that (1) baseline IGF-1 concentration, bodyweight, and the presence of type 2 DM can contribute to distinguishing complete biochemical from partial response and (2) that nonresponse during fg-SRLs occurred more in patients that were younger at diagnosis and tended to harbor larger tumors and underwent surgery less often.
In our study, baseline IGF-1 concentration was the best predictor of fg-SRL treatment response. A lower IGF-1 concentration at baseline was associated with a higher chance of a complete biochemical response, while a higher IGF-1 concentration was associated with a higher risk of only partial response and higher IGF-1 (absolute and relative) reduction to fg-SRLs. Previously it has been identified that lower circulating IGF-1 and GH levels correspond with better biochemical response to fg-SRLs (4, 21, 35). Thus, lower baseline IGF-1 concentrations could identify patients that will achieve biochemical control, while higher baseline IGF-1 concentrations could identify those that will achieve partial responses while at the same time having a greater absolute and relative reduction in circulating IGF-1 levels. While the latter seems counterintuitive, a greater reduction even if IGF-1 levels will not decrease below the set threshold is still of clinical value in the multimodel therapy setting.
We observed that a lower bodyweight was associated with a higher chance of biochemical control, while a higher bodyweight was associated with partial response to fg-SRLs. This finding is in accordance with previous findings from the somutaline depot for acromegaly (SODA) registry (13), which identified that patients with a lower BMI (BMI < 30 kg/m2) tended to have better biochemical control of IGF-1 than patients with a higher BMI (BMI ≥ 30 kg/m2) after 24 months of fg-SRL therapy.
The presence of concomitant type 2 DM, besides baseline IGF-1 concentration and bodyweight, is a pretreatment predictor of partial response to fg-SRL monotherapy, is also expected. The SODA study (13), the same study as mentioned before, showed that after 24 months of fg-SRL therapy, normalization of IGF-1 concentration was achieved less frequently in diabetic patients. In a previous study of the LAS database, a significant relationship between glucose levels and IGF-1 at baseline was shown for acromegaly patients, even in the absence of type 2 DM (21). Overall, the prevalence of insulin sensitivity alterations has been found to correlate with higher BMI in patients with acromegaly as observed in the general population (36). Taking into account that type 2 DM patients likely had higher bodyweight at enrollment, both findings may be explained by the presence of hyperinsulinemia. Hyperinsulinemia may counteract possible SRL-induced pituitary-independent mechanisms of biochemical control by enhancing the synthesis of IGF-1 through upregulation of hepatic GH receptors (37, 38). Combined with the fact that fg-SRL therapy may impair glucose metabolism, largely owing to inhibition of insulin leading to further increase of glucose secretion (39, 40), type 2 DM patients might benefit from initial therapy with pegvisomant instead of fg-SRLs.
Age at diagnosis appears to be the most important determinant of achieving nonresponse during fg-SRL therapy, likely reflecting (indirectly) the exposure to high circulating levels of GH and IGF-1 (18, 21, 23, 28, 41). This observation confirms and builds upon previous studies (21, 42) proposing age at diagnosis to be a clinical marker of tumor size and aggressiveness. Younger patients (aged <40 years) tend to have larger and potentially harbor more aggressive tumors than older patients; the reason for this is unknown, although the increased prevalence of genetic mutations like AIP in younger patients with acromegaly–gigantism with fg-SRL resistance may play a role (25, 26).
Knowing that larger tumors secrete more GH, while older patients generally have lower GH concentrations at diagnosis (18, 21, 28), it becomes apparent why older patients have been shown to be more sensitive to fg-SRLs therapy (18). Subsequent, surgical total tumor resection or debulking decreases the basal GH secretion, and increases the likelihood of achieving biochemical disease control with fg-SRLs. This observation is consistent with long-term trials (20, 43, 44) and our data that show a better biochemical control of IGF-1 with fg-SRLs after surgery.
A strength of our study is the relatively large number of patients in which the biochemical responses to fg-SRL treatment were systematically investigated, while remaining to be treated with a single agent, with a stable high dose for a long period of treatment (ie, exceeding the median period of 12 months) when compared with previous literature (27). The LAS database provides some specific advantages in that it is not limited to a national dataset nor does it deal with patients managed with only a single treatment modality, and, therefore, may better reflect the general population of acromegaly patients and overcome selection bias. In our study, we utilize a more liberal definition of biochemical response (defined as IGF-1 ≤ 1.3 × ULN). To overcome the limitation of a cutoff validity, we confirmed our data by using the cutoff of ≤1.2 × ULN in the multivariable analyses, which did not affect the effect estimates of the final models. The main limitations of our study lie in the retrospective nature of this study. Due to the retrospective collection of data on IGF-1 concentration during fg-SRL treatment, performed on patients followed-up for at least 6 months, a selection bias cannot be ruled out. It is conceivable that patients unresponsive to fg-SRLs were switched to alternative treatment options, if available, and did not reach the 6 months follow-up period required for admission in the study. However, before considering fg-SRL resistance, at least 6 months are generally assumed to be necessary to assess treatment outcome (19, 45). Finally, we are limited by the use of different IGF-1 assays during fg-SRL treatment.
SRLs remain the mainstay of medical therapy in acromegaly; however, a proportion of patients are at least partially resistant to treatment. Patient-specific clinical predictors of fg-SRL response in patients with acromegaly include baseline IGF-1 concentration as the best predictor: lower baseline IGF-1 concentrations could identify patients that will achieve biochemical control, while higher baseline IGF-1 concentrations could identify those that will achieve partial responses while at the same time having a greater absolute and relative reduction in circulating IGF-1 levels. In the latter group, a greater reduction in IGF-1 levels even it does not decrease below the set threshold is still of great clinical value in the multimodal therapy setting. Other patient-specific clinical predictors of fg-SRL response are bodyweight, the presence of type 2 DM, age at diagnosis and a trend towards tumor size and previous surgery. These prediction models can be used to guide and individualize treatments and could avoid the negative consequences of ineffective treatment with fg-SRLs such as prolonged active biochemical and metabolic disease.
Abbreviations
- AIP
aryl-hydrocarbon receptor interacting protein
- ATG
autogel
- CV
coefficient of variation
- DM
diabetes
- fg-SRL
first-generation somatostatin receptor ligands
- GH
growth hormone
- IGF
insulin-like growth factor
- IQR
interquartile range
- LAR
long-acting release
- LAS
Liège Acromegaly Survey
- OR
odds ratio
- SE
standard error
- SST2
somatostatin receptor subtype 2
- ULN
upper limit of normal
Acknowledgments
The authors would like to thank all of the physicians and scientists who formed part of the “LAS Club.” We thank Arash Derakshan for his help in performing the statistical analysis.
Financial Support: The Liège acromegaly survey was supported by an unrestricted educational grant from Ipsen. The study funder had no role in the collection of data, had no access to the data and had no involvement in the writing of this manuscript.
Additional Information
Disclosure Summary: E.C. Coopmans, SW.F. van Meyel, B. Delemer, D. Carvalho, and G.K. Stalla have nothing to disclose. T.I.M. Korevaar received lecture fees from Goodlife Healthcare, Quidel, and Berlin Chemie. A.F. Daly has received grants and/or speakers fees from Pfizer and Ipsen. P. Chanson has received unrestricted research and educational grants from Ipsen, Novartis, and Pfizer as Head of the Department of Endocrinology and Reproductive Diseases, Hôpitaux Universitaires Paris-Sud. P. Chanson has served as an investigator (principal or coordinator) for clinical trials funded by Novartis, Pfizer, Ipsen, Italfarmaco, and Antisense Therapeutics. P. Chanson is a member of Advisory Boards for Ipsen and Novartis. P. Chanson has given lectures for Ipsen, Novartis, and Pfizer. All fees and honoraria are paid to his institution. V. Hána Jr. has received speaker fees and has served on Advisory Boards for Pfizer, Novartis, and Ipsen. A. Colao has been principal investigator of research studies from Novartis, Ipsen, Pfizer, and Lilly, has received research grants from Ferring, Lilly, Ipsen, Merck-Serono, Novartis, Novo-Nordisk, and Pfizer, has been a consultant for Novartis, Ipsen, and Pfizer, and has received fees and honoraria from Ipsen, Novartis, and Pfizer. M.L. Jaffrain-Rea has served on advisory boards for Novartis and received an educational grant from Novartis. C. Fajardo-Montañana has received honoraria from Pfizer as speaker fees. A. Beckers is a consultant for Ipsen Pharma and received research funding from Ipsen Pharma, Novartis, and Pfizer. A.J. van der Lely is a consultant to Pfizer Inc. and Millendo Therapeutics, and received grants from Pfizer Inc. P. Petrossians received speakers and consulting fees from Novartis Pharma, Ipsen Pharma, and Pfizer. S.J.C.M.M. Neggers received research grants and speaker fees from Ipsen Pharma, Novartis Pharma, Pfizer Inc., and consulting fees from Pfizer, Crinetics, and Ipsen Pharma.
Data Availability: The datasets generated during and/or analyzed during the current study are not publicly available but are available from the corresponding author on reasonable request.
References
Author notes
These authors contributed equally.
