


Abstract
The clinical and radiological aspects of normocalcemic hyperparathyroidism (NHPT) are confounded by the differing methods used to rule out secondary hyperparathyroidism and by the small sample size.
To assess the clinical, biochemical, and radiological profile of NHPT compared with primary hyperparathyroidism (PHPT) and control subjects
Multicentric cross-sectional study
Outpatient clinic
47 NHPT, 41 PHPT, and 39 age- and sex-matched control subjects.
Calcium metabolism and bone turnover markers (BTMs). Lumbar spine, total hip, femoral neck, one-third distal radius bone mineral density (BMD). Morphometric vertebral fracture (VF) assessed by dual-energy X-ray absorptiometry.
NHPT patients had significantly higher parathyroid hormone, 25(OH)-vitamin D levels and lower calcium × phosphorus product than controls (P < .001). Compared with PHPT, the NHPT group had significantly higher 25(OH) vitamin D levels (P = .016). NHPT had BTM levels similar to controls and PHPT. NHPT, PHPT, and controls have similar lumbar spine and femoral neck BMD. NHPT and controls had a similar radial BMD, while patients with PHPT had a lower radial BMD than both patients with NHPT (P = .031) and controls (P < .05). Using the control group as the reference, after adjustment for interacting factors, there was no increase in risk of moderate–severe VF in NHPT (odds ratio [OR] 1.04, 95% confidence interval [CI] 0.25-4.55), while PHPT had an increased risk (OR 3.81,95% CI 1.15-15.12). Seventy-nine percent of NHPT and 59% of PHPT patients fulfilled the criteria for asymptomatic hyperparathyroidism.
The biochemical phenotype of NHPT is intermediate between PHPT and controls. In contrast, the bone phenotype resembles controls with normal bone turnover, no significant BMD impairment, and no increased risk of VF.
Primary hyperparathyroidism (PHPT) is a common endocrine disorder caused by excessively secreted parathyroid hormone (PTH) and associated classically with hypercalcemia. PHPT can be associated with signs and symptoms of hypercalcemia such as kidney stones and with those associated with excessive PTH, such as vertebral and nonvertebral fractures (1). In countries where multichannel biochemical screening is routine, the asymptomatic form of PHPT has become the dominant clinical phenotype of this condition (2-6). Asymptomatic PHPT, nevertheless, is also associated with kidney stones and fractures. The descriptor “asymptomatic” refers to this large cohort that is discovered through routine biochemical screening and not because they are being evaluated for classical features of the disease. Further evolution of the clinical presentation of PHPT has been gleaned over the past 15 years, due to the increasing use of PTH measurements in the evaluation of subjects with osteoporosis and/or other metabolic bone diseases. These subjects typically have normal total and ionized serum calcium levels and, thus, are referred to as normocalcemic. This newest variant of PHPT, normocalcemic PHPT (NHPT) (7) is defined by persistently normal total and ionized calcium levels in the presence of high PTH levels after ruling out secondary causes of hyperparathyroidism (8,9). Cusano et al. have reported that the prevalence of NHPT ranges between 0.4% and 3.1% in 2 community-based cohorts (10). Observations focused upon the pathophysiology of NHPT are limited (11). One suggestion is that NHPT may represent an early stage of PHPT (7,12) or a kind of resistance of PTH’s target tissues (13) with progression, at times, to frank hypercalcemia (10,14).
Attempts to describe clinical features of NHPT have been confounded, in some cohorts, by differing methods used to rule out secondary hyperparathyroidism (15,16).
There is, therefore, little detailed knowledge of how this disease presents, and virtually no information about fractures in NHPT. Optimal management strategies in NHPT have not yet been established (17). The collective experience with surgery is limited as is experience with pharmacological approaches (18).
To meet some of these informational needs, we have conducted a multicenter, cross-sectional study to evaluate the clinical, biochemical, and radiological profile of NHPT compared with PHPT and control subjects.
Materials and Methods
Study design and population
From September 2016 to September 2018, subjects with PHPT and NHPT were consecutively enrolled at bone outpatient clinics of the following centers: Unit of Endocrinology and Diabetes, Campus Bio-Medico University of Rome; Department of Internal Medicine, “S. M. Goretti” Hospital, Latina; Department of Endocrinology, San Giovanni Addolorata Hospital, Rome and Department of Endocrinology, CTO A. Alesini Hospital, Rome.
NHPT was defined as a persistently normal total albumin-corrected and ionized serum calcium concentrations and persistently elevated PTH levels (at least 2 different determinations, at least 3 months of difference between the determinations), after ruling out secondary causes of hyperparathyroidism such as renal disease (glomerular filtration rate < 60 mL/min), hypovitaminosis D (25-OH vitamin D <30 ng/mL), and hypercalciuria. All NHPT patients were taking oral cholecalciferol in order to maintain adequate 25-OH vitamin D levels. PHPT was defined as elevated or unsuppressed PTH concentrations and persistently elevated total, albumin-corrected, or ionized serum calcium levels (at least 2 different determinations, at least 3 months of difference between the determinations).
We excluded subjects with any other condition that can affect bone and calcium metabolism, such as familial hypocalciuric hypercalcemia; malabsorption diseases, other diseases known to affect bone metabolism (thyrotoxicosis, bowel diseases, chronic hepatic disease, depression, history of Cushing’s, alcoholism, smokers, diabetes, obesity, eating disorders, and rheumatological or hematological diseases); administration of drugs affecting bone and calcium metabolism (diuretics, lithium, bisphosphonates, denosumab, significant use of glucocorticoids within the past 2 years, or any treatment that could affect calcium metabolism), history of possible high-energy vertebral fractures (VFs), metabolic bone diseases such as Paget disease and osteogenesis imperfecta.
Control subjects without any impairment of calcium, phosphate, and PTH concentration were consecutively recruited based on the aforementioned exclusion criteria from the outpatient clinic of endocrinology at Campus Bio Medico University of Rome, where they were referred for unrelated diseases (eg, thyroid nodules with euthyroidism). Prior to their enrollment in this study, they had never had a bone mineral density (BMD) test. In all control subjects with osteoporosis and/or fragility fractures, secondary causes of osteoporosis were ruled out in accordance with current Italian guidelines (19).
All NHPT and PHPT subjects were taking oral cholecalciferol (mean UI/day [standard deviation, SD): NHPT 1294 (370); PHPT 1130 (605), P = .35). Only 38% of controls were taking cholecalciferol suggested by a general practitioner for hypovitaminosis D.
Clinical evaluation
We evaluated the clinical profile of the whole study population by recording the medical history and by reviewing the clinical, laboratory, and imaging results already performed on patients. Physical examination was performed on all subjects. Nephrolithiasis and previous fractures were documented by history and review of medical records (all NHPT and PHPT subjects had a kidney ultrasound evaluation within 1 year before enrollment). All PHPT and NHPT subjects had been previously (within 1 year before enrollment) evaluated with parathyroid imaging by neck ultrasound. To assess daily calcium intake, we used the calcium calculator of the International Osteoporosis Foundation (20). Overall dietary calcium intake was calculated for each subject during the visit (mean dietary calcium intake: NHPT group 798 mg ± 89 mg; PHPT group 777 mg ± 95 mg; control group 762 mg ± 87 mg, P = ns). Subjects with NHPT and PHPT were also divided into symptomatic or asymptomatic forms of hyperparathyroidism. We defined asymptomatic subjects as those with hyperparathyroidism and no overt signs of the disease (ie, osteitis fibrosa cystica, nephrocalcinosis, reduced renal function, muscle weakness, peptic ulcer disease and pancreatitis, neurocognitive symptoms) according to Bilezikian et al (21).
Biochemical analysis
Fasting blood samples were obtained in the morning (from 8:00 to 8:30 am). Serum total calcium (normal, 8.4-10.2 mg/dL) and albumin were measured using automated methods, and calcium values were corrected for albumin concentration using the following formula: corrected calcium (mg/dL) = measured total calcium (mg/dL) + 0.8 (4.0 – serum albumin [g/dL]). Ionized serum calcium (normal, 1.13-1.32 mmol/L) was measured by a potentiometric method on GEM PREMIER 4000 analyzers (Werfen, Le Pré-Saint-Gervais, France); serum phosphate (normal, 2.3-4.7 mg/dL), 25 OH vitamin D, and creatinine were also measured by automated techniques. Intact PTH was measured by an immunochemiluminometric assay using a Modular E170 automatic analyzer (Roche Diagnostics, Indianapolis, IN, USA) in the Laboratory at Campus Bio Medico University of Rome. Normal serum iPTH levels ranged between 14 and 72 pg/mL. Serum levels of beta CrossLaps (CTX) were assayed by the β-CrossLaps (ECLIA; β-CrossLaps/Serum, Roche Diagnostics, Basel, Switzerland), which uses 2 monoclonal antibodies against β-crosslinked CTX according to the manufacturer’s protocol. This assay is a sensitive electrochemiluminescent detection technology and is formatted for the Cobas e601 automated analyzer. Its interassay coefficient of variation (CV) is 4.1% and the intra-assay CV is 2.6%. Serum levels of P1NP were analyzed by sensitive electrochemiluminescent detection technology and was formatted for the Cobas Total P1NP (Roche Diagnostics) automated analyzer. The P1NP assay has a lower detection limit of 5 ng/mL: its intra-assay CV is 3.7% and the interassay CV is 4.1%. Values have been categorized as “high” if greater than 70 ng/mL (Roche Diagnostics). Results of 70 ng/mL or less have been defined as normal, with no defined lower limit. Urinary calcium was assessed by calorimetry. The estimated glomerular filtration rate (eGFR) was calculated using the modification of diet in renal disease equation (22).
Dual-energy X-ray absorptiometry
BMD by dual-energy X-ray absorptiometry (DXA) was measured at the lumbar spine (L1-L4), total hip, femoral neck, and nondominant forearm (one-third distal radius) using a dual-energy X-ray absorptiometer (Hologic Discovery QDR Instrument, MA, USA). Data were reported for absolute bone density and T-scores (SD values from the mean for a sex- and age-matched and young reference population, respectively). Fractured vertebrae were excluded from BMD measurement.
Vertebral fracture assessment
VFs were evaluated by vertebral fracture assessment of the DXA scan. To confirm findings in the presence of scoliosis and disk space osteoarthritis (23), conventional spinal radiographs (T4-L4) in the lateral and the anteroposterior projections were performed. A single experienced investigator read all images and scored VF using the Genant semiquantitative method (grade 1, mild; grade 2, moderate; grade 3, severe) (24).
Ethics
The study was conducted in compliance with the Declaration of Helsinki and the International Conference on Harmonization Principles of Good Clinical Practice. The research protocol was approved by local ethics committees and all participants gave informed consent allowing their anonymized information to be used for a data analysis.
Statistical analysis
According to our sample size, there will be 80% probability to declare as statistically significant at α = .05 a standardized difference of 0.25 between groups (“medium-sized” difference according to Cohen (25)). The characteristics of the study participants were reported using descriptive statistics (mean and SD for continuous variables and proportions for categorical variables) by groups defined according to the diagnosis of NHPT, PHPT, or control group. Differences between groups were analyzed using analysis of variance and the Tukey test for continuous variables and chi-square test for proportions. The association between groups and any fracture, moderate–severe VF, or renal lithiasis was evaluated using logistic regression models, using the control group as the reference and reported using the odds ratios (ORs) with 95% confidence interval (CI). Then, the models were adjusted for potential confounders, selected based on prior knowledge and the results of univariate analyses namely age.
Results
Clinical and biochemical features
The study population consisted of 127 adults (47 subjects with NHPT, 41 with PHPT, and 39 controls).
The mean age of the study population was 64.1 years (SD 9.6); 91% were female (postmenopausal women). There were no differences between groups in age, sex, body mass index (BMI), and eGFR. There was no difference between the control and NHPT groups in the albumincorrected serum calcium concentration, while subjects with PHPT showed a higher albumincorrected serum calcium value than patients with NHPT (10.8 mg/dL, SD 0.4 vs 9.4 mg/dL, SD 0.4, P < .001) (Table 1 and Fig. 1A). The serum phosphate concentration in the NHPT group was lower than in the control group (3.2 mg/dL, SD 0.5 vs 3.8 mg/dL, SD 0.4, P < .001) but higher than the PHPT group (2.8 mg/dL, SD 0.5, P < .001) (Table 1 and Fig. 1 B). The calcium × phosphorus product was higher in the control group than in the NHPT group (35.66, SD 3.84 vs 29.55, SD 4.42, P < .001), while it was similar between NHPT and PHPT (mean difference 0.22, P = .97) (Table 1 and Fig. 1 E). PTH in NHPT was higher than in the control group (126.8 pg/mL, SD 29.5 vs 52.4 pg/mL, SD 15.4, P < .001) and essentially the same as the PHPT group (126.8 pg/mL, SD 29.5 vs 139.1 pg/mL, SD 49.7, P = .222) (Table 1 and Fig. 1 C). 25(OH)D concentration in NHPT group was higher (36.7 ng/mL, SD 6.6) than in the control group (28.6 ng/mL, SD 12.8, P < .001) and in the PHPT group (31.1 ng/mL, SD 7.8, P = .011) (Table 1 and Fig. 1 D). There were no statistically significant differences in the 24-hour urine calcium excretion between the NHPT and control groups, but subjects with PHPT had higher levels than both subjects with NHPT (293.5 mg/24 hours, SD 146.3 vs 196.1 mg/24 hours, SD 49.2, P < .001) and controls (293.5 mg/24 hours, SD 146.3 vs 192.3 mg/24 hours, SD 76, P < .001).
General characteristics of the population
| Control group N = 39 | Normocalcemic HPTN = 47 | Hypercalcemic HPTN = 41 | |
|---|---|---|---|
| Age, mean (SD) (years) | 64.7 (7) | 63.8 (9.3) | 63.9 (12) |
| Female, % | 90 | 91 | 93 |
| BMI, mean (SD) (kg/m2) | 26.2 (4.7) | 26.7 (4.9) | 27.6 (5.3) |
| Time from menopause, mean (SD) (years) | 14 (7.6) | 13.7 (9.8) | 14 (9.6) |
| eGFR, mean (SD) (mL/min/1.73 m2) | 86.866 (15.656) | 83.447 (23.682) | 92.115 (24.466) |
| Serum calcium concentration, mean (SD) (mg/dL) | 9.5 (0.4) | 9.4 (0.4)++ | 10.8 (0.4)** |
| Serum calcium ion concentration, mean (SD) (mmol/L) | 1.22 (0.05) | 1.19 (0.05)++* | 1.35 (0.05)** |
| 24-hour calcium, mean (SD) (mg/24 hours) | 192.3 (76) | 196.1 (49.2)++ | 293.5 (146.3)** |
| Serum phosphate concentration, mean (SD) (mg/dL) | 3.8 (0.4) | 3.2 (0.5)** ++ | 2.8 (0.5) ** |
| Serum PTH concentration, mean (SD) (pg/mL) | 52.4 (15.4) | 126.8 (29.5) ** | 139.1 (49.7)** |
| 25-OH vitamin D concentration, mean (SD)] (ng/mL) | 28.6 (12.8) | 36.7 (6.6)** | 31.1 (7.8)* |
| Calcium × phosphorus, mean (SD) | 35.66(3.84) | 29.55 (4.42)** | 29.78 (5.26)** |
| Serum CTX concentration, mean (SD) (ng/mL) | 0.33 (0.21) | 0.37 (0.18) | 0.49 (0.27)* |
| Serum P1NP concentration, mean (SD) (ng/mL) | 50.12 (24.14) | 61.33(25.41) | 73.09 (42.09)* |
| Lumbar spine BMD, mean (SD) | 0.904 (0.149) | 0.893 (0.186) | 0.880 (0.184) |
| Lumbar spine T score | –1.3 (1.3) | –1.4 (1.7) | –1.5 (1.6) |
| Total hip BMD, mean (SD) | 0.872 (0.097) | 0.819 (0.125) | 0.795 (0.126)* |
| Total hip T score | –0.6 (0.7) | –1.1 (0.9) | –1.2 (1)* |
| Femoral neck BMD, mean (SD) | 0.671 (0.075) | 0.659 (0.108) | 0.633 (0.107) |
| Femoral neck T score | –1.6 (0.7) | –1.8 (0.9) | -2 (1) |
| One-third distal radius BMD, mean (SD) | 0.620(0.065) | 0.605 (0.08)+ | 0.563 (0.078)* |
| One-third distal radio T score | –1.3 (0.8) | –1.6 (1.2)+ | –2.3 (1.3)** |
| Asymptomatic HPT, % | – | 79 | 59 |
| Vertebral fractures, % | 23 | 28 | 60* |
| Renal lithiasis, % | 3 | 13 | 10 |
** P < .001 vs control group; *P < .05 vs control group; ++P < .001 vs PHPT; +P < .05 vs PHPT.
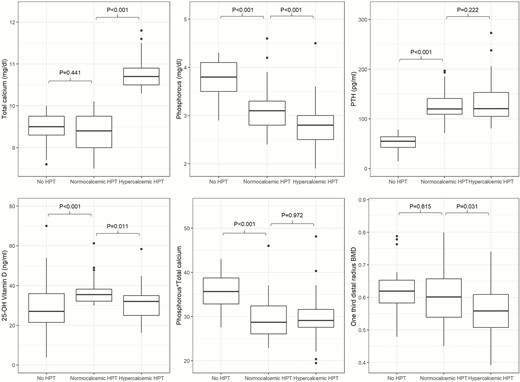
Biohumoral parameters and one-third distal radius bone mineral density.
CTX and procollagen-1 N-terminal peptide (P1NP) were higher in the PHPT group than in the control group (0.49 ng/mL, SD 0.27 vs 0.33, SD 0.21 and 73.09 ng/mL, SD 42.09 vs 50.12, SD 24.14, respectively, P < .05). We did not find any significant differences in terms of CTX and P1NP between NHPT and controls, and NHPT and PHPT.
The prevalence of nephrolithiasis was 13% in subjects with NHPT and 10% in the patients with PHPT, without significant differences between groups.
An enlarged parathyroid gland was identified in 17% of patients with NHPT and in 65% of patients with PHPT.
The definition of asymptomatic hyperparathyroidism was met by 59% of subjects with PHPT and 79% of subjects with NHPT (P = .264). The small sample size does not allow us to adequately perform the data analysis in these subgroups.
Radiological features
There were no differences between groups in femoral neck and lumbar spine BMD, while total hip BMD was lower in the PHPT group than in controls (0.795, SD 0.126 vs 0.872, SD 0.097, P < .05). The total hip BMD of the PHPT and NHPT groups was similar (Table 1). Patients with NHPT had a one-third distal radius BMD similar to the group, while patients with PHPT showed a lower one-third distal radius BMD than both the NHPT group and the control group (0.563, SD 0.078 vs 0.605, SD 0.080, P = .031, and 0.620, SD 0.065, P < .05, respectively) (Table 1 and Fig. 1 F). There were no differences between groups in femoral neck and lumbar spine T scores, while the total hip T score was lower in the PHPT group than in controls (–1.2 SD 1.0 vs –0.6 SD 0.7 P < .05). Patients with NHPT had a similar one-third distal radius T score compared with the control group, while patients with PHPT showed a lower one-third distal radius T score than both the NHPT and the control groups (–2.3 SD 1.3, vs –1.6 SD 1.2, P < .05, –2.3 SD 1.3 vs –1.3 SD 0.8 P < .001 respectively) (Table 1).
The overall prevalence of morphometric VF in PHPT, NHPT, and controls was 60%, 28%, and 23% respectively. When we assessed only grades 2 and 3 VF, the prevalence was 10%, 10%, and 29% respectively in controls, NHPT, and PHPT groups.
Using the control group as the reference, NHPT participants had no increased risk of VF (OR 1.27, 95% CI 0.48-3.49), while PHPT participants had a 5-fold increase in risk (OR 5.00, 95% CI 1.94-13.85). These results were confirmed after adjustment for age (NHPT: OR 1.32, 95% CI 0.48-3.72; PHPT: OR 5.87, 95% CI 2.16-17.3). Similar features were observed considering only moderate–severe VF: using the control group as the reference, NHPT had no increased risk of VF (OR 1.04, 95% CI 0.26-4.49), while PHPT had a higher risk (OR 3.75, 95% CI 1.16-14.59); these results were confirmed after adjustment of potential confounders: NHPT: OR 1.04, 95% CI 0.25-4.5; PHPT: OR 3.81, 95% CI 1.15-15.12 (Table 2).
Odds ratios of fracture risk among the 3 populations; controls versus 2 forms of primary hyperparathyroidism
| Crude (95% CI) | Adjusted (95% CI)a | |
|---|---|---|
| Evidence of fracture | ||
| Controls | 1 | 1 |
| Normocalcemic | 1.27 (0.48-3.49) | 1.32 (0.48-3.72) |
| Hypercalcemic | 5.00 (1.94-13.85) | 5.87 (2.16-17.3) |
| Evidence of moderate–severe fractures | ||
| Controls | 1 | 1 |
| Normocalcemic | 1.04 (0.26-4.49) | 1.04 (0.25-4.55) |
| Hypercalcemic | 3.75 (1.16-14.59) | 3.81 (1.15-15.12) |
aModels adjusted for age.
With respect to the number of fractures, the risk for additional events was not increased in the NHPT group (RR 1.13, 95% CI 0.57-2.29), while PHPT participants had a higher risk with respect to controls (RR 2.37, 95% CI 1.30-4.56); these results were confirmed after adjustment for potential confounders (NHPT: RR 1.12, 95% CI 0.56-2-27; PHPT: 2.24, 95% CI 1.22-4.32) (Table 3). Taking into account only moderate–severe VF, PHPT only had an increased risk of 1 more fracture with respect to the control group (NHPT: RR: 0.83, 95% CI 0.23-2.89; PHPT: RR 2.73, 95% CI 1.04-8.45); however, this result was not confirmed after adjustment for potential confounders (NHPT: RR 0.83, 95% CI 0.23-2.97; PHPT: RR 2.60, 95% CI 0.99-8.08) (Table 3).
Relative risk of more than 1 fracture: hyperparathyroid subjects versus controls
| Crude (95% CI) | Adjusted (95% CI)a | |
|---|---|---|
| Overall fractures | ||
| Control group | 1 | 1 |
| Normocalcemic | 1.13 (0.57-2.29) | 1,12 (0.56-2,27) |
| Hypercalcemic | 2.37 (1.30-4.56) | 2.24 (1.22-4.32) |
| Moderate-severe fractures | ||
| Control group | 1 | 1 |
| Normocalcemic | 0.83 (0.23-2.98) | 0.83 (0.23-2.97) |
| Hypercalcemic | 2.73 (1.04-8.45) | 2.60 (0.99-8.08) |
aModels adjusted for age.
Discussion
This is the first study to describe systematically the clinical, biochemical, and radiological aspects of a large cohort of well-defined subjects with NHPT compared with PHPT and control, euparathyroid subjects. The 2 comparisons between NHPT and PHPT or control subjects provide a helpful context to these observations.
Even though more than 10 years have passed since the first description of NHPT in 2003 (13), this condition remains incompletely characterized. Most epidemiological studies have reported the prevalence of NHPT in the general population to be between 0.4% and 0.6% (15,26). In particular, Cusano et al. revealed a prevalence of 0.4% in men and 0.6% in women (10), and, similarly, in a village in southern Italy the prevalence was 0.44% (27).
Incidence and prevalence of this condition differ according to criteria used to define NHPT. Considering the strict criteria to define NHPT (9), previous published studies present limitations regarding the lack of information about the ionized calcium concentration (10,15,27-29), absence of confirmation of normocalcemia with elevated PTH (10,27-29), and possible inclusion of some subjects with hypercalciuria (10,15,27-29). In addition, the most important parameters to rule out secondary hyperparathyroidism such as eGFR and 25-OH vitamin D concentration have not been uniformly standardized. Some studies have taken into consideration different thresholds of eGFR (>40 mL/min/1.73 m2 (29) or >60 mL/min/1.73 m2 (10,15,27)) and 25-OH vitamin D (>20 ng/dL (10,28) or >30 ng/dL (15,27,29)). According to the Fourth International Workshop on the Management of Asymptomatic PHPT (9), we enrolled subjects with NHPT with eGFR >60 mL/min/1.73 m2 and 25-OH vitamin D levels >30 ng/dL. Indeed, all patients with NHPT had already taken oral cholecalciferol in order to maintain adequate 25-OH vitamin D levels. However, data on the clinical presentation and natural history of this condition remain limited (10,11). Some authors have suggested that NPHPT represents a very early stage of PHPT (13), while others have defined this condition as due to target organ (bone and kidney) resistance to the actions of PTH (13).
From a biochemical point of view, NHPT appears to occupy an intermediate position between patients with PHPT and control subjects. Compared with subjects with PHPT, PTH concentrations were similar despite lower albumincorrected serum calcium levels. Nevertheless, the phosphaturic effect of PTH seems evident in NHPT, although the average serum phosphate is higher in NHPT than in PHPT, in agreement with previous studies (13,30,31). While Díaz-Soto et al. (32) and Kiriakopoulos et al. (33) did not find any significant difference in terms of urinary calcium excretion between NHPT and PHPT, in our study subjects with NHPT showed lower urinary calcium excretion than subjects with PHPT.
Dynamic skeletal manifestations in NHPT resemble controls more than PHPT. Indeed, our NHPT population appears to have normal bone turnover, as shown earlier by Cusano et al. (10). and Amaral et al. (34).
Most of the studies focused on the evaluation of NHPT did not fully assess the radiological profile of this condition (10,15,26-29). In agreement with a limited number of earlier studies (31,34), we observed that BMD at the one-third distal radius was preserved to a greater extent in the normocalcemic group than in the hypercalcemic group and, in fact, was similar to controls. Furthermore, we did not find any differences in lumbar spine, femoral neck, and total hip BMD between NHPT and controls.
Previous studies have reported high prevalence of osteoporosis in NHPT (around 55%) (31,35-37), that is close to our data (46.8% osteoporosis).
The VF data among these 3 cohorts permits direct comparisons for the first time. We observed that subjects with NHPT have a lower rate of VF (both overall and moderate–severe VF) than PHPT. Other previous studies reported the history of VF (29, 31,37) in subjects with NHPT but they referred only to patients’ previous medical records, and, thus, could not be confirmed.
As previously noted, we did not appreciate an increase in VF when subjects with NHPT were compared with control subjects (38). In contrast, and as also previously shown, the PHPT group showed a significant increased risk of VF (39,40). From a clinical point of view the rate of the asymptomatic form was higher in the NHPT group than in the PHPT group, suggesting that this condition could be a mild/early stage of primary hyperparathyroidism. Furthermore, the prevalence of nephrolithiasis in the NHPT group is similar to previous published evaluations (31,34,35,37,41).
This study has several strengths: (1) we have studied one of the largest cohorts of NHPT; (2) biochemical and radiological assessments were conducted in a single center; (3) the study is the first of its kind to report VF rate compared with PHPT and controls; (4) the evaluation of radial BMD.
Our study has some limitations: (1) the study design (cross-sectional); (2) we did not use third-generation PTH assays; (3) prevalence of nephrolithiasis was based on the evaluation of previous medical records.
Conclusion
We have described in detail the clinical, biochemical, and radiological profile of NHPT comparison with PHPT and controls. We have demonstrated that the biochemical phenotype of NHPT appears to be intermediate between PHPT and controls. In contrast, the bone phenotype resembles controls with normal bone turnover, no significant BMD impairment, and no increased risk of VF. Further larger and prospective studies, with long-term follow-up, may be useful to confirm these data and to evaluate how and whether this form of NHPT progresses.
Abbreviations
- BMD
bone mineral density
- BMI
body mass index
- BTM
bone turnover marker
- CI
confidence interval
- CTX
beta CrossLaps
- CV
coefficient of variation
- DXA
dual-energy X-ray absorptiometry
- eGFR
estimated glomerular filtration rate
- NHPT
normocalcemic primary hyperparathyroidism
- OR
odds ratio
- P1NP
procollagen-1 N-terminal peptide
- PHPT
primary hyperparathyroidism
- PTH
parathyroid hormone
- VF
vertebral fracture
Acknowledgments
Financial Support: None.
Author Contributions: Study design: A.P., A.M.N., G.T., and R.C.; Study conduct: A.P.; Data collection: A.P., A.M.N., G.T., S.F., A.S., D.M., L.D., S.I.B., D.C., A.C., A.F., N.N., P.P., S.M., R.C.; Data analysis: A.P., A.M.N., C.P., D.L., R.C.; Data interpretation: A.P., A.M.N., G.T., J.B., and R.C.; Drafting manuscript: A.P., A.M.N., G.T., and R.C. Revising manuscript content: A.P., A.M.N., G.T., S.F., A.S., D.M., L.D., S.I.B., D.C., A.C., C.P., D.L., A.F., J.B., N.N., P.P., S.M., and R.C. Approving final version of manuscript: A.P., A.M.N., G.T., S.F., A.S., D.M., L.D., S.I.B., D.C., A.C., C.P., D.L., A.F., J.B., N.N., P.P., S.M., and R.C. take responsibility for the integrity of the data analysis.
Additional Information
Disclosure Summary: All authors state that they have no conflicts of interest.
Data Availability: The datasets generated during and/or analyzed during the current study are not publicly available but are available from the corresponding author on reasonable request.
References
Author notes
These authors contributed equally to the study.
