


Abstract
Anabolic resistance is mechanistically implicated in muscle disuse atrophy.
The objective of this study is to assess whether anabolic resistance is associated with reduced postprandial amino acid uptake or exacerbated by excess lipid availability.
Twenty men underwent 7 days of forearm immobilization while consuming a eucaloric (CON; n = 11) or high-fat overfeeding (HFD; n = 9; 50% excess energy as fat) diet (parallel design) within our Nutritional Physiology Research Unit.
Preimmobilization and postimmobilization we measured forearm muscle cross-sectional area (aCSA), and postabsorptive and postprandial (3-hour postingestion of a liquid, protein-rich, mixed meal) forearm amino acid metabolism using the arterialized venous-deep venous balance method and infusions of L-[ring-2H5]phenylalanine and L-[1-13C]leucine.
Immobilization did not affect forearm muscle aCSA in either group, but tended to reduce postabsorptive phenylalanine (P = .07) and leucine (P = .05) net balances equivalently in CON and HFD. Mixed-meal ingestion switched phenylalanine and leucine net balances from negative to positive (P < .05), an effect blunted by immobilization (P < .05) and to a greater extent in HFD than CON (P < .05). Preimmobilization, meal ingestion increased leucine rates of disappearance (Rd; P < .05), with values peaking at 191% (from 87 ± 38 to 254 ± 60 µmol·min–1·100 mL forearm volume–1) and 183% (from 141 ± 24 to 339 ± 51 µmol·min–1·100 mL–1) above postabsorptive rates in CON and HFD, respectively, with meal-induced increases not evident postimmobilization in either group (P > .05).
Disuse impairs the ability of a protein-rich meal to promote positive muscle amino acid balance, which is aggravated by dietary lipid oversupply. Moreover, disuse reduced postprandial forearm amino acid uptake; however, this is not worsened under high-fat conditions.
Skeletal muscle mass is largely regulated by physical activity. Withdrawal of muscle contraction during disuse results in rapid muscle atrophy within 1 week (1). Negative health consequences associated with muscle disuse atrophy (eg, insulin resistance and reduced function) are well documented (2, 3) and make a detailed understanding of the underlying mechanisms a key area of investigation.
Disuse-induced declines in postabsorptive muscle protein synthesis (MPS) rates and the blunted MPS response to dietary protein ingestion (termed anabolic resistance) are widely viewed as key mechanisms responsible for muscle disuse atrophy (4-6). Although anabolic resistance could originate within myocellular anabolic signaling pathways (4, 7), it may also be a consequence of reduced systemic or local amino acid delivery. However, whether disuse is associated with impaired muscle amino acid uptake has not been established.
Muscle amino acid uptake is contingent on several transporter proteins that generally reside on the cell membrane (8). Dietary protein ingestion leads to a rapid increase in gene and protein expression of these transporters, and this is often assumed to reflect intracellular amino acid flux and the subsequent stimulation of MPS rates (8-10). The rise in amino acid transporter expression following protein ingestion has been shown to be blunted with disuse in some (6) but not all (4) studies. This discrepancy likely highlights the difficulties in extrapolating static molecular measurements to a dynamic physiological process.
We have previously discussed that anabolic resistance could result from disuse per se, or indirectly as a consequence of (or exacerbated by) altered nutritional status (11). For instance, during disuse there is an immediate reduction in (local) energy expenditure accompanied by excess lipid delivery to and/or uptake by inactive tissue (12). A (negative) regulatory role of lipid availability on anabolic sensitivity is also implied by reports of anabolic resistance being present in overweight and obese individuals (10, 13-15), humans subjected to intralipid infusions (16), and rodents overfed a high-fat diet (17, 18). However, these are not uniform findings; some studies report no differences in anabolic sensitivity between lean and obese older adults (19), no impact (20), or even a potentiating effect (21) of acute fat coingestion with protein on postprandial MPS rates, and recent data reveal neither acute nor short-term dietary fat overload–impaired postprandial MPS rates in older adults (22). Although such a link between lipid availability and anabolic sensitivity may be mechanistically explained by the intracellular deposition of lipid (metabolites)-blunting anabolic signaling pathways or impaired cellular delivery of amino acids (4, 16, 18), the inconsistency of findings requires further investigation.
In the present study, therefore, we investigated how immobilization modulated the ability of a protein-rich meal to promote a positive net amino acid balance and stimulate uptake of 2 essential amino acids across the forearm tissue bed by applying an arterialized venous–deep venous (AV-V) balance approach combined with dual intravenous infusions of L-[ring-2H5]phenylalanine and L-[1-13C]leucine under eucaloric and (high-fat) hypercaloric conditions. We hypothesized that disuse would impair forearm amino acid uptake and this would be associated with a reduced ability of a protein-rich meal to promote a positive net amino acid balance, effects that would be exacerbated by a high-fat diet.
Methods
Participants
Twenty-two healthy young men were included in the present study, though because of technical issues during data collection our final data set comprises 20 individuals. Before inclusion in the study, participants completed a routine medical screening visit to ensure suitability for acceptance into the study. Participants fulfilling one or more of the following criteria were excluded: age younger than 18 or older than 40 years, body mass index less than 18.5 or greater than 30 kg·m–2, metabolic impairment (eg, type 1 or 2 diabetes), hypertension, cardiovascular disease, chronic use of any prescribed over-the-counter pharmaceuticals, regular use of nutritional supplements, metallic implants, a personal or family history of thrombosis, any previous motor disorders, any disorders in lipid metabolism, presence of an ulcer in the stomach or gut, and severe kidney problems. All participants were fully informed as to the nature and risks of the experiment before written informed consent was obtained. During screening height and weight were measured, and body composition was determined by air displacement plethysmography (Bodpod; Life Measurement, Inc). Volunteers also completed the International Physical Activity Questionnaire (23). The present study was part of a larger project investigating the impact of forearm immobilization and high-fat overfeeding on muscle substrate metabolism, registered at clinicaltrials.gov as NCT02980952. Some data from this work have previously been published (12). The study was approved by the Department of Sport and Health Sciences, University of Exeter’s Ethical Committee (reference number 161026/B/09) in accordance with the Declaration of Helsinki (version October 2013).
Experimental overview
Participants undertook 2 metabolic test days separated by a 1-week period of dietary control and forearm immobilization. Participants visited the laboratory for a baseline metabolic test day (preimmobilization) during which muscle anatomical cross-sectional area (aCSA) of the forearm was assessed using magnetic resonance imaging (MRI) and postabsorptive and postprandial amino acid kinetics across the forearm tissue bed were assessed using the combination of intravenous stable isotope–labeled amino acid infusions and the AV-V forearm balance method (12, 24). Minimally 3 and maximally 32 days later (mean; 10 ± 2 days), participants attended the laboratory for the application of a forearm cast to bring about disuse of the forearm muscle tissue bed. This visit signified the beginning of a 7-day immobilization period. During these 7 days, participants were provided with a fully controlled eucaloric (CON; n = 11) or a high-fat overfeeding diet providing 50% excess energy from fat (HFD; n = 9) (details as follows). Following 7 days of immobilization and dietary intervention, an identical metabolic test day was performed to assess the effects of disuse and diet on forearm muscle aCSA and amino acid metabolism. The forearm cast was removed following the final test day, signifying the end of the experiment.
Magnetic resonance imaging scanning and assessment of forearm muscle mass
Immediately following cast application, and the morning after 7 days of immobilization, participants underwent an MRI scan of both arms to determine forearm muscle volume and aCSA using a 1.5T Philips Intera system. For this procedure, participants lay on the scanning table in a prone, face-down position and with both arms extended overhead. Both arms were scanned separately using a turbo spin echo sequence (in-plane resolution 1 × 1 mm, echo time = 15 ms, repetition time = 421 ms, 3 signal averages) with 60 5-mm slices, with 1-mm gaps, acquired of each arm perpendicular to its long axis.
Forearm muscle aCSA at 2 cm below the bony landmark of the elbow was determined as a measure of forearm muscle mass from both arms and for each visit via a semiautomatic thresholding technique within the Philips scanner toolbox that selectively highlighted the muscle tissue. For the adjustment of forearm volume within our AV-V modeling formulas, muscle volume was calculated by first determining the muscle aCSA in all slices that contained forearm muscle slices 1 to n (ie, muscle areas aCSA1 to aCSAn) by the same technique as for the single slice. Then, to take account of slice thickness and slice gaps, volume (in cm3) can be determined via the following equation:
Experimental test day
Participants arrived at the laboratory at 8 am in an overnight fasted state for the 2 experimental test days. Following MRI scanning, body weight was measured with a digital balance with an accuracy of 0.05 kg (Seca). Participants rested on the bed in a semisupine position for the entire experimental test day. First, a cannula was placed retrogradely into a dorsal hand vein of the nonimmobilized (selected as the dominant) hand, and the hand was then placed in a heated hand warmer (55 °C) for the remainder of the test day to repeatedly sample arterialized venous blood (25). A second cannula was placed retrogradely into a deep-lying antecubital vein of the arm previously identified to be immobilized (ie, nondominant arm) to sample venous blood drainage from the forearm muscle bed (12, 24-26). Doppler ultrasound was used to locate the anatomy of this vein to assist in the cannulation. Both these cannulas were kept patent by a continuous saline drip. To confirm the sampling lines accurately reflected arterialized and venous blood, we determined oxygen saturation levels in both lines prior to beginning a test day using a benchtop online blood gas analyzer (HOX Ultra blood gas analyzer, NOVA Biomedical). Oxygen saturations were 93 ± 1 and 67 ± 5% (P < .05; preimmobilization) and 92 ± 1 and 63 ± 4% (P < .05; postimmobilization) in arterialized venous and venous blood, respectively, with no effect of immobilization (or interaction) on either parameter (both P > .05). A third cannula was then inserted anterogradely into an antecubital vein of the nonimmobilized arm in preparation for stable isotope infusion. Following a baseline venous blood collection to establish background tracer enrichments, the plasma phenylalanine and leucine pools were primed with a single intravenous stable isotope bolus (0.5 mg·kg–1 L-[ring-2H5]phenylalanine, 1.0 mg·kg–1 L-[1-13C]leucine), after which a continuous stable isotope infusion was commenced (0.5 mg·kg–1·h–1 L-[ring-2H5]phenylalanine, 1.0 mg·kg–1·h–1·L-[1-13C]leucine) for the duration of the test day. After 100 and 120 minutes of the stable isotope infusion, parallel AV-V samples were collected at exactly the same time by 2 investigators to assess forearm metabolism in the postabsorptive state. At t = 0 minutes, that is, 120 minutes after the start of the stable isotope infusion, participants ingested an Ensure Plus drink (Abbott Nutrition) containing 1.0 g carbohydrates, 0.3 g protein, and 0.2 g fat per kilogram body weight (mean 21.8 ± 0.8 g protein). Further AV-V blood was sampled simultaneously every 20 minutes during a 3-hour postprandial period. Prior to every blood sample, brachial artery blood flow of the (to be) immobilized arm was determined by ultrasound imaging (~12 MHz, Apogee, 1000. SIUI). Luminal diameter was imaged 5 cm proximal to the antecubital fossa for a 2-second period. Mean blood velocity was determined at the same anatomic location by integration of the pulsed-wave Doppler signal for a minimum of 8 cardiac cycles (27). Files were analyzed semiautomatically using Brachial Analyzer for Research, version 6.8.5 (Medical Imaging Applications LLC). Following the 3-hour postprandial period, infusions were stopped, cannulas removed, and volunteers were asked to stand up from the bed to perform maximal handgrip exercise to determine maximal forearm muscle strength. Briefly, 3 consecutive measures of maximal handgrip strength of both hands were taken using a hydraulic hand dynamometer (Takei Scientific Instruments, Ltd) with participants standing upright and their arm in a vertical position without touching the side of the body. The highest value achieved was taken as their maximal strength.
Forearm casting
The morning of the start of the 7-day immobilization period, participants arrived at the laboratory at 7:30 am to have a forearm cast fitted on their nondominant arm. First, stockinette and undercast padding were applied to protect the skin. Next, a fiberglass cast (Benecast, BeneCare Medical) was fitted to the arm to immobilize the wrist. This resulted in a cast that extended from 5 cm distal of the antecubital fossa to 2 cm proximal of the finger tips. Participants were provided with a sling and instructed to wear that during waking hours to keep the hand elevated above the elbow. A waterproof cover was provided to keep the cast dry while showering.
Dietary control
Prior to the immobilization period, participants were instructed to keep a food diary for 3 consecutive days, including 2 weekdays and 1 weekend day. Habitual energy and macronutrient intake was calculated from these food diaries using online licensed software (28). During the 7 days of forearm immobilization, participants received a fully controlled diet from the research team. All meals and snacks were provided, whereas water and noncaloric drinks were allowed ad libitum. Energy requirements were calculated as basal metabolic rate (estimated via the Henry equations; [29]) multiplied by an activity factor calculated from the previously completed International Physical Activity Questionnaire (23). Participants in the CON group received an individually tailored energy-balanced diet clamped at 1.2 g protein·kilogram–1 body weight·per day–1. Once weight-adjusted protein intake was clamped, the target macronutrient composition was 50% to 55% of total daily energy intake (en%) from carbohydrates, 30% to 35% of en% from fat, 10% to 15% of en% from protein, and 2% of en% from dietary fiber. Participants in the HFD group received a high-fat diet providing 50% excess energy from fat, with absolute protein intake matched to the CON group at 1.2 g protein·kilogram–1 body weight·per day–1. Consequently, target macronutrient composition was 34% to 36% of en% carbohydrate, 54% to 56% of en% fat, 7% to 9% of en% protein, and 1% to 2% of en% dietary fiber. Compliance with the nutritional intervention was assessed via completed 7-day food diaries, returned food containers, and daily contact (either in person or by telephone) by a member of the research team.
Sample collection and analyses
AV-V blood samples were collected for determination of plasma phenylalanine and leucine concentrations, plasma L-[ring-2H5]phenylalanine and L-[1-13C]leucine enrichments, and insulin concentrations. To perform this, an aliquot (~4 mL) of each sample was collected into chilled BD Vacutainer PST Lithium Heparin tubes and immediately centrifuged at 2900 g at 4 °C for 10 minutes to obtain blood plasma that was immediately frozen in liquid nitrogen. A second aliquot (~2 mL) of each blood sample was collected into BD Vacutainer SST II tubes and left to clot at room temperature for 30 minutes or more and then centrifuged at 2900 g at 4 °C for 10 minutes to obtain blood serum samples that were snap-frozen in liquid nitrogen. Serum insulin concentrations were analyzed using a commercially available kit (DRG Insulin ELISA [enzyme-linked immunosorbent assay], EIA [enzyme immunoassay]-2935, DRG International Inc) and these data have been published, in part, previously (12). Plasma leucine and phenylalanine concentrations and plasma L-[ring-2H5]-phenylalanine [1-13C]leucine enrichments were determined by gas chromatography–mass spectrometry (GC-MS) as described previously (30). Briefly, 10 µL internal standards of 13C915N-phenylalanine and 13C615N-leucine were added to the samples. The plasma was deproteinized on ice with 500 µL of 15% 5-sulfosalicylic acid. Free amino acids were purified using acid-washed cation-exchange columns (AG 50W-X8 resin; Bio-Rad), with the amino acids being eluted from the column with 8 mL of 2 N ammonium hydroxide. The eluate was then dried under vacuum with a Speed-Vac rotary dryer (Savant Instruments). To derivatize the plasma sample, 40 μL MTBSTFA + 1% tert-butyl-dimethylchlorosilane and 40 μL acetonitrile were added to the dry samples, vortexed, and heated at 95 °C for 40 minutes (31). The samples were analyzed by GC-MS (7890 GC coupled with a 5975 inert MSD; Agilent Technologies) in duplicates using electron impact ionization and selected ion monitoring for measurement of isotope ratios (30). One microliter of the sample was injected in splitless mode (injector temperature 280 °C). Peaks were resolved using an HP5-MS 30 m × 0.25 mm inner diameter (ID) × 0.25 μm capillary column (Agilent). Helium was used as carrier gas at a 1.2 mL/min constant flow rate. The temperature ramp was set from 80 to 245 °C at 11 °C/min, then to 280 °C at 40 °C/min (30). Selected ion recording conditions were used to monitor fragments m/z 336, with 341 and 346 for phenylalanine and m/z 302, 303, and 309 for leucine.
Arterialized venous-deep venous methodology and calculations
We applied an AV-V model to assess forearm amino acid metabolism in the present study. We (12, 24) and others (32, 33) have used this approach previously to assess dynamic carnitine, glucose, fatty acid, and/or amino acid metabolism in vivo in humans. Two pool AV-V amino acid kinetics across the forearm tissue bed were calculated according to the principles and calculations detailed in Wolfe and Chinkes (30), used previously in the literature (34, 35) and discussed briefly as follows.
Arterial amino acid concentrations do not differ substantially across the body (ie, in different arteries). Moreover, arterialized venous blood has been shown to be an accurate reflection of brachial arterial concentrations for dynamic amino acid kinetics (30, 36, 37). We were measuring blood flow noninvasively, which therefore provided no impediment to expected arterial amino acid concentrations. Moreover, we chose to use arterialized venous blood as a less invasive means to represent arterial delivery of substrates to the forearm tissue bed. Implicit in this approach to assessing muscle metabolism is the assumption that our sampling sites represent delivery and drainage primarily from muscle tissue and not superficial (eg, fat, skin) tissues. Previous data indicate that at least 85% of arterial delivery is to muscle tissue (33, 38). Though this could be expected to introduce a slight (but systematic) overestimation of muscle metabolic balance, it is also true that the deep venous effluent likely represents a similar contribution from nonmuscle tissues. While acknowledging these assumptions, we subsequently refer to the metabolism measured across the forearm as muscle metabolism.
Forearm net balances were calculated both for phenylalanine and leucine according to the Fick principle (equation 1). Specifically, the net balance of a substrate (ie, in this case phenylalanine or leucine) is equal to the rate at which it enters the tissue minus the rate at which it exits the tissue. In turn, the rate of entry is determined by the arterial concentration multiplied by the blood flow, whereas the rate of exit is equivalent to venous concentration multiplied by the blood flow. The values were then adjusted for a participant’s forearm volume so data are expressed as µmol·min–1·100 mL forearm volume–1. Therefore:
where NB is the net balance, BF is blood flow, CA is the arterialized venous concentration, and CV is the deep venous concentration of the specific amino acid adjusted for nonsteady-state conditions (27, 39).
We selected phenylalanine because this essential amino acid is not metabolized or synthesized in skeletal muscle and therefore this gives us an accurate reflection of the “anabolic state” of the muscle tissue bed (ie, “net” MPS; MPS–muscle protein breakdown, MPB). Because leucine is preferentially oxidized within muscle, determining leucine balance is less reflective of anabolic state per se. However, we also determined leucine kinetics to gain additional insight into a key nutritional anabolic signaling amino acid (40). To measure muscle phenylalanine and leucine uptakes, and MPB rates, we applied primed continuous intravenous infusions of L-[ring-2H5]phenylalanine and [1-13C]leucine. This allows the calculation of amino acid rates of disappearance (Rd; equation 2) and rates of appearance (Ra; equation 3) into and from the forearm, respectively. In this model, therefore, Rd reflects irreversible amino acid uptake from the plasma. Although extrapolation of Rd is often used as a proxy for MPS (especially for phenylalanine, for which oxidation can be ignored), the lack of tissue sampling in the present approach led to a consequent lack of information of tracer enrichment within the intracellular space and/or the muscle protein-bound fraction. Particularly with disuse, there is reason to believe that anabolic resistance may be characterized by a reduced ability of muscle tissue to incorporate free intracellular amino acids (ie, already taken up into the muscle cell) into polypeptide chains on the ribosome and thus to exist as functional bound muscle protein (5, 41). As a result, in the present work we consider Rd equivalent to amino acid uptake only and do not presume to be able to directly quantify MPS rates. The principle of calculating Rd is to divide the net tracer uptake (ie, by the Fick principle) by the precursor pool (ie, enrichment of tracer in the arterialized venous supply) to allow conversion between tracer uptake to tracee uptake, and was calculated as follows:
where Rd is the rate of disappearance (of phenylalanine or leucine) from plasma, EA is arterialized venous enrichment of labeled phenylalanine or leucine, CA and CV are AV-V phenylalanine/leucine concentrations, respectively, and BF is blood flow.
Accounting for the lack of primary metabolism of phenylalanine in skeletal muscle, the Ra of phenylalanine therefore reflects the appearance of phenylalanine in plasma resulting from MPB, and can be calculated as follows:
Statistics
All data are expressed as means ± SEM. Baseline characteristics between groups were tested using an independent-samples t test. Postabsorptive amino acid balance and amino acid rates of disappearance data (calculated as a single value from the mean of the 2 measurements taken in the postabsorptive state) were analyzed with a 2-way repeated-measures analysis of variance (ANOVA) with immobilization (preimmobilization and postimmobilization) as the within-subject factor and diet (CON, HFD) as the between-subject factor. For all other variables data were analyzed using 3-way repeated-measures ANOVA with immobilization (preimmobilization and postimmobilization) and time (within the experimental test day the response to mixed-meal ingestion; applicable to plasma-related variables and blood flow) or arm (applicable to forearm muscle aCSA and grip strength) as within-subject factors, and diet (CON vs HFD) as the between-subject factor. In case of a significant 3-way interaction, additional 2-way repeated measures ANOVAs were performed to locate the effect. When a significant 2-way interaction was detected in any of the analyses, a Bonferroni post hoc test was applied to locate the individual differences. Statistical data analysis was performed using SPSS version 25.0 (IBM Corp). Statistical significance was set at P less than .05.
Results
Participants’ characteristics and dietary intervention
Participants’ anthropometric and health-related characteristics, and details of the habitual and prescribed diets, are presented in Tables 1 and 2, respectively. There were no differences between CON and HFD in any participant characteristic. With respect to diet, habitual diets were similar between groups (P > .05 for all parameters) and both groups decreased protein intake (both absolute, relative to body mass, and as percentage of total energy intake; all P < .01) and increased absolute carbohydrate intake (P < .05) during the controlled experimental period. Significant time × diet interaction effects were observed so that the HFD group, but not the CON group, increased their total energy (P < .001) intake, attributable to an approximate 150% increase in fat intake (P < .001). Fiber intake also increased (P < .05) in the HFD group only. The increase in fat intake in the HFD group led to significant decreases in the percentage contribution to total energy intake of protein (P < .01) and carbohydrate (P < .001) both relative to habitual and CON during the experimental period.
Participants’ characteristics
| Parameter | CON | HFD | P |
|---|---|---|---|
| Age, y | 24 ± 2 | 24 ± 2 | .89 |
| Body mass, kg | 74 ± 5 | 72 ± 4 | .69 |
| Height, cm | 177 ± 2 | 179 ± 2 | .63 |
| BMI, kg·m-2 | 24 ± 1 | 23 ± 1 | .43 |
| Body fat, % of body mass | 14 ± 4 | 12 ± 3 | .60 |
| Lean mass, kg | 57 ± 7 | 63 ± 3 | .47 |
| Systolic blood pressure, mm Hg | 117 ± 3 | 120 ± 2 | .39 |
| Diastolic blood pressure, mm Hg | 65 ± 2 | 66 ± 2 | .69 |
Values represent means ± SEM.
Abbreviations: BMI, body mass index; CON, eucaloric diet; HFD, high-fat overfeeding diet. P value represents t test comparison across groups for each parameter.
Dietary intake
| CON | HFD | |||
|---|---|---|---|---|
| Nutritional parameter | Habitual | Experimental | Habitual | Experimental |
| Energy, MJ·d–1 | 11.5 ± 0.9 | 11.8 ± 0.3 | 10.6 ± 0.9 | 18.3 ± 0.6a,b |
| Protein, g·kg bm–1·d–1 | 1.71 ± 0.16 | 1.21 ± 0.00a | 1.68 ± 0.20 | 1.20 ± 0.00a |
| Protein, g·d–1 | 123 ± 13 | 89 ± 5a | 120 ± 14 | 88 ± 4a |
| Carbohydrates, g·d–1 | 310 ± 22 | 365 ± 9a | 257 ± 18 | 385 ± 13a |
| Fat, g·d–1 | 104 ± 12 | 103 ± 3 | 108 ± 13 | 269 ± 9a,b |
| Fiber, g·d–1 | 29 ± 4 | 30 ± 1 | 21 ± 1 | 36 ± 1a,b |
| Protein, En% | 18 ± 1 | 13 ± 0a | 19 ± 1 | 8 ± 0a,b |
| Carbohydrate, En% | 46 ± 1 | 52 ± 1a | 42 ± 2 | 35 ± 0a,b |
| Fat, En% | 34 ± 2 | 33 ± 1 | 38 ± 2 | 55 ± 0a,b |
| Fiber, En% | 2 ± 0 | 2 ± 0 | 2 ± 0 | 2 ± 0b |
Values (means ± SEM) represent parameters of dietary intake from n = 20 healthy, male volunteers. Self-reported habitual food intake was assessed using 3-day food diaries, whereas the diet during 7 days of forearm immobilization (experimental) was calculated and provided in its entirety by the research team. During immobilization, participants were fed a fully controlled eucaloric diet (CON; n = 11) or a high-fat diet (HFD; n = 9) providing 50% excess energy from fat.
Abbreviations: bm, body mass; En%, energy percentage; MJ, mega joule.
aSignificantly different from corresponding habitual intake values (P < .05).
bSignificantly different from corresponding CON value (P < .05).
Forearm muscle mass and handgrip strength
Forearm muscle aCSA (A) and forearm maximal handgrip strength (B) data preimmobilization and postimmobilization are shown in Fig. 1. Forearm muscle aCSA was 7.6 ± 1.4% (CON; P < .01) and 6.0 ± 1.7% (HFD; P < .01) greater in the dominant control (preimmobilization values of 4222 ± 207 and 4241 ± 205 mm2 in CON and HFD, respectively) compared with the nondominant immobilized (preimmobilization values of 3901 ± 196 and 3976 ± 223 mm2 in CON and HFD, respectively) arm (P < .001). However, no effects of immobilization (P = .60), diet (P = .17), or any interactions (all P > .05) were observed. Handgrip strength was also greater (4.3 ± 1.9 [CON] and 1.8 ± 3.7% [HFD]) in the control (preimmobilization values of 42.2 ± 3.3 and 42.5 ± 2.8 kg in CON and HFD, respectively) compared with the immobilized (preimmobilization values of 40.0 ± 2.8 and 41.1 ± 1.9 kg in CON and HFD, respectively) arm (P < .001). A significant immobilization × arm interaction was observed (P < .001) so that the control arm remained unchanged (P = .117) but handgrip strength in the immobilized arm decreased (P < .001) following immobilization and by a similar extent in both groups (by 16.6 ± 3.3 and 12.7 ± 3.5% in the CON and HFD groups, respectively), though no effects of diet (P = .72) or any interactions were detected (all P > .05).
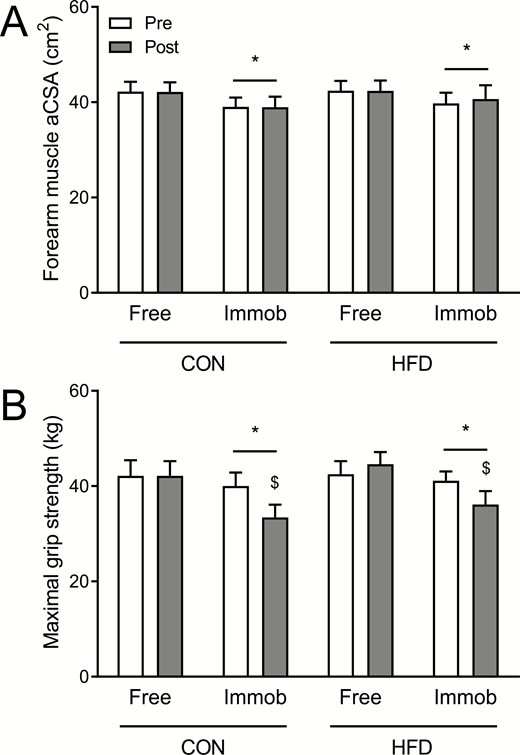
A, Forearm muscle anatomical cross-sectional area (aCSA) and B, maximal grip strength pre-1 week and post-1 week of forearm immobilization in the nonimmobilized (free) and immobilized (immob) arms of healthy young men fed a eucaloric control diet (CON; n = 11) or a high-fat overfeeding diet (HFD; n = 9) providing 50% excess energy from fat. CON and HFD data were compared within the same statistical test (3-way analysis of variance with arm, immobilization, and diet as factors). For muscle aCSA, a significant main effect of arm (ie, free vs immobilized; P < .001; denoted by *), but no effects of immobilization (ie, pre vs post; P = .60), diet (P = .95), or any interactions (all P > .05) were observed. For maximal grip strength, significant main effects of arm (P < .001; denoted by *) and immobilization (P < .001), and an immobilization × arm interaction (P < .001) were observed, with no effect of diet (P = .72) or any other interactions (all P > .05) observed. $Denotes significantly different from corresponding pre value.
Serum insulin concentrations
Fig. 2 depicts arterialized venous serum insulin concentrations in the postabsorptive state and in response to the ingestion of a mixed meal preimmobilization and postimmobilization. Some of these serum insulin data have in part been published previously (12). Postabsorptive serum insulin concentrations were higher in the HFD compared with the CON group (P < .05), increased following immobilization (from 12 ± 1 to 13 ± 1 mU·L–1 in CON and from 14 ± 2 to 19 ± 2 mU·L–1 in HFD; P < .05), but did not change divergently across groups (diet × immobilization interaction; P = .18). Mixed-meal ingestion increased serum insulin concentrations (effect of meal ingestion; P < .001) to an equivalent degree in CON (peaking preimmobilization at 97 ± 14 mU·L–1 and postimmobilization at 104 ± 14 mU·L–1) and HFD (peaking preimmobilization at 96 ± 12 mU·L–1 and postimmobilization at 109 ± 12 mU·L–1) with peak concentrations always observed 40 minutes post–meal ingestion, and staying elevated above postabsorptive values for the entire postprandial period. Whereas serum insulin concentrations during the 3-hour experimental period were higher postimmobilization compared with preimmobilization (P < .05), there was no difference between groups (effect of diet; P = .15) nor any interactions detected (all P > .05). When expressed as the total postprandial area under the curve (AUC), the serum insulin response to mixed-meal ingestion was also greater postimmobilization compared with preimmobilization (P < .05), but was unaffected by diet (P = .18) without any interaction (P = .42).

Arterialized venous serum insulin concentrations pre-1 week and post-1 week of forearm immobilization in healthy young men fed an A, eucaloric control diet (CON; n = 11) or a B, high-fat overfeeding diet (HFD; n = 9) providing 50% excess energy from fat in the postabsorptive state (0 minutes) and for a 3-hour postprandial period following the ingestion of a mixed meal. CON and HFD data were compared within the same statistical test (3-way analysis of variance with immobilization, time, and diet as factors). Significant main effects of immobilization (ie, pre vs post; P < .05) and time (ie, response to mixed meal ingestion; P < .001) were observed, with no effects of diet (P = .29) or any interactions (all P > .05).
Plasma amino acid concentrations
Arterialized venous plasma phenylalanine and leucine concentrations in the postabsorptive state and in response to mixed-meal ingestion are shown in Fig. 3. Mixed-meal ingestion increased arterialized plasma phenylalanine concentrations (P < .001) to an equivalent degree in both groups (A and B, effect of diet; P = .34) with comparable responses preimmobilization and postimmobilization (effect of immobilization; P = .52) and no divergent effects between groups (all interactions; P > .05). Specifically, in the CON group, meal ingestion increased plasma phenylalanine concentrations from postabsorptive levels of 43 ± 1 to a peak of 64 ± 4 µmol·L–1 after 40 minutes, and from 47 ± 2 to a peak of 64 ± 2 µmol·L–1 after 40 minutes preimmobilization and postimmobilization, respectively. In the HFD group, meal ingestion increased plasma phenylalanine concentrations from postabsorptive levels of 49 ± 4 to a peak of 68 ± 6 µmol·L–1 after 40 minutes, and from 46 ± 4 to a peak of 65 ± 5 µmol·L–1 after 60 minutes preimmobilization and postimmobilization, respectively. In both groups, plasma phenylalanine concentrations had not returned to postabsorptive levels by the end of the postprandial period (P > .05).
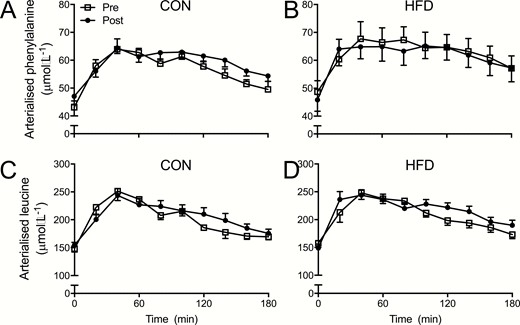
A and B, Arterialized venous plasma phenylalanine and, C and D, leucine concentrations pre-1 week and post-1 week of forearm immobilization in healthy young men fed a eucaloric control diet (A and C; CON; n = 11) or a high-fat overfeeding diet (B and D; HFD; n = 9) providing 50% excess energy from fat in the postabsorptive (0 minutes) and for a 3-hour postprandial period following the ingestion of a mixed meal. CON and HFD data were compared within the same statistical test (3-way analysis of variance with immobilization, time, and diet as factors) for each amino acid separately. For phenylalanine, a significant main effect of time (ie, response to mixed meal ingestion; P < .001) was observed, with no effect of diet (P = .34), immobilization (ie, pre vs post; P = .52), or any interactions (all P > .05). For leucine, a significant main effect of time (P < .001) was observed, with no effect of diet (P = .32), immobilization (P = .16), or any interactions (all P > .05).
Mixed-meal ingestion increased plasma leucine concentrations (P < .001) to an equivalent degree in both groups (C and D; effect of diet; P = .32) with comparable responses preimmobilization and postimmobilization (P = .14) and no divergent effects between groups (all interactions; P > .05). In the CON group, meal ingestion increased plasma leucine concentrations from postabsorptive levels of 148 ± 6 to a peak of 251 ± 17 µmol·L–1 after 40 minutes, and from 155 ± 5 to a peak of 244 ± 12 µmol·L–1 after 40 minutes preimmobilization and postimmobilization, respectively. In the HFD group, meal ingestion increased plasma leucine concentrations from postabsorptive levels of 158 ± 8 to a peak of 248 ± 12 µmol·L–1 after 40 minutes, and from 149 ± 7 to a peak of 244 ± 10 µmol·L–1 after 40 minutes preimmobilization and postimmobilization, respectively. In both groups, plasma leucine concentrations had not returned to postabsorptive levels by the end of the postprandial period (P > .05).
Arterialized venous-deep venous amino acid kinetics
Some of the data relating to brachial artery blood flow have been used in a previous publication (12). Brachial artery blood flow increased with mixed-meal ingestion (P < .001), with no difference between groups (effect of diet; P = .72) and equivalently preimmobilization and postimmobilization (effect of immobilization; P = .87) with no interactions (all P > .05). The increase in blood flow was significantly greater than postabsorptive values (~60-70 mL·min–1) from 100 to 140 minutes of the postprandial period.
Fig. 4 illustrates the dynamic response of forearm phenylalanine (A and B) and leucine (C and D) net balances in response to mixed-meal ingestion. In the postabsorptive state, forearm phenylalanine net balance showed a tendency to be lower postimmobilization compared with preimmobilization (P = .07), but was not affected by diet (P = .51) or a diet × immobilization interaction (P = .21). Meal ingestion switched forearm phenylalanine net balance from negative (–25 ± 6 and –29 ± 6 µmol·min–1·100 mL–1 forearm volume in CON and –22 ± 7 and –43 ± 9 µmol·min–1·100 mL forearm volume–1 in HFD, preimmobilization and postimmobilization, respectively) to positive (effect of meal ingestion; P < .01), an effect that preimmobilization peaked at 25 ± 4 µmol·min·100 mL forearm volume–1 after 40 minutes in CON and 25 ± 20 µmol·min–1·100 mL forearm volume–1 after 120 minutes in HFD, before returning to negative between 60 and 140 minutes into the postprandial period. There was a tendency (P = .06) for forearm phenylalanine net balance to be reduced postimmobilization compared with preimmobilization, so mixed-meal ingestion did not (or minimally so) achieve positive forearm phenylalanine balance at any point in the postprandial phase postimmobilization. Although there were no group differences (effect of diet; P = .61), a significant immobilization × meal ingestion × diet interaction (P < .05) and a tendency for an immobilization × meal interaction (P = 0.10) was observed, with no other interactions (all P > .05). This 3-way interaction manifested as a time effect (P < .01) and immobilization × meal ingestion interaction (P < .001) in the HFD group only. When expressing forearm phenylalanine net balance as the 3-hour post-prandial AUC, a tendency for an effect of immobilization (P = .072) was observed, with no effect of diet (P = .48) or immobilization × diet interaction (P = .39).
![A and B, Forearm phenylalanine and C and D, leucine net balance pre-1 week and post-1 week of forearm immobilization in healthy young men fed a eucaloric control diet (A and C; CON; n = 11) or a high-fat overfeeding diet (B and D; HFD; n = 9) providing 50% excess energy from fat in the postabsorptive state (0 minutes) and for a 3-hour postprandial period following the ingestion of a mixed meal. Inset figures represent the postprandial area under the curves (AUC). CON and HFD data were compared within the same statistical test (3-way analysis of variance [ANOVA] with immobilization, time, and diet as factors) for each amino acid separately, with AUC data analyzed with 2-way ANOVAs. For forearm phenylalanine net balance, a significant main effect of time (ie, response to mixed meal ingestion; P < .01) and a tendency for an effect of immobilization (ie, pre vs post; P = .06) was observed, with no effect of diet (P = .61). A significant immobilization × time × diet interaction (P < .05) and tendency for an immobilization × time interaction (P = 0.10) were observed, with no other interactions (all P > .05). The 3-way interaction manifested as a time effect (P < .01) and immobilization × time interaction (P < .001) in the HFD group only. For forearm phenylalanine net balance AUC, a tendency for an effect of immobilization (P = .072; denoted by #) was observed, with no effect of diet (P = .48) or immobilization × diet interaction (P = .39). For forearm leucine net balance, a significant main effect of time (ie, response to mixed meal ingestion; P < .001) and a tendency for an effect of immobilization (ie, pre vs post; P = .07) was observed, with no effect of diet (P = .39). A significant immobilization × time × diet interaction (P < .001) and tendency for an immobilization × time interaction (P = .06) was observed, with no other interactions (all P > .05). The 3-way interaction manifested as tendencies for a time (P = .05) and immobilization × time (P = .06) interaction effects in the CON group, and a time effect (P < .01) and immobilization × time interaction (P < .001) in the HFD group. For forearm leucine net balance AUC, a tendency for an effect of immobilization (P = .072; denoted by #) was observed, with no effect of diet (P = .27) or immobilization × diet interaction (P = .61). *Denotes post hoc differences within a specific time point when comparing preimmobilization vs postimmobilization.](https://oup.silverchair-cdn.com/oup/backfile/Content_public/Journal/jcem/105/7/10.1210_clinem_dgaa184/5/m_jcem_105_7_e2547_f4.jpeg?Expires=1747866561&Signature=CHGadhk7R1TklGYeZTJ8Gd50xq79qTw3nQ~ZcrkmqC6-Bc~jd--EjvAGZiRjBPHdHCwgKQgDziikMRI5kjj5AvxVfk-E0BK1dUq2-DzIwmLsej7F4Z9DALQf5sJWZ0zpfkVaCylSMSw6~sr9E6np7HLhTmpPy1bFwv-KqsMeZd1l1pB9ur1GIh60vJD9lwyInjH1VJsn~JQlibUIxQRBAO4ls92d6UnmzzvfTzxn1IOUnaPCOmQERb1mlVBZXE0cQDPPCZCJuO4x1lGF0gUF2bQdP5lCjDtHFEMH-x0evk7VUMV218xRh9vqNRk85lVhJIfP0L279Wu1y98bjmhtqg__&Key-Pair-Id=APKAIE5G5CRDK6RD3PGA)
A and B, Forearm phenylalanine and C and D, leucine net balance pre-1 week and post-1 week of forearm immobilization in healthy young men fed a eucaloric control diet (A and C; CON; n = 11) or a high-fat overfeeding diet (B and D; HFD; n = 9) providing 50% excess energy from fat in the postabsorptive state (0 minutes) and for a 3-hour postprandial period following the ingestion of a mixed meal. Inset figures represent the postprandial area under the curves (AUC). CON and HFD data were compared within the same statistical test (3-way analysis of variance [ANOVA] with immobilization, time, and diet as factors) for each amino acid separately, with AUC data analyzed with 2-way ANOVAs. For forearm phenylalanine net balance, a significant main effect of time (ie, response to mixed meal ingestion; P < .01) and a tendency for an effect of immobilization (ie, pre vs post; P = .06) was observed, with no effect of diet (P = .61). A significant immobilization × time × diet interaction (P < .05) and tendency for an immobilization × time interaction (P = 0.10) were observed, with no other interactions (all P > .05). The 3-way interaction manifested as a time effect (P < .01) and immobilization × time interaction (P < .001) in the HFD group only. For forearm phenylalanine net balance AUC, a tendency for an effect of immobilization (P = .072; denoted by #) was observed, with no effect of diet (P = .48) or immobilization × diet interaction (P = .39). For forearm leucine net balance, a significant main effect of time (ie, response to mixed meal ingestion; P < .001) and a tendency for an effect of immobilization (ie, pre vs post; P = .07) was observed, with no effect of diet (P = .39). A significant immobilization × time × diet interaction (P < .001) and tendency for an immobilization × time interaction (P = .06) was observed, with no other interactions (all P > .05). The 3-way interaction manifested as tendencies for a time (P = .05) and immobilization × time (P = .06) interaction effects in the CON group, and a time effect (P < .01) and immobilization × time interaction (P < .001) in the HFD group. For forearm leucine net balance AUC, a tendency for an effect of immobilization (P = .072; denoted by #) was observed, with no effect of diet (P = .27) or immobilization × diet interaction (P = .61). *Denotes post hoc differences within a specific time point when comparing preimmobilization vs postimmobilization.
In the postabsorptive state, forearm leucine net balance was lower postimmobilization compared with preimmobilization (P = .05) but was not affected by diet (P = .84) or a diet × immobilization interaction (P = .28). Mixed-meal ingestion switched forearm leucine net balance from negative (–59 ± 33 and –82 ± 15 µmol·min–1·100 mL forearm volume–1 in CON and –39 ± 16 and –113 ± 25 µmol·min–1·100 mL forearm volume–1 in HFD, preimmobilization and postimmobilization, respectively) to positive (effect of meal ingestion; P < .001) an effect that, preimmobilization, peaked at 184 ± 133 and 132 ± 34 µmol·min–1·100 mL forearm volume–1 after 40 minutes in the CON and HFD groups, respectively, before returning negative between 60 and 140 minutes into the postprandial period. There was a tendency (effect of immobilization; P = .07) for a lower forearm leucine net balance postimmobilization compared with preimmobilization so that mixed-meal ingestion did not (or minimally so) achieve positive forearm leucine balance postimmobilization. Although there were no group differences (effect of diet; P = .39), a significant immobilization × meal ingestion × diet interaction (P < .001) and a tendency for an immobilization × meal ingestion interaction (P = .06) were observed, with no other interactions (all P > .05). This 3-way interaction manifested as tendencies for meal ingestion (P = .05) and immobilization × meal ingestion (P = .06) interactions in the CON group, and an effect of meal ingestion (P < .01) and immobilization × meal ingestion interaction (P < .001) in the HFD group. When expressing forearm leucine net balance as the 3-hour postprandial AUC, a tendency for an effect of immobilization (P = .072) was observed so that total postprandial AUC was lower following immobilization, with no effect of diet (P = .27) or immobilization × diet interaction (P = .61).
Amino acid tracer dynamics
Fig. 5 depicts the arterialized plasma L-[ring-2H5]phenylalanine (A and B) and [1-13C]leucine (C and D) enrichments in the CON and HFD groups, respectively. Primed continuous tracer infusion increased arterialized plasma L-[ring-2H5]phenylalanine and [1-13C]leucine enrichments from virtually zero background enrichments to approximately 7 and approximately 9 mole percent excess (MPE) in CON and approximately 6 and approximately 8 MPE in HFD. Systemic entry of unlabeled amino acids following mixed-meal ingestion (ie, t = 0) decreased arterialized plasma L-[ring-2H5]phenylalanine and [1-13C]leucine enrichments to approximately 6 and approximately 7 MPE in CON and approximately 5 and approximately 6 MPE in HFD, respectively (effects of mixed-meal ingestion; all P < .001), with no effects of immobilization, diet, or any interactions. The initial (20-minute) decrease in arterialized plasma L-[ring-2H5]phenylalanine and [1-13C]leucine enrichments following meal ingestion then remained in steady state for the remainder of the postprandial period. Owing to the systemic and steady-state delivery of the tracers, venous plasma L-[ring-2H5]phenylalanine and [1-13C]leucine enrichments followed precisely the same patterns and magnitude as arterialized enrichments, with the exception that enrichments returned to fasted levels prior to the end of the postprandial period (by 140 and 160 minutes for L-[ring-2H5]phenylalanine and [1-13C]leucine, respectively).
![A and B, Arterialized venous plasma L-[ring-2H5]phenylalanine and C and D, [1-13C]leucine enrichments (Mole Percent Excess; MPE) pre-1 week and post-1 week of forearm immobilization in healthy young men fed a eucaloric control diet (A and C; CON; n = 11) or a high-fat overfeeding diet (B and D; HFD; n = 9) providing 50% excess energy from fat at “background” (ie, prior to intravenous tracer infusion; –20 minutes), in the postabsorptive state (0 minutes) and for a 3-hour postprandial period following the ingestion of a mixed meal. CON and HFD data were compared within the same statistical test (3-way analysis of variance with immobilization, time, and diet as factors) for each labeled amino acid separately. For L-[ring-2H5]phenylalanine, a significant main effect of time (ie, response to mixed meal ingestion; P < .001) was observed, with no effect of diet (P = .27), immobilization (ie, pre vs post; P = .61), or any interactions (all P > .05). For [1-13C]leucine, a significant main effect of time (P < .001) was observed, with no effect of diet (P = .177), immobilization (P = .79), or any interactions (all P > .05).](https://oup.silverchair-cdn.com/oup/backfile/Content_public/Journal/jcem/105/7/10.1210_clinem_dgaa184/5/m_jcem_105_7_e2547_f5.jpeg?Expires=1747866561&Signature=TOa05j~HDnLvskeuoEnh52iOzb8q3o~F7uF~F2lVpNSpeFdGWQaijUS~pl1wilv0o7AFA4YEyWk-PuObb5sdDAEXwOxdfbO0KZGnQ5~tH4dfgxr1IsymlYbLvbozxrIkzsBTHQxMRGLPPBxKYO-VDm3u9SXto1qVtvHxVUY3hVZ-e-r0dyP0C3ECIwX0ALmwugvPgwz4SDJi61ObKtk9RgPz58XFpGFU9wcllmZW~d8paHSvPNhVQ6bMwE4jmfq3sZXiCAfX1l4bHhrqzVl9yMl9YhSk3zlvekf4xu5WEpgxCI6xrwaXi4jAv-6FiJ~kHJD9xzkR1tPGhkrMh1p8Ug__&Key-Pair-Id=APKAIE5G5CRDK6RD3PGA)
A and B, Arterialized venous plasma L-[ring-2H5]phenylalanine and C and D, [1-13C]leucine enrichments (Mole Percent Excess; MPE) pre-1 week and post-1 week of forearm immobilization in healthy young men fed a eucaloric control diet (A and C; CON; n = 11) or a high-fat overfeeding diet (B and D; HFD; n = 9) providing 50% excess energy from fat at “background” (ie, prior to intravenous tracer infusion; –20 minutes), in the postabsorptive state (0 minutes) and for a 3-hour postprandial period following the ingestion of a mixed meal. CON and HFD data were compared within the same statistical test (3-way analysis of variance with immobilization, time, and diet as factors) for each labeled amino acid separately. For L-[ring-2H5]phenylalanine, a significant main effect of time (ie, response to mixed meal ingestion; P < .001) was observed, with no effect of diet (P = .27), immobilization (ie, pre vs post; P = .61), or any interactions (all P > .05). For [1-13C]leucine, a significant main effect of time (P < .001) was observed, with no effect of diet (P = .177), immobilization (P = .79), or any interactions (all P > .05).
Fig. 6 illustrates the forearm phenylalanine (A and B) and leucine (C and D) rates of disappearance (Rd) in response to the ingestion of a mixed meal. Postabsorptive forearm phenylalanine Rd (18 ± 12 and 22 ± in CON and 38 ± 5 and 34 ± 6 µmol·min–1·100 mL forearm volume–1 in HFD, preimmobilization and postimmobilization, respectively) were not affected throughout the study (effects of immobilization, P = .98; diet, P = .13; immobilization × diet interaction, P = .67). Forearm phenylalanine Rd tended to increase with meal ingestion (P = .10) peaking at 48 ± 12 (20 minutes) and 28 ± 12 (40 minutes) in CON and 99 ± 24 (120 minutes) and 81 ± 17 (20 minutes) µmol·min–1·100 mL forearm volume–1 in HFD preimmobilization and postimmobilization, respectively. Forearm phenylalanine Rd was overall significantly higher in the HFD group (effect of diet; P < .05), with no effect of immobilization (P = .37) or any interactions evident (all P > .05). In agreement, forearm phenylalanine Rd expressed as postprandial AUC exhibited a significant effect of diet (P < .05), but not immobilization (P = .26) or immobilization × diet interaction (P = .26).
![A and B, Forearm phenylalanine and C and D, leucine rate of disappearance pre-1 week and post-1 week of forearm immobilization in healthy young men fed a eucaloric control diet (A and C; CON; n = 11) or a high-fat overfeeding diet (B and D; HFD; n = 9) providing 50% excess energy from fat in the postabsorptive state (0 minutes) and for a 3-hour postprandial period following the ingestion of a mixed meal. Inset figures represent the postprandial area under the curves (AUCs). CON and HFD data were compared within the same statistical test (3-way analysis of variance [ANOVA] with immobilization, time, and diet as factors) for each amino acid separately, with AUC data analyzed with 2-way ANOVAs. For forearm phenylalanine rate of disappearance a significant effect of diet (P < .05) was detected, with no effect of immobilization (ie, pre vs post; P = .37), or time (ie, response to mixed meal ingestion; P = .11), or any interactions evident (all P > .05). For forearm phenylalanine rate of disappearance AUC, a significant effect of diet (P < 0.05), but not immobilization (P = .26) or immobilization × diet interaction (P = .26) was observed. For forearm leucine rate of disappearance a significant effect of time (P < .05), but no effect of immobilization (P = .50) or diet (P = .13) was observed. Significant immobilization × time (P < .05) and immobilization × time × diet (P < .05) interactions were detected, with other interactions not significant (both P > .05). The 3-way interaction manifested as immobilization × time interactions both in the CON (P < .05) and HFD (P < .05), and time effects in the CON (P < .05) and HFD (P < .05) preimmobilization but not postimmobilization (both P > .05). For forearm leucine rate of disappearance, AUC no significant effects were detected (all P > .05). *Denotes post hoc differences within a specific time point when comparing preimmobilization vs postimmobilization.](https://oup.silverchair-cdn.com/oup/backfile/Content_public/Journal/jcem/105/7/10.1210_clinem_dgaa184/5/m_jcem_105_7_e2547_f6.jpeg?Expires=1747866561&Signature=k1WZ9ukv9cZ~dV8MH1lNqO5bHW2TyFBFYVqVd-Xi1XKSq~mSclw-GiVP72jwkQpVMA6KXTfl0vghvep5FmOip97mF7rakwutyYe1MFVRZh~CzSfPXdWHXtHMGii8HNe4Nzbi2pQTenmpPz-dVPL-kZ7WYMWjXfxITDsMuGSpsKtkgWY33P743YSyGYBcshC0c~L8DFI0qFYDYg8V84v0cV7gHxc2wwDBP7zFDS592m5J2XzRFzYMSvhAExYGbz7-H0n4oGphd-dRswSjw6DulWm5IvR7-HNN-XlMZ~tpJeVUfVRWsQIllVc-7OqROETCI2wCN-g3m-ObAx0DXPYL~w__&Key-Pair-Id=APKAIE5G5CRDK6RD3PGA)
A and B, Forearm phenylalanine and C and D, leucine rate of disappearance pre-1 week and post-1 week of forearm immobilization in healthy young men fed a eucaloric control diet (A and C; CON; n = 11) or a high-fat overfeeding diet (B and D; HFD; n = 9) providing 50% excess energy from fat in the postabsorptive state (0 minutes) and for a 3-hour postprandial period following the ingestion of a mixed meal. Inset figures represent the postprandial area under the curves (AUCs). CON and HFD data were compared within the same statistical test (3-way analysis of variance [ANOVA] with immobilization, time, and diet as factors) for each amino acid separately, with AUC data analyzed with 2-way ANOVAs. For forearm phenylalanine rate of disappearance a significant effect of diet (P < .05) was detected, with no effect of immobilization (ie, pre vs post; P = .37), or time (ie, response to mixed meal ingestion; P = .11), or any interactions evident (all P > .05). For forearm phenylalanine rate of disappearance AUC, a significant effect of diet (P < 0.05), but not immobilization (P = .26) or immobilization × diet interaction (P = .26) was observed. For forearm leucine rate of disappearance a significant effect of time (P < .05), but no effect of immobilization (P = .50) or diet (P = .13) was observed. Significant immobilization × time (P < .05) and immobilization × time × diet (P < .05) interactions were detected, with other interactions not significant (both P > .05). The 3-way interaction manifested as immobilization × time interactions both in the CON (P < .05) and HFD (P < .05), and time effects in the CON (P < .05) and HFD (P < .05) preimmobilization but not postimmobilization (both P > .05). For forearm leucine rate of disappearance, AUC no significant effects were detected (all P > .05). *Denotes post hoc differences within a specific time point when comparing preimmobilization vs postimmobilization.
Postabsorptive forearm leucine Rd (87 ± 38 and 115 ± 24 µmol·min–1 in CON and 141 ± 24 and 126 ± 25 µmol·min–1 in HFD, preimmobilization and postimmobilization, respectively) were not affected throughout the study (effects of immobilization, P = .81; diet, P = .32; immobilization × diet interaction, P = .43). Forearm leucine Rd significantly increased with mixed-meal ingestion (P < .05). In the CON group this resulted in peak responses of a 191% increase (to 254 ± 60 µmol·min–1) after 100 minutes and a 41% increase (to 162 ± 41 µmol·min–1) 40 minutes after mixed-meal ingestion preimmobilization and postimmobilization, respectively. In the HFD group peak responses of a 183% increase (to 339 ± 51 µmol·min–1) after 120 minutes and 152% (to 318 ± 54 µmol·min–1) 20 minutes after mixed-meal ingestion were observed preimmobilization and postimmobilization, respectively. Forearm leucine Rd was not different between groups (effect of diet; P = .13) or immobilization (P = .50), though significant immobilization × time (P < .05) and immobilization × time × diet (P < .05) interactions were detected, with other interactions not significant (both P > .05). The 3-way interaction manifested as immobilization × meal ingestion interactions both in the CON (P < .05) and HFD (P < .05), and meal ingestion effects in the CON (P < .05) and HFD (P < .05) preimmobilization, but not postimmobilization (both P > .05). As a result the increase in forearm leucine Rd was blunted postimmobilization compared with preimmobilization and to a comparable extent between CON and HFD. Despite the higher peak values postimmobilization in the HFD group, the average postprandial leucine Rd was approximately 25% lower in the HFD compared with the CON group (P < .05), though this did not translate to differing forearm leucine Rd expressed as postprandial AUC across groups (all main effects; P > .05).
Postabsorptive forearm phenylalanine rates of appearance (Ra) (Fig. 7) were unaffected by immobilization (P = .17), diet (P = .14), or any immobilization × diet interaction (P = .60). Forearm phenylalanine Ra also exhibited no main effects of mixed-meal ingestion (P = .12) nor any other main effects in the postprandial state (all P > .05), nor any significant effects when analyzing postprandial AUC data (all P > .05). Postabsorptive forearm leucine Ra (data not shown) was unaffected by immobilization, diet, or any immobilization × diet interaction (all P > .05). Forearm leucine Ra also exhibited no main effects or interactions (all P > .05); however, a significant immobilization × meal ingestion interaction was detected (P < .05) so that forearm leucine Ra increased postimmobilization compared with preimmobilization.
![Forearm phenylalanine rate of appearance pre-1 week and post-1 week of forearm immobilization in healthy young men fed A, a eucaloric control diet (CON; n = 11) or B, a high-fat overfeeding diet (HFD; n = 9) providing 50% excess energy from fat in the postabsorptive state (0 minutes) and for a 3-hour postprandial period following the ingestion of a mixed meal. Inset figures represent the postprandial area under the curves (AUCs). CON and HFD data were compared within the same statistical test (3-way analysis of variance [ANOVA] with immobilization, time, and diet as factors), with AUC data analyzed with a 2-way ANOVA. No main effects of time (ie, response to mixed meal ingestion; P = .122), immobilization (ie, pre vs post; P = .784), or diet (P = .19), or any interactions (all P > .05) were detected, nor when any significant effects evident when analyzing AUC data (all P > .05).](https://oup.silverchair-cdn.com/oup/backfile/Content_public/Journal/jcem/105/7/10.1210_clinem_dgaa184/5/m_jcem_105_7_e2547_f7.jpeg?Expires=1747866561&Signature=IMCDvs4G4aGZUGXUuh6g2f3zeLudn62~m00D49cTTJpOsHfe8MK~y~vvW0K8OP3~qK2Y0A6LlcUbmFE1pQoEN29RnsGnQrIcVZ1p4dif-lLsAEs22JDPyw~7aHb-r~eieg~GWJxespEgmdRDR8P79FJAj1wyvkB3Dfu7E8EFA8jGczZrvSZlgKZyC6Rg7INlWpRBXEaQYY2Myj-mTRzimetijltkcrMsEgpGiM4o1y~qJ~7Vx9XjurPAMl1V1v48mhnQcBJ6cK4Y2Qv9q1Ft3pu2rkmYuNJ-1xrG0CaWDXP7~5X4-JCeBkOM8kY0WN8kRnG6VC-FubZwhj3Roj9zqg__&Key-Pair-Id=APKAIE5G5CRDK6RD3PGA)
Forearm phenylalanine rate of appearance pre-1 week and post-1 week of forearm immobilization in healthy young men fed A, a eucaloric control diet (CON; n = 11) or B, a high-fat overfeeding diet (HFD; n = 9) providing 50% excess energy from fat in the postabsorptive state (0 minutes) and for a 3-hour postprandial period following the ingestion of a mixed meal. Inset figures represent the postprandial area under the curves (AUCs). CON and HFD data were compared within the same statistical test (3-way analysis of variance [ANOVA] with immobilization, time, and diet as factors), with AUC data analyzed with a 2-way ANOVA. No main effects of time (ie, response to mixed meal ingestion; P = .122), immobilization (ie, pre vs post; P = .784), or diet (P = .19), or any interactions (all P > .05) were detected, nor when any significant effects evident when analyzing AUC data (all P > .05).
Discussion
The present study demonstrates for the first time that muscle disuse leads to a decrease in postabsorptive and postprandial net amino acid accretion within the forearm (ie, a less positive amino acid balance), with the postprandial state being associated with an impairment in muscle amino acid uptake (ie, amino acid rate of disappearance into the forearm) but not changes in MPB (ie, phenylalanine rate of appearance from the forearm). Additionally, although the availability of excess dietary lipids via provision of a high-fat, hypercaloric diet did not affect muscle amino acid uptake or breakdown, it did exacerbate the negative impact of disuse on the ability of food intake to promote a positive amino acid balance across the forearm. Finally, although 1 week of immobilization reduced forearm muscle strength, no loss of forearm muscle mass was detected.
Declining postabsorptive and postprandial (ie, anabolic resistance) MPS rates are widely regarded as key mechanisms responsible for muscle disuse atrophy (4-6). Because postabsorptive MPB rates do not appear to change with disuse (42), it is generally assumed that declines in postabsorptive and postprandial MPS rates manifest as a chronic reduction in muscle protein balance and thus net protein loss. However, the impact of disuse on muscle amino acid net balance had not been confirmed to date. Here, we show that disuse reduced postabsorptive net amino acid balance across the forearm (by 16% and 39% in the eucaloric control group when considering phenylalanine or leucine net balances, respectively), with no additional effect of dietary lipid oversupply (Fig. 4). Our data are in line with declining MPS rates as the primary driver of reduced muscle amino acid balance because postabsorptive forearm protein breakdown (Fig. 7) did not change following immobilization. Under conditions of habitual physical activity (ie, preimmobilization), we report mixed-meal ingestion resulted in circulating amino acid and insulin responses (see Figs. 2 and 3) capable of switching forearm amino acid turnover from net loss to net accretion. Despite equivalent postprandial systemic amino acid supply postimmobilization, the postprandial switch from negative to positive net amino acid balance was impaired. In fact, following disuse participants were unable to mount a positive postprandial net amino acid balance across the forearm so that an approximately 40% reduction in postprandial phenylalanine net balance (expressed as total postprandial AUC) was observed. Although the absence of muscle tissue samples precluded us from measuring MPS rates directly, the parallel lack of change in postprandial phenylalanine release from the forearm (ie, MPB) implies an impaired ability to mount a postprandial net positive protein balance was driven by a reduced stimulation of MPS rates (ie, anabolic resistance). In line with previous work, we did not observe a decline in muscle mass of the forearm (see Fig. 1), which, in contrast to the rapid disuse atrophy evident in leg muscles (1), typically takes more than 1 week to manifest in the forearm (43-45). Accordingly, our data support previous assumptions that the development of muscle anabolic resistance is a key mechanism preceding and responsible for subsequent muscle loss (46). Muscle strength during disuse declined despite the lack of measurable atrophy, corroborating previous findings that function declines more rapidly than mass (47), presumably due to rapid neuromuscular deconditioning (46, 48).
Because anabolic resistance was induced under energy-balanced conditions, the mechanisms seem to be driven by the withdrawal of muscle contraction per se. However, we have recently shown that disuse-induced insulin resistance is associated with an increased nonesterified fatty acid balance across the forearm, even under energy-balanced conditions (12). This opens up the intriguing possibility that altered local lipid trafficking (eg, increased muscle or adipose nonesterified fatty acid uptake, reduced adipose release, and/or altered muscle/adipose crosstalk) may underpin the development of anabolic resistance. To test the role of lipid availability in the perturbation of muscle amino acid metabolism, we hypothesized that provision of a high-fat diet would exacerbate the impact of disuse on postprandial forearm amino acid balance. In line, we observed a further diminishment in the ability of mixed-meal ingestion to improve forearm net amino acid balance under high dietary fat conditions. Although we have repeatedly shown that 5 to 7 days of disuse does not result in frank muscle lipid accumulation (2, 49), we have recently reported that even 1 day of disuse under eucaloric conditions leads to transcriptional changes suggestive of increased lipid intermediate (eg, diacylglycerol) synthesis (11), which translates to muscle accumulation of certain diacylglycerol subspecies within 1 week of bedrest (2). It is therefore plausible that our present data can be explained by intracellular inhibitory effects of such lipid metabolites on myocellular anabolic signaling (16, 18, 50), which occur with disuse per se but are worsened under conditions of dietary lipid oversupply. Interestingly, our amino acid balance calculations suggest that if immobilization had persisted until muscle loss was detectable, we would have observed a 20% to 30% greater rate of muscle atrophy in the HFD group, which is in line with previous work imposing hypercaloric diets over more prolonged periods of disuse (51, 52).
A primary goal of this study was to establish whether anabolic resistance was associated with reduced muscle amino acid uptake, thereby providing evidence for an extracellular rather than intracellular mechanism (ie, a blunting of the “signal” rather than “sensing”). By applying a dual-stable isotope-labeled amino acid approach in parallel with the AV-V forearm balance method, we were able to quantify the impact of disuse on dynamic rates of muscle amino uptake in vivo. Expectedly, the rise in arterial supply of amino acids following mixed-meal ingestion stimulated rates of muscle amino acid uptake (see Fig. 6). In line with our hypothesis, we report that disuse impaired the rise in postprandial forearm muscle amino acid uptake. This result was clearest when tracing plasma leucine disappearance into forearm muscle tissue, where an approximately 20% reduction in peak postprandial leucine uptake was observed following immobilization. This occurred despite brachial artery leucine delivery (ie, flow multiplied by concentration) to the muscle remaining constant, indicating the impairment resides at the level of microvascular flow/muscle perfusion and/or cellular amino acid uptake. In support, it has previously been proposed that age-related insulin resistance of protein metabolism exists because insulin-stimulated endothelial function, muscle perfusion, and muscle transcriptional/translational responses of amino acid transporters are all impaired with age, but overcome by hyperinsulinemic conditions or a single bout of exercise (53-55). Although recent data demonstrate HFD also results in impaired muscle endothelial nitric oxide synthase phosphorylation and content in terminal arterioles (56), here we report that postprandial muscle amino acid uptake was impaired postimmobilization to a similar extent regardless of dietary condition. In keeping with studies showing the stimulatory role of exercise (34), our data therefore indicate that muscle contraction per se is the primary regulator of muscle amino acid uptake.
Although the association of reduced postprandial muscle amino acid uptake under energy-balanced conditions indicates a potential mechanistic link to reduced MPS (which could conceivably exist as a feedforward or feedback loop), the aggravating effect of lipid on muscle amino acid balance only suggests independent mechanisms regulating anabolic sensitivity. That is, lipid oversupply appears to exert its control only via intracellular mechanisms. Thus, it could be speculated that any lipid-induced impairments in myocellular amino acid metabolism (reduced/impaired oxidation and/or reduced ribosomal incorporation into polypeptide chains via the mammalian target of rapamycin–signaling pathway with no consequent reduction of muscle amino acid uptake, as we observed) would result in the accumulation of intracellular (branched-chain) amino acids and consequent overspill (over time) into the circulation. Indeed, intracellular accumulation of branched-chain amino acids has been reported following a period of disuse (5), and we observed an increased muscle leucine release in the present data. This could have important implications because there is a growing literature base demonstrating elevated circulating branched-chain amino acids (and their metabolites) being implicated in the onset of insulin resistance and development of type 2 diabetes (57, 58). Therefore, the presence, relevance, and relation to lipid metabolism of elevated intracellular branched-chain amino acids in various compromised populations warrant future investigation.
The present work demonstrates that disuse reduces postabsorptive and postprandial muscle amino acid net balances (ie, forearm net amino acid accretion), with the latter exacerbated by dietary lipid oversupply. Disuse-induced alterations in muscle amino acid handling were associated with reduced postprandial amino acid uptake in the absence of any changes in MPB. Our data imply that impaired muscle amino acid uptake may be a key mechanistic factor in the etiology of disuse-induced anabolic resistance and that disuse and lipid supply may regulate anabolic sensitivity at differing levels of physiology.
Abbreviations
- aCSA
anatomical cross-sectional area
- AV-V
arterialized venous–deep venous
- CON
eucaloric
- GC-MS
gas chromatography–mass spectrometry
- HFD
high-fat overfeeding
- MPB
muscle protein breakdown
- MPE
mole percent excess
- MPS
muscle protein synthesis
- MRI
magnetic resonance imaging
Acknowledgments
Financial Support: Benjamin T. Wall received funding from The Physiological Society (grant number 103257-R).
Clinical Trial Information: This study has been registered at clinicaltrials.gov as NCT02980952.
Additional Information
Disclosure Summary: The authors have nothing to disclose. All authors have submitted the International Committee of Medical Journal Editors Form for Disclosure of Potential Conflicts of Interest. Conflicts that the editors consider relevant to the content of the manuscript have been disclosed.
Data Availability: The datasets generated during and/or analyzed during the current study are not publicly available but are available from the corresponding author on reasonable request.
References
