


Abstract
Multiple endocrine neoplasia type 1 (MEN1) is a rare autosomal dominant hereditary disease caused by the loss of function of the MEN1 gene, a tumor-suppressor gene that encodes the protein menin. It is characterized by the occurrence of primary hyperparathyroidism (pHPT), duodenopancreatic neuroendocrine tumors (dpNET), pituitary tumors (PIT), adrenal adenomas, and bronchopulmonary (bp-NET), thymic, and gastric neuroendocrine tumors. More insight into factors influencing the age-related penetrance of MEN1 manifestations could provide clues for more personalized screening programs.
To investigate whether genetic anticipation plays a role in the largest known MEN1 families in the Netherlands.
All Dutch MEN1 families with ≥ 10 affected members in ≥ 2 successive generations were identified. Age at detection of the different MEN1-related manifestations were compared among generations using regression analyses adjusted for competing risks. To correct for the beneficial effect of being under surveillance, manifestations occurring during surveillance were also separately compared.
A total of 152 MEN1 patients from 10 families were included. A significantly decreased age at detection of pHPT, dpNET, PIT, and bp-NET was found in successive generations (P < 0.0001). Adjusted analyses led to the same results.
These results suggest the presence of genetic anticipation. However, due to a risk of residual bias, the results must be interpreted with caution. After independent validation in other cohorts and further translational research investigating the molecular mechanisms explaining this phenomenon in MEN1, the results might add to future, more personalized, screening protocols and earlier screening for future generations of MEN1 patients.
Multiple Endocrine Neoplasia type 1 (MEN1) is a rare hereditary disease caused by loss of function of the MEN1 gene. The MEN1 gene is a tumor suppressor gene that encodes the protein menin. It has an estimated prevalence of 2–10 per 100000 and is inherited in an autosomal dominant pattern (1). Although a wide variety of manifestations have been described, most MEN1 patients suffer from (1) primary hyperparathyroidism (pHPT) (90–95%), (2) duodenopancreatic neuroendocrine tumor (dpNET) (35–75%), (3) anterior pituitary tumors (PIT) (20–65%), (4) adrenal adenomas (ADR) (11–35%), and (5) bronchopulmonary (bp-NET), thymic (th-NET), and gastric neuroendocrine tumors (20–30%) (2, 3). MEN1 mutations have a high penetrance, and patients with MEN1 suffer from high morbidity and a decreased life expectancy (4). In particular, th-NET and pancreatic NET are main causes of MEN1-related death (4, 5).
In order to detect MEN1 manifestations in an early stage, periodic screening of MEN1 patients is advised. The present clinical practice guidelines advise to start screening for a number of manifestations at the age of 5 in all MEN1 mutation carriers, and to expand the screening with age (6). Despite numerous efforts, no direct genotype–phenotype correlation has been found to date (7). Although minor familial clustering of specific tumors has been described (8), in general both a considerable phenotypic variability of manifestations, as well as variable age at diagnosis, have been reported (7). More insight into factors influencing the age-related penetrance of MEN1 manifestations could provide clues for more personalized screening programs for MEN1 mutation carriers, potentially leading to a decrease in patient (and parental) burden, as well as lower health care costs.
Genetic anticipation refers to the phenomenon of decreased age of disease onset or an increased disease severity in successive generations. It is best known in neuropsychiatric diseases such as Huntington’s disease and myotonic dystrophy. In these diseases, trinucleotide repeat expansions (“growing genes”) are responsible for the phenotype of genetic anticipation, as the length of the repeat is transmitted in an unstable way and can be influenced by the parental origin (9). More recently, anticipation was also described in forms of heritable cancer such as dyskeratosis congenita, Lynch Syndrome, Li-Fraumeni syndrome, von Hippel-Lindau syndrome, and hereditary breast and ovarian cancer syndrome (10–14). In these syndromes the genetic defect is transmitted without alterations. Partly due to the lack of generally accepted explanatory biological mechanism and a high risk of bias in this field of research, some publications suggested this observation to be the result of different forms of bias (15–17). To our knowledge, data about genetic anticipation within MEN1 families are limited to 1 study, describing a MEN1 family of 5 generations with clinical expression suggestive of anticipation (18). The aim of this nationwide study is to investigate whether genetic anticipation plays a role in the largest known MEN1 families in the Netherlands.
Methods
Patient selection
Since the discovery of the MEN1 gene in 1997 until recently, all genetic testing for MEN1 gene abnormalities in the Netherlands has been performed centrally at the University Medical Center Utrecht. All potential Dutch MEN1 patients and mutation carriers referred for genetic testing between January 1998 and December 2017 were identified. Pedigree information was retrieved from medical records and checked using the Dutch Municipal Resident Registration. Mutation-positive MEN1 families were selected if these families comprised at least 10 affected members in 2 or more successive generations.
Retrieval of clinical information
Clinical information about affected family members was obtained using the national MEN1 database of the Dutch MEN1 study group (DMSG). This database contains longitudinally collected clinical information of patients ≥ 16 years of age at the end of 2017 and treated at 1 of the Dutch university medical centers between 1990 and 2017. The study cohort includes ≥ 90% of the total Dutch MEN1 population. Data of all the patients were collected from every quarter of every available year of follow-up, from 1990 to 2017. Furthermore, data concerning the occurrence of MEN1-related manifestations before 1990 and before 16 years of age were included as well. Detailed information on the DMSG database methods have been described previously (19).
Patients deceased before 1990, < 16 years of age on December 31, 2017, or patients whose clinical or pedigree information was lacking were excluded from this study.
Definitions of MEN1 manifestations
In order to determine the exact prevalence and time of diagnosis of an MEN1-related manifestation, the following definitions of MEN1-related manifestations were used: pHPT was defined as elevated calcium combined with a normal to elevated PTH level in 2 consecutive measurements; dpNET was diagnosed based on tissue examination or—if not available—gastroduodenoscopy (duodenum NET) or ≥ 1 abnormality on imaging studies in at least 2 successive investigations (pancreas NET); pituitary, adrenal, and bp-NET tumors were labeled as such based on histology or—if not available—imaging studies suggestive of these specific tumors in at least 2 successive investigations. Thymic and gastric NET was diagnosed on a histological basis only. Details for the reference standards of MEN1-related manifestations have been described previously (19, 20).
Statistical analysis
Patients were ranked from oldest to youngest generation, based on their position within the family pedigree. Clinical characteristics were reported as mean and standard deviation or median with range based on the distribution of data. Time-to-event methods were used to evaluate the age at detection of MEN1-related manifestations. The patients’ lifetimes from birth until death, lost to follow-up, or the end of follow-up (December 31, 2017) were included for analysis. The age-related penetrance of MEN1-related manifestations were analyzed using cumulative incidence functions, accounting for death as a competing risk. Generations were compared using Gray’s test. Additionally, the effect of generation on phenotype was evaluated using proportional subdistribution hazards regression models, as described by Fine and Gray (21–23). However, these results may overestimate a possible anticipation effect, since these analyses do not take into the account the benefits of surveillance programs: with regular laboratory tests and imaging studies, tumors are more likely to be detected early in life. Since older generations may have profited less from these programs, and manifestations in patients from older generations were more frequently detected because of symptoms rather than presymptomatic screening, results may be distorted. In an attempt to reduce this bias, separate time-to-event analyses were conducted focusing on MEN1-related manifestations occurring in patients within the timeframe that they were under surveillance. In this manner we attempted to reduce the risk of detection bias, since these manifestations were detected in a comparable manner (eg, early diagnosis when being under surveillance) across all generations. Statistical significance was set at a 2-sided P < 0.05. Analyses were performed using IBM SPSS 25.0 and R version 3.4.1.
Results
A total of 10 families were included, comprising 157 MEN1 patients from the DMSG database ≥ 16 years of age at the end of 2017. Five patients were excluded due to insufficient pedigree information. The study population consisted of 80 females (52.6%) with a median age at the end of follow-up (December 31, 2017, or death) of 49 years (range 19–84 years). Genetic analysis was performed in 134 patients (88%), and a mutation (or affected allele) was found in all of these cases. Main features of the 10 families are described in Table 1. The number of affected family members ranged from 11 to 29 per family. A total of 137 affected members (90.1%) showed 1 or more MEN1-related manifestation during follow-up. Primary hyperparathyroidism showed the highest penetrance (121 patients, 80%), th-NET the lowest (2 patients, 1%). Two families showed an unusually low penetrance of MEN1 manifestations: (1) family 6 with mutation c.545T > C(p.Leu182Pro) in exon 3, and (2) family 10 with mutation c.670-6C > G(p.?) in intron 3. The latter family was reported in an earlier study (24).
Characteristics of the MEN1 families.
| MEN1 Manifestations | |||||||||||||
|---|---|---|---|---|---|---|---|---|---|---|---|---|---|
| Family number | Number of MEN1 patients (N) | Number of generations (N) | Gender (N [%] female) | Age (median, range) | Primary hyper-parathyroidism (N, %) | Pancreatic- and duodenal NET (N, %) | Anterior pituitary tumor (N, %) | Adrenal tumor (N, %) | Bp-NET (N, %) | Th-NET (N, %) | Gastric NET (N, %) | Death (N) | MEN1-related death (N) |
| 1 | 29 | 3 | 11 (38) | 45 (19–84) | 27 (93) | 20 (69) | 15 (52) | 12 (41) | 11 (38) | 0 | 0 | 3 | 1a |
| 2 | 23 | 4 | 15 (65) | 50 (21–80) | 23 (100) | 17 (74) | 11 (48) | 10 (43) | 5 (22) | 1 (4) | 0 | 7 | 3b |
| 3 | 18 | 3 | 8 (44) | 51 (22–72) | 15 (83) | 9 (50) | 6 (33) | 6 (33) | 6 (33) | 1 (6) | 0 | 4 | 1c |
| 4 | 14 | 3 | 8 (57) | 52 (19–70) | 12 (86) | 12 (86) | 8 (57) | 6 (43) | 3 (21) | 0 | 1 (7) | 1 | 1d |
| 5 | 12 | 3 | 8 (67) | 51 (22–75) | 10 (83) | 8 (67) | 2 (17) | 2 (17) | 5 (42) | 0 | 0 | 2 | 1e |
| 6* | 12 | 3 | 7 (58) | 52 (28–84) | 3 (25) | 3 (25) | 0 | 1 (8) | 2 (17) | 0 | 0 | 0 | – |
| 7 | 11 | 2 | 9 (82) | 38 (20–63) | 10 (91) | 8 (73) | 4 (36) | 3 (27) | 2 (18) | 0 | 2 (18) | 0 | – |
| 8 | 11 | 3 | 5 (45) | 48 (22–77) | 9 (82) | 6 (55) | 3 (27) | 3 (27) | 4 (36) | 0 | 1 (9) | 2 | 1f |
| 9 | 11 | 4 | 5 (45) | 49 (23–76) | 11 (100) | 8 (73) | 4 (36) | 3 (27) | 3 (27) | 0 | 0 | 3 | 2g |
| 10i | 11 | 2 | 4 (36) | 48 (36–80) | 1 (9) | 1 (9) | 2 (18) | 2 (18) | 2 (18) | 0 | 0 | 1 | 0h |
| TOTAL | 152 | 80 (53%) | 49 (19 – 84) | 121 (80%) | 92 (61%) | 55 (36%) | 48 (32%) | 43 (28%) | 2 (1%) | 4 (3%) | 23 (15%) | 10 (7%) | |
Abbreviation: NET, neuroendocrine tumor.
aMEN1-related: progressive pancreatic NET. Non-MEN1-related: irresectable myxofibrosarcoma (n = 1), end-stage heart failure (n = 1).
bMEN1-related: progressive dpNET (n = 1), progressive th-NET (n = 1), complications of MEN1-related operation (n = 1). Non-MEN1-related: pneumonia (n = 1), heart failure (n = 1), pulmonary embolism (n = 1), unknown (n = 1).
cMEN1-related: progressive th-NET (n = 1). Non-MEN1-related: progressive prostate cancer (n = 1), progressive colorectal cancer (adenocarcinoma) (n = 1), subarachnoid hemorrhage (n = 1).
dMEN1-related: progressive pancreatic NET.
eMEN1-related: progressive pancreatic NET (n = 1). Non-MEN1-related: progressive colorectal cancer (n = 1).
fMEN1-related: progressive nesidioblastoma (n = 1). Non-MEN1-related: dementia (n = 1).
gMEN1-related: progressive dp-NET (n = 2). Non-MEN1-related: unknown (n = 1).
hNon-MEN1-related: progressive colorectal cancer (n = 1).
iFamilies with low penetrance of disease
Age at detection of MEN1 manifestations
A total of 42 patients (28%) were labeled as first generation. The second generation included 68 patients (45%), the third generation included 40 patients (26%), and 2 patients (1%) were identified as fourth generation family members. In all MEN1-related manifestations, the median age at detection was highest in the first generation and lowest in the last (third and fourth) generations. The difference in median age at detection between the first and last generation ranged between 8 years (th-NET) and 40 years (dp-NET). The median age at detection of the first encountered manifestation was 46 (range: 21–73 years) in the first generation, compared with 14 (range: 11–17 years) in the youngest generation. More detailed results are displayed in Table 2.
Age at detection of MEN1 manifestations per generation.
| MEN1 Manifestations | ||||||||||||
|---|---|---|---|---|---|---|---|---|---|---|---|---|
| Generation | Total number of MEN1 patients (N) | Gender (N (%) female) | Age at end of follow-up (median, range) | Primary hyper-parathyroidism | Pancreatic- and duodenal NET | Anterior pituitary tumor | Adrenal tumor | Bp-NET | Th-NET | Gastric NET | Age at first manifestation (yr) (median, range) | |
| 1 | Age / age at detection, year (median, range) | – | – | 67 (30–84) | 46 (21–65) | 60 (23–73) | 49a (24–60) | 55 (41–73) | 57a (43–66) | 46 | 57 (49–69) | 46 (21–73) |
| Year at detection (median, range) | – | – | – | 1991 (1964 – 2014) | 2009 (1981 – 2005) | 2007 (1979 – 2011) | 2002 (1983 – 2012) | 2008 (1983 – 2013) | 1996 | 2008 (2003 – 2017) | – | |
| Number of patients (%) | 42 (28) | 23 (55) | 37 | 29 | 12 | 23 | 10 | 1 | 4 | 40 | ||
| 2 | Age / age at detection, year (median, range) | – | – | 50a (20–73) | 32a(15–58) | 39 (15–61) | 33 (14–47) | 43 (30–64) | 43 (20–65) | 38 | – | 32a (14–61) |
| Year at detection (median, range) | – | – | – | 2001 (1969– 2017) | 2006 (1969– 2016) | 2004 (1987– 2015) | 2006 (1996–2014) | 2011 (2004– 2016) | 2004 | – | – | |
| Number of patients (%) | 68 (45) | 34 (50) | – | 50 | 42 | 21 | 21 | 24 | 1 | 0 | 60 | |
| 3 | Age / age at detection, year (median, range) | – | – | 28a (19–50) | 18 (10–37) | 20 (13–38) | 18a (14–39) | 32 (30–41) | 27 (18–43) | – | – | 17 (10–37) |
| Year at detection (median, range) | – | – | – | 2005 (1987– 2016) | 2010 (1984– 2016) | 2008 (1988– 2014) | 2012 (2003–2016) | 2012 (2005– 2017) | – | – | – | |
| Number of patients (%) | 40 (26) | 22 (55) | 29 | 21 | 20 | 4 | 9 | 0 | 0 | 35 | ||
| 4 | Age / age at detection, year (median, range) | – | – | 24a (23–24) | 14 (11–17) | – | 18a (17–18) | – | – | – | – | 14 (11–17) |
| Year at detection (median, range) | – | – | – | 2008 (2005– 2010) | – | 2011 (2010– 2013) | – | – | – | – | – | |
| Number of patients (%) | 2 (1) | 1 (50) | – | 2 | 0 | 2 | 0 | 0 | 0 | 0 | 2 | |
| TOTAL Age / age at detection, year (median, range) | – | – | 49 (19–84) | 31 (10–65) | 41 (13–73) | 28 (14–60) | 49 (30–73) | 43 (18–66) | 42 (38–46) | 57 (49–69) | 30 (10–73) | |
| TOTAL Number of patients (%) | 152 | 80 (53) | – | 118b | 92 | 55 | 48 | 43 | 2 | 4 | 137 | |
Abbreviations: bp-NET, bronchopulmonary neuroendocrine tumor; NET, neuroendocrine tumor; Th-NET, thymic NET.
aRounded numbers.
bThe moment of diagnosis of pHPT could not be retrieved in 3 additional cases.
Time-to-event analyses showed a significantly higher age-related penetrance of pHPT, dpNET, PIT, and bp-NET in successive generations (Fig. 1). Additional analyses investigating the age at detection of bp-NET based on pathology results alone (n = 13) showed similar results (data not shown). Although younger generations also tend to experience adrenal tumors earlier in life, this trend did not reach statistical significance (P = 0.17). Furthermore, patients from younger generations encountered their first MEN1-related tumor significantly earlier in life. When only focusing on manifestations that occurred under surveillance, the results were the same (Fig. 2). Results from the proportional subdistribution hazards regression models demonstrated evidence of genetic anticipation in MEN1-related manifestations as well. More details are provided in Table 3.
Regression modelsa.
| Manifestationa (During Surveillance) | Generation Number | Hazard Ratio (Generation)b | Standard Error | Wald P-value |
|---|---|---|---|---|
| Primary hyperparathyroidism | First | 1.00b | – | <0.0005 |
| Second | 1.62 | 0.666 | ||
| Third | 11.75 | 0.597 | ||
| Pancreatic- and duodenal NET | First | 1.00b | – | <0.0005 |
| Second | 2.07 | 0.249 | ||
| Third | 4.87 | 0.375 | ||
| Pituitary adenoma | First | 1.00b | – | <0.0005 |
| Second | 1.21 | 0.398 | ||
| Third | 6.53 | 0.388 | ||
| Adrenal tumor | First | 1.00b | – | 0.0076 |
| Second | 2.14 | 0.340 | ||
| Third | 4.90 | 0.587 | ||
| Bronchopulmonary NET | First | 1.00b | – | <0.0005 |
| Second | 3.29 | 0.416 | ||
| Third | 16.00 | 0.533 | ||
| First manifestation | First | 1.00b | – | <0.0005 |
| Second | 3.38 | 0.754 | ||
| Third | 18.43 | 0.718 |
Abbreviation: NET, neuroendocrine tumor.
aProportional subdistribution hazards regression models (described in Fine and Gray (21)), assessing the effect of generation (explanatory covariate) on the occurrence of different MEN1-related manifestations diagnosed during the surveillance period (event of interest). Death and manifestations diagnosed before the start of surveillance are defined as competing risks. The occurrence of gastric NET and th-NET are not modeled due to the low penetrance of these manifestations. Because of the small sample size of the fourth generation (n = 2), this generation is excluded from this analyses.
bThe subdistribution hazard of cumulative incidence function. The first generation is defined as the reference generation.
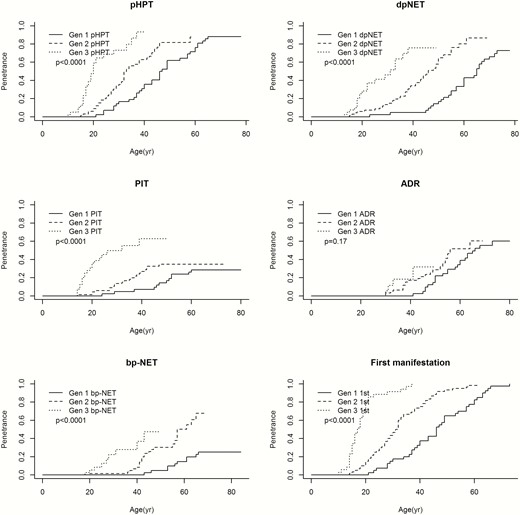
Age-related penetrance of MEN1 manifestations. Due to low penetrance of th-NET and gastric neuroendocrine tumors, these manifestations were not included in the analyses. Because of the small sample size of the fourth generation (n = 2), the age-related penetrance of MEN1 manifestations of this generation are excluded from this analyses. Abbreviations: 1st, first manifestation; ADR, adrenal adenoma; bp-NET, bronchopulmonary neuroendocrine tumor; dpNET, duodenopancreatic neuroendocrine tumor; Gen 1, first generation; Gen 2, second generation; Gen 3, third generation; pHPT, primary hyperparathyroidism; PIT, anterior pituitary tumor.
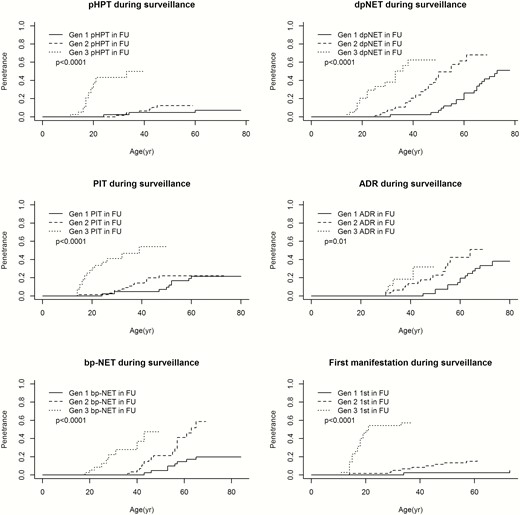
Age-related penetrance of MEN1 manifestations during surveillance. Due to low penetrance of th-NET and gastric neuroendocrine tumors, these manifestations were not included in the analyses. Because of the small sample size of the fourth generation (n = 2), the age-related penetrance of MEN1 manifestations of this generation are excluded from this analyses. Abbreviations: 1st, first manifestation; ADR, adrenal adenoma; bp-NET, bronchopulmonary neuroendocrine tumor; dpNET, duodenopancreatic neuroendocrine tumor; Gen 1, first generation; Gen 2, second generation; Gen 3, third generation; in FU, in follow-up; pHPT, primary hyperparathyroidism; PIT, anterior pituitary tumor.
In order to investigate potential interference, additional analyses were carried out excluding the 2 families with a low penetrance of disease (families 6 and 10), which showed similar results (data not shown). Furthermore, supplementary analyses only comparing the second and third generations demonstrated comparable evidence of genetic anticipation as well (data not shown).
The occurrence of metastatic disease occurring in patients during their time under surveillance—as a proxy for disease severity—was equal across generations (data not shown).
Discussion
Results from this first nationwide and multifamily study on genetic anticipation in MEN1 showed that manifestations occurred significantly earlier in the lives of patients from successive generations. Even with the adjustments for the beneficial effect of surveillance programs, our results suggested the presence of genetic anticipation in MEN1. Since metastasis occurred equally across generations there was no indication of increased disease severity in successive generations.
The study included a cohort of the largest Dutch MEN1 families selected from all referrals for MEN1 mutation testing in the Netherlands, making it very unlikely to have missed any MEN1 family of relevance for answering the study questions. We expect patients from this cohort to represent the general MEN1 population, and we subsequently expect these results to be generalizable to other MEN1 families. Clinical information was obtained using the DMSG database, in which extensive follow-up data of MEN1 patients was collected quarterly using a predefined protocol. Furthermore, possible MEN1 manifestations were interpreted using well-defined criteria. This standardization of data makes it possible to accurately investigate the natural course of MEN1-related manifestations in this population.
It should be noted, however, that studies evaluating the possibility of anticipation always suffer from a significant risk of bias. Especially in retrospective studies, one must be aware of ascertainment bias as a result of selection of families: selection of affected parents with late onset of disease, selection of affected descendants with young onset of disease, and/or selection of cases with simultaneous onset in parents and offspring (25, 26). Our study used predefined inclusion criteria to analyze MEN1 families regardless of penetrance or age at detection in different generations, minimizing the risk of this type of bias.
Furthermore, bias can arise from differences in follow-up time between generations (so-called “truncation bias”) (27) Older generations have been under care for a longer period of time than their offspring and generally will not have been followed for the entire “at risk” period, which can introduce possible bias.
In addition, detection bias can occur in multigenerational studies as a result of a beneficial effect of surveillance programs for individuals at risk. The use of predefined surveillance protocols and well-defined criteria of MEN1 manifestations standardizes follow-up for younger generations. However, older generations have benefited less from these screening methods, introducing a possible delay in diagnosing manifestations compared to younger generations. We attempted to reduce this form of bias by conducting separate time-to-event analyses that only included manifestations detected during the period of time the patients were under surveillance for MEN1.
The effect of different observation periods (time bias) must also be taken into account. The improvement of diagnostics—such as enhanced imaging techniques with higher sensitivity—could have resulted in earlier detection of MEN1 manifestations in later generations. Also, other period-related factors (eg, improvement of medical knowledge, change of potential unknown carcinogenics, or other environmental factors) could have influenced the age at detection of different MEN1 manifestations. However, the average year at detection of dpNET, PIT, and bp-NET did not differ much between generations, suggesting that time bias was not of great influence on these results. As the median year of pHPT and ADR diagnosis differed more across generations, the effect of improved diagnostics or other observation period-related factors cannot be ruled out in these cases.
Finally, the low prevalence of specific MEN1 manifestations (eg, th-NET and gastric NET) and the small sample size of fourth generation family members compromise the precision of estimations regarding the age at detection of MEN1-related manifestations and the possible effect of anticipation. With all these potential biases and limitations in mind, conclusions about the presence of genetic anticipation in MEN1 must be interpreted with caution.
In 1997, Giraud et al implied the possibility of anticipation within MEN1 by describing 1 MEN1 family with clinical expression suggestive of this phenomenon (18). The second and third generations of this particular family showed no clinical evidence of MEN1 to date, whereas in the fourth generation 8 members were affected (including 2 metastatic th-NET, a case of metastatic dpNET, and a spinal ependymoma). All 5 fifth-generation patients showed at least 1 MEN1-related manifestation below the age of 22. More recently, intrafamilial correlations and the heritability of MEN1 manifestations were investigated in a large French cohort of 797 patients. Thevenon et al reported significant heritability of 3 MEN1 manifestations (PIT, ADR, and th-NET). However, genetic anticipation was not a subject of the study (8).
In order to make a valid call on the existence of genetic anticipation in MEN1, both (repeated) conclusive observations of decreased age at detection in successive generations and a commonly accepted explanatory biological mechanism are needed. However, little is known about the possible molecular mechanisms, which could explain anticipation in hereditary cancer syndromes like MEN1.
One potential mechanism involves progressive telomere shortening. In 2004, Vulliamy et al found an association between clinical anticipation and a significant decrease in telomere length in successive generations in autosomal dominant dyskeratosis congenita, possibly owing to haploinsufficiency of the affected gene encoding the RNA component of telomerase (TERC) (10). This association was also reported in hereditary breast cancer syndrome, Li-Fraumeni syndrome, and von Hippel Lindau disease (14, 28, 29). In contrast, an association study of telomere length and single nucleotide polymorphisms (SNPs) in 43 telomere biology genes showed inverse associations between all SNPs included in the MEN1 region and telomere length. This suggests that a loss of function would result in an increased telomere length, which is in contrast to what one would expect (30). However, this assumption has not been investigated in affected MEN1 patients up to now.
A second hypothesis to explain anticipation has been suggested in Lynch syndrome and is based on the progressive accumulation of germline mutations prior to the loss of heterozygosity (31). Possibly (low) levels of microsatellite instability are present in the germ cells of patients with Lynch syndrome, passing on mutant alleles to their offspring. Of course, the molecular functions of mismatch repair genes associated with Lynch syndrome (MSH2, MLH1, MSH6, and PMS2) are incomparable to the functions of menin, which—although not entirely unraveled yet—appear to concentrate on gene expression regulation (32). Therefore, it is very doubtful whether this hypothesis is applicable to MEN1. To our knowledge, impairment of menin function before loss of heterozygosity has not been investigated to date.
A third mechanism for anticipation has been proposed in Li-Fraumeni syndrome. It is suggested that anticipation is caused by the accumulation of DNA copy number variations in the context of TP53 haploinsufficiency (33). Others have proposed an alternative model in which anticipation could be explained by the inheritance of specific risk-increasing factors from the noncarrier parent (34). Studies to explore these theories in MEN1 have not been performed yet.
In conclusion, results from this study showed a decreased age at detection of MEN1 manifestations in successive generations, suggesting the presence of genetic anticipation. However, despite our efforts, it is not possible to draw firm conclusions from these analyses due to the potential risk of residual bias. Our results require confirmation in other large population-based MEN1 cohorts with long-term follow-up to determine the true role of genetic anticipation in MEN1 syndrome. Furthermore, translational research is needed to investigate molecular mechanisms explaining this phenomenon of anticipation in MEN1. The demonstration of genetic anticipation in MEN1 would provide the opportunity for more personalized screening protocols, with the possibility of screening at a younger age in future generations of MEN1 patients.
Acknowledgements
We thank Rebecca Koens and Eric Hennekam for their research on missing pedigree information. This publication would not have been possible without their efforts.
Additional Information
Disclosure Summary: The authors have nothing to disclose.
Data Availability: Restrictions apply to the availability of data generated or analyzed during this study to preserve patient confidentiality or because they were used under license. The corresponding author will on request detail the restrictions and any conditions under which access to some data may be provided.
References
