


Abstract
The lipid profile represents a driver of cardiovascular risk in type 2 diabetes. The effect of chronic insulin therapy on cholesterol levels is unclear. We aim to evaluate the effect of basal insulin on lipid profile compared to other classes of antihyperglycemic agents in type 2 diabetic patients.
We performed a meta-analysis of randomized controlled trials reporting changes of lipid parameters in type 2 diabetic patients randomly assigned to basal insulin or other classes of anti-hyperglycemic agents.
The levels of total (TC) and low-density lipoprotein cholesterol (LDL-C) appeared to be significantly reduced by therapies with glucagon-like peptide-1 receptor agonists (GLP-1RA) in comparison to basal insulin (mean difference [MD] –3.80; 95% CI [–6.30 to –1.30] mg/dL, P < .001 and –4.17; 95% CI [–6.04 to –2.30] mg/dL, P < .0001), whereas no difference was detected between basal insulin and dipeptidyl peptidase-4 inhibitors (DPP4-I) or standard therapy (sulfonylurea ± metformin). Thiazolidinediones (TZD) produced a significant improvement in high-density lipoprotein cholesterol (HDL-C) (MD 3.55; 95% CI: 0.55 to 6.56 mg/dL, P = .02) but were associated with an increase in TC and LDL-C (MD 16.20; 95% CI: 9.09 to 23.31 mg/dL, P < .001 and 5.19: 95% CI: –3.00 to 13.39 mg/dL, P = .21). Basal insulin was superior to standard therapy in triglyceride reduction (MD 3.8; 95% CI: 0.99 to 6.63 mg/dL, P = .008).
GLP-1RA were superior to basal insulin in the control of TC and LDL-C. Basal insulin effectively reduced serum triglycerides. TZD led to improvement in HDL-C. DPP4-I and standard therapy did not have any significant effect on lipid levels.
Type 2 diabetes mellitus is a chronic disease characterized by a progressive loss of beta-cell function (1). As result, the proportion of patients who maintain target glucose levels declined steadily over time and, after 9 years from diagnosis, approximately 20% require insulin therapy (2, 3). Over the past decades, some data have suggested that insulin might accelerate atherogenesis, increasing the incidence of cardiovascular (CV) events and mortality (4, 5). In the Outcome Reduction with an Initial Glargine Intervention (ORIGIN) trial, no increase in the risk of CV death and nonfatal myocardial infarction was observed in patients randomly assigned to glargine (6). Therefore, whether insulin therapy exposes patients to an increased risk of CV events is debatable. Insulin has been shown to increase mitochondrial-derived reactive oxygen species, leading to platelet dysfunction, but its direct effect on plasma lipids is much less clear (7, 8). Acute normalization of glycemic control with insulin can rapidly improve serum lipids, especially triglycerides (TG), but the effect of chronic insulin therapy on cholesterol levels is unclear (9). At the end of the ORIGIN trial, both total cholesterol (TC) and low-density lipoprotein cholesterol (LDL-C) levels were similar between glargine and nonglargine arms, suggesting that chronic insulin treatment with long-acting insulin analogue did not have a major effect on lipid profile. Conversely, Gerstein et al reported a significant amelioration in TG and non–high-density lipoprotein cholesterol (HDL-C) in patients randomly assigned to basal insulin compared to controls (10). Today, there are several glucose-lowering medications with potential ancillary effects on lipid profile. In this context, few reports directly compared the effect of different classes of antihyperglycemic agents on lipids. Monami and colleagues assessed the effect of dipeptidyl peptidase-4 inhibitors (DPP4-I), pioglitazone, insulin secretagogues, and acarbose on plasma lipids, when compared to placebo. They found that DPP4-I, acarbose, and pioglitazone had a more favorable effect on lipid profile than sulfonylureas (11). In a network meta-analysis, the dual combination therapy with metformin plus DPP4-I or glucagon-like peptide-1 receptor agonists (GLP-1RA) led to a greater improvement in lipid profile (12). In a direct comparison, Wang and colleagues found similar efficacy of sitagliptin and GLP-1RA in the reduction of cholesterol (13). Further analysis showed that treatments with GLP-1RA were associated with modest reductions in TC, LDL-C, and TG but no significant improvement in HDL-C (14). To our knowledge, no study directly compared the effect of noninsulin agents vs basal insulin on lipid profile.
We herein present a systemic review and meta-analysis of randomized controlled trials comparing the effect of different classes of antihyperglycemic agents vs basal insulin on lipid profile of type 2 diabetic patients.
Methods
Data sources and searches
We reviewed the literature for randomized controlled trials reporting changes of lipid parameters in type 2 diabetic patients randomly assigned to basal insulin or to any class of antihyperglycemic agents other than insulin. The present systematic review has been performed according to PRISMA (Preferred Reporting Items for Systematic Reviews and Meta-Analyses) guidelines and the protocol was registered in Open Science Framework (https://osf.io/c5nrw/). We considered all studies published in the English literature up to October 2019. The search string was: (“diabetes” OR “diabetic”) AND (“insulin” OR “basal insulin” OR “detemir” OR “glargine” OR “degludec” OR “NPH”) AND (“lipids” OR “lipid profile” OR “cholesterol” OR “LDL cholesterol” OR “HDL cholesterol” OR “total cholesterol” OR “triglyceride”) AND (“glucagon-like peptide-1 receptor agonist” OR “GLP-1RA” OR “exenatide” OR “liraglutide” OR “semaglutide” OR “dulaglutide” OR “albiglutide” OR “thiazolidinediones” OR “glitazones” OR “pioglitazone” OR “rosiglitazone” OR “sulphonylureas” OR “glibenclamide” OR “glyburide” OR “gliclazide” OR “glimepiride” OR “repaglinide” OR “acarbose” OR “dipeptidyl peptidase-4 inhibitors” OR “DPP4-I” OR “sitagliptin” OR “linagliptin” OR “saxagliptin” OR “vildagliptin” OR “alogliptin” OR “sodium-glucose co-transporter-2” OR “SGLT2 inhibitors” OR “canagliflozin” OR “empagliflozin” OR “dapagliflozin”). The search was run first in PubMed and then in ISI Web of Science, Scopus, www.clinicaltrials.gov, and Cochrane Central Register of Controlled Trials. Further articles were identified by hand-searching of relative citations in retrieved studies and reviews. In case of duplicated publication, we included only the article with the most detailed information.
Study selection
We included randomized controlled trials reporting changes of at least one of the following lipid parameters: TC, LDL-C, HDL-C, and TG. We excluded nonrandomized trials, studies not reporting changes of the aforementioned lipids, studies not reporting dispersion measures, and studies in which prandial or premixed insulin were used. Two authors (M.R. and A.A.) independently assessed whether the identified trials fulfilled the inclusion criteria. Disagreements between authors were resolved by consensus.
Data extraction and quality assessment
Two authors (M.R. and S.D.K.) independently extracted data from eligible articles using a predefining protocol. We extracted information on baseline and end point levels of TC, LDL-C, HDL-C, TG, glycated hemoglobin, and weight. We further collected data on age, sex, duration of diabetes, and concomitant lipid-lowering medications. Two authors (M.R. and S.D.K.) independently assessed the methodological quality of the selected studies using the Cochrane risk of bias tool. This scale explores the adequacy of sequence generation, allocation sequence concealment, blinding of participants and caregivers, blinding for outcome assessment, incomplete outcome, selective outcome reporting, and other potential bias. Any disagreements between reviewers in study data extraction and quality assessment that could not be resolved by consensus were resolved by a third reviewer (G.P.F.).
Data synthesis and analysis
Continuous data were reported as mean and SD. If the data were reported as median, mean and SD were estimated. In case of missing data or reporting discrepancies, investigators of the included studies were contacted by email for clarification and provision of requested data. We calculated the mean difference between groups using values recorded at the end of the observation period. If needed, this could be pooled with the mean difference of changes from baseline values, as recommended by the Cochrane Collaboration (15), because the distribution of the 2 estimates is expected to be the same. In the absence of patient’s level data, this approximation leads to a lower risk of bias as compared to the calculation of the mean difference in change from baseline using average baseline and final data of each group. When end point scores and SD for changes from baseline were both missing, we adopted the rule of thumb for absolute change. This rule suggests that the SD of absolute change is connected to the SD of baseline scores according to the following empirical formula: SDchange = square root(2) × SDbaseline (16). All analysis were performed using a random-effects model. The I2 statistic was used to assess heterogeneity among studies (17). Publication bias was assessed by means of funnel plots. The Egger test was used to assess funnel plot asymmetry and publication bias (18). We investigated potential influences on changes in lipid parameters by subgroup analyses and meta-regressions. Prespecified subgroup analyses were conducted according to daily or weekly administration of GLP-1RA. In the meta-regression analysis, changes from baseline in hemoglobin A1c (HbA1c) and body weight were considered as potential moderators of the effect of treatments. All analysis were performed using the Comprehensive Meta-Analysis (CMA, version 2.0) software.
Results
Overall results
The initial electronic search identified 1949 references but only 23 full-text articles were included in the meta-analysis. Fig. 1 illustrates the flowchart of study search, selection, inclusion, and exclusion. Pooled characteristics of the population of included patients (n = 14 133) are summarized in Table 1 (19). Eighteen studies (78%) reported changes of all lipid parameters (6, 10, 20-35), whereas 5 studies (22%) reported only on 3 lipid components (36-40). Basal insulin was glargine in 18 studies (6, 10, 20, 22-24, 26, 28-34, 36, 38-40), neutral protamine Hagedorn (NPH) in 4 studies (21, 25, 35, 37) and detemir in 1 study (27). The comparator was a GLP-1RA in 12 studies (22-24, 26-28, 30, 31, 33, 36, 38, 39), a thiazolidinedione (TZD) in 5 studies (21, 29, 32, 35, 40), a DPP4-I in 3 studies (20, 25, 34) and a sulfonylurea ± metformin in 3 studies (6, 10, 37). According to the Cochrane Collaboration tool, the risk of bias was generally low for all item assessments except for blinding of participants and personnel because of the open-label design of the majority of studies (19). No significant publication bias was noted by the Egger test (19).
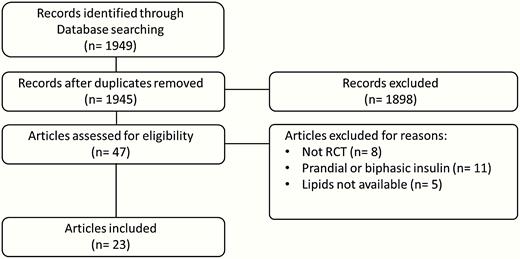
Meta-analysis flowchart.
Pooled Characteristics of Included Studies
| Variables | Value | No. of studies | No. of patients (%) |
|---|---|---|---|
| Age, weight mean ± SD, y | 60 ± 9.5 | 22 | 14 093 (99.7) |
| Male sex, % | 60.2 | 22 | 14 093 (99.7) |
| DM duration, weight mean ± SD, y | 6.6 ± 6.1 | 19 | 13 861 (98.1) |
| Lipid-lowering drugs, % | 53.1 | 8 | 10 250 (72.5) |
| BMI, weight mean ± SD, mq/kg | 30.4 ± 4.9 | 23 | 14 133 (100) |
| HbA1c, weight mean ± SD, % | 7.3 ± 1 | 23 | 14 133 (100) |
| Baseline TOT-C, weight mean ± SD, mg/dL | 186 ± 41 | 18 | 13 817 (97.7) |
| Baseline LDL-C, weight mean ± SD, mg/dL | 106 ± 33 | 21 | 13 886 (98.2) |
| Baseline HDL-C, weight mean ± SD, mg/dL | 46 ± 12 | 20 | 13 670 (96.7) |
| Baseline TGL, weight mean ± SD, mg/dL | 158 ± 118 | 21 | 13 886 (98.2) |
Abbreviations: BMI, body mass index; DM, diabetes mellitus; HbA1c, hemoglobin A1c; HDL-C, high-density lipoprotein cholesterol; LDL-C, low-density lipoprotein cholesterol; TGL, triglycerides; TOT-C, total cholesterol.
Total and low-density lipoprotein cholesterol
The levels of TC and LDL-C were significantly reduced by treatment with GLP-1RA compared to basal insulin (mean difference [MD] –3.80; 95% CI: –6.30 to –1.30 mg/dL and –4.17; 95% CI: –6.04 to –2.30 mg/dL, respectively) (Fig. 2A and 2B). LDL-C decreased similarly both in the weekly and daily GLP-1RA subgroups, whereas TC reduction was significant only with once-weekly GLP-1RAs (Fig. 3A and 3B). In comparison to basal insulin, TZD induced a significant increase in TC (MD 16.20; 95% CI: 9.09 to 23.31 mg/dL) and a nonsignificant increase in LDL-C (MD 5.19: 95% CI: –3.00 to 13.39 mg/dL) (Fig. 2A and 2B). Notably, 3 of the 5 included TZD studies were conducted with rosiglitazone. DPP4-I and standard therapy did not produce relevant changes in cholesterol levels compared to basal insulin (Fig. 2A and 2B). According to meta-regression, the reduction in TC and LDL-C was higher in studies in which treatment with comparators induces a higher reduction in HbA1c and body weight in comparison to basal insulin (19), suggesting that the cholesterol-lowering effect observed for GLP-1RA might be weight loss related.


The differences in means of A, total cholesterol; B, low-density lipoprotein (LDL) cholesterol; C, high-density lipoprotein (HDL) cholesterol; and D, triglycerides in patients on different active drugs vs basal insulin.


Subanalysis according to the different glucagon-like peptide-1 receptor agonists (GLP-1RA) administration schedule. Daily included exenatide twice a day and liraglutide; once weekly included exenatide long-acting release, dulaglutide, and semaglutide.
High-density lipoprotein cholesterol
The levels of HDL-C were significantly increased by treatment with TZD compared to basal insulin (MD 3.55; 95% CI: 0.55 to 6.56 mg/dL) (Fig. 2C) and appeared to be improved by once weekly GLP-1 RAs, although with borderline statistical significance (MD 0.458; 95% CI: –0.01 to 0.92, P = .056) (Fig. 3C). No significant changes in HDL-C were observed for DPP4-I and standard therapy. The changes of HDL-C levels appeared to be independent of variation from baseline in HbA1c and body weight, suggesting that TZD improves HDL-C via direct mechanisms (19).
Triglycerides
Basal insulin significantly improved the levels of TG compared to standard therapy (MD 3.8; 95% CI: 0.99 to 6.63 mg/dL), whereas no differences were observed in comparison to GLP-1RA, DPP4-I, and TZD (Fig. 2D). According to meta-regression, the changes in TG were not associated with the difference of changes from baseline in HbA1c and body weight between comparators and basal insulin (19).
Discussion
To our knowledge, this is the first meta-analysis of randomized controlled trials comparing the effect of noninsulin agents vs basal insulin on lipid profile.
Our results suggest that therapy with GLP-1RA led to greater reductions in TC and LDL-C compared with basal insulin. TZD produced a significant improvement in HDL-C but were associated with an increase in TC and LDL-C, mainly driven by studies with rosiglitazone. Changes in TC, LDL-C, and HDL-C induced by DPP4-I and standard therapy (sulphonylureas ± metformin) were similar to those observed with basal insulin. Basal insulin was superior to standard therapy in TG reduction.
The selection of an optimal agent in the treatment of type 2 diabetes still represents a challenge given that many innovative therapies are effective not only in reducing blood glucose, but exert beneficial effects on other traditional CV risk factors, such as blood pressure, body weight, and lipid profile (41). These extraglycemic effects are of great interest because the higher benefit in preventing CV events in diabetic patients results from multifactorial intervention (42). Consensus of the American Diabetes Association/European Association for the Study of Diabetes recommends GLP-1RA or sodium-glucose cotransporter-2 inhibitors as second-line therapy after metformin, relegating insulin initiation after failure of multiple noninsulin drugs or in case of severe hyperglycemia with evidence of catabolism (43). GLP-1RA have been proposed as the preferred choice in patients who need injectable therapy. Compared to insulin, GLP-1RA showed at least similar efficacy in HbA1c reduction, with lower risk of hypoglycemia and reduction of body weight. Furthermore, CV outcome trials have shown the ability of 4 GLP-1RA (liraglutide, semaglutide, albiglutide, and dulaglutide) to reduce the risk of CV events in patients with type 2 diabetes (44-47). Although the exact mechanisms by which GLP-1RA confer CV protection are still partly unknown, some authors speculated a role of the improvement in traditional risk factors, including a modest reduction in LDL-C. The favorable effects of GLP-1RA on lipid profile has been consistently observed in previous meta-analyses and relevant clinical trials (48, 49). A meta-analysis of Liraglutide Effect and Action in Diabetes trials demonstrated that liraglutide significantly decreased TC and LDL-C levels compared to insulin, TZD, and placebo (48). Significant improvements in TC and LDL-C have been also observed for long-acting release exenatide and once-weekly semaglutide in the series of DURATION (Diabetes Therapy Utilization: Researching Changes in A1C, Weight and Other Factors Through Intervention with Exenatide Once Weekly) and SUSTAIN (Semaglutide unabated Sustainability in Treatment of Type 2 Diabetes) trials, respectively (50, 51). In a recent network meta-analysis, a significant reduction in LDL-C was observed for all considered GLP-1RA (exenatide, liraglutide, and taspoglutide) vs placebo, insulin, and TZD (52). To date, the mechanisms of beneficial effect on lipid profile for GLP-1RA are not completely understood. These may be an effect of improvements in glucose control and body weight, resulting in amelioration of insulin resistance with a reduction of free fatty acid flux to the liver (53). Other possible mechanisms observed with liraglutide and exenatide may involve a GLP-1 receptor signaling on intestinal mucosa, which results in a reduced secretion of apolipoprotein B48-containing chylomicrons and subsequent decreased absorption of TG (54).
Over the past decades, insulin was suspected to exert unfavorable effects on the lipid profile and to be atherogenic. However, clinical trials and meta-analyses indicate that basal insulin can produce improvements in all components of the lipid profile (TC, LDL-C, HDL-C, TG) through a variety of mechanisms (10, 32, 55, 56). Insulin suppress peripheral lipolysis and inhibits hepatocyte production of TG and very low-density lipoproteins. Moreover, insulin may promote LDL-C clearance and HDL lipoprotein synthesis through induction of apolipoprotein A1 in the liver. The ORIGIN trial established the neutral cardiovascular effect of insulin glargine, compared to standard therapy, in a cohort of patients with multiple risk factors plus impaired fasting glucose, impaired glucose tolerance, or type 2 diabetes. At the end of trial, levels of total and LDL-C were similar between insulin and control arms.
Although LDL-C is actually considered the major lipid target, type 2 diabetes is typically associated with a cluster of metabolically linked lipid abnormalities, leading to increased production of TG and low levels of HDL (57). TZD are a class of insulin-sensitizer drugs with proven beneficial effects on the lipid profile mediated by binding to peroxisome-activated receptor gamma-γ (58). Pioglitazone and rosiglitazone have both been shown to increase HDL-C and reduce TG. However, unlike pioglitazone, rosiglitazone increased TC and LDL-C (59, 60). Why these medications exert different effects on LDL-C in an open issue. Both therapies increased the average size of LDL particles, but the effect of pioglitazone was greater than that of rosiglitazone. Pioglitazone did not change apolipoprotein B levels but did reduce LDL particle concentration. Conversely, rosiglitazone increased both apolipoprotein B and LDL particle concentration (61). However, it is unclear whether these findings might explain the controversial increase in the risk of myocardial infarction observed with rosiglitazone. On the other hand, it has been suggested that the more beneficial effects of pioglitazone on the lipid profile might have contributed to the significant reduction of the main secondary end point (composite of all-cause mortality, nonfatal myocardial infarction and nonfatal stroke) observed in the PROactive (PROspective pioglitAzone Clinical Trial In macroVascular Events) study (62). Our results, in line with those reported in a previous pooled analysis, showed that TZD increase the levels of TC and LDL-C and significantly improve HDL-C compared to insulin glargine.
DPP4-I have previously been shown to reduce TC and LDL-C compared to placebo and pioglitazone (63). In our meta-analysis changes in lipid profile in patients treated with DPP4-I were similar to those observed with basal insulin.
In this meta-analysis, the improvements in LDL-C, HDL-C, and TG were small and ranged from the order of 3 to 5 mg/dL. It is unclear whether the magnitude of these differences might be sufficient to produce a clinically relevant cardiovascular benefit. Previous analysis suggested that each 1-mmol/L (38.6-mg/dL) reduction in LDL-C with a statin produced a relative reduction in major CV events of 21% over 5 years (63). Therefore, a reduction of 4.1 mg/dL with a GLP-1RA might account for a 5% decrease in the risk of coronary events. A pooled analysis of 4 large American prospective studies reported that each 1-mg/dL increment in HDL-C was associated with a 2% to 3% reduction in the risk of coronary heart disease (64). Therefore, the 3.5-mg/dL increase in HDL-C observed with TZD might be of clinical interest. TG lowering has been shown to reduce CV risk to a lesser extent than LDL-C. Specifically, a decrease in 40 mg/dL in TG is associated with a 4% to 5% lower CV risk (65). Thus, the 3.8-mg/dL reduction in TG observed with basal insulin may be clinically irrelevant.
To our knowledge, no studies have reported changes of lipid parameters in diabetic patients randomly assigned to basal insulin or sodium-glucose cotransporter 2 (SGLT2) inhibitors. However, SGLT2 inhibitors share a modest effect on lipid profile. In particular, an increase of TC, LDL-C, and HDL-C, as well as a reduction in serum TG, has been observed (66-69).
Several limitations of our meta-analysis have to be acknowledged. First, changes in lipid profile were not the primary outcome among included trials. Therefore, study sample sizes may have been insufficient to detect a significant difference in lipid parameters between basal insulin and active comparators. Yet, in most randomized controlled trials, lipid profile is determined at centralized laboratories, thereby ensuring comparability of the results. Second, the improvement of glycemic control and body weight may have induce some beneficial effects on the lipid profile independently of the class of antidiabetic agent. We tried to explore this bias by meta-regressions, which suggested a potential role of weight loss underlying the improvements in TC and LDL-C. Third, any conclusive result needs to be tapered considering the high heterogeneity among studies with GLP-1RA and TZD. Furthermore, lipid-lowering therapy was reported in only a minority of studies leading to the impossibility of understanding in which extent changes in the lipid profile were attributable to the underlying therapies with statins or fibrates. It is also reasonable that some of patients with higher levels of cholesterol received a lipid-lowering medication during trials, thus influencing between-groups differences.
In conclusion, GLP-1RA were superior to basal insulin in the control of TC and LDL-C. These positive effects may partly account for the CV protection observed in CV outcome trials with some GLP-1RA but not with insulin glargine. Basal insulin effectively reduces serum TG. TZD leads to improvement in HDL-C, whereas DPP4-I and standard therapy did not have any significant effect on lipid levels.
Abbreviations
- CV
cardiovascular
- DPP4-I
dipeptidyl peptidase-4 inhibitors
- GLP-1RA
glucagon-like peptide-1 receptor agonists
- HDL
high-density lipoprotein
- LDL
low-density lipoprotein
- ORIGIN
Outcome Reduction with an Initial Glargine Intervention trial
- TC
total cholesterol
- TG
triglycerides
- TZD
thiazolidinediones
Acknowledgments
Financial Support: This study is supported by University of Padova.
Author Contributions: M.R. and A.A. designed the study and performed data collection, analysis, and manuscript writing. S.D.K. performed data collection. G.P.F. and A.A. revised the manuscript. All authors read and approved the final version of the manuscript. M.R. is the guarantor of this work and, as such, had full access to all the data in the study and takes responsibility for the integrity of the data and the accuracy of the data analysis.
Additional Information
Disclosure Summary: M.R. has received lecture and advisory board fees from AstraZeneca, Boehringer, Lilly, Mundipharma, Novo Nordisk, and Sanofi. A.A. has received research grants, lecture, or advisory board fees from Merck Sharp-Dome, AstraZeneca, Novartis, Boeringher-Ingelheim, Sanofi, Mediolanum, Janssen, and Novo Nordisk. S.D.K. has received lecture or consultancy fees from AstraZeneca, Bruno Farmaceutici, Lilly, Merck Sharp-Dome, and Servier. G.P.F. has received lecture fees or grant support from Abbott, AstraZeneca, Boehringer, Lilly, Merck-Sharp-Dome, Mundipharma, Novartis, Novo Nordisk, Sanofi, and Servier.
Data Availability: All data generated or analyzed during this study are included in this published article or in the data repositories listed in References.
