


Abstract
Plasma branched chain amino acid (BCAA) concentrations correlate positively with body mass index (BMI), measures of insulin resistance (IR), and severity of nonalcoholic fatty liver disease (NAFLD). Moreover, plasma BCAA concentrations also differ between the sexes, which display different susceptibilities to cardio-metabolic diseases.
Assess whether plasma BCAA concentrations associate with NAFLD severity independently of BMI, IR, and sex.
Patients visiting the obesity clinic of the Antwerp University Hospital were consecutively recruited from 2006 to 2014.
A cross-sectional study cohort of 112 obese patients (59 women and 53 men) was divided into 4 groups according to NAFLD severity. Groups were matched for sex, age, BMI, homeostatic model assessment of IR, and hemoglobin A1c.
Fasting plasma BCAA concentrations were measured by tandem mass spectrometry using the aTRAQ™ method.
In the study cohort, a modest positive correlation was observed between plasma BCAA concentrations and NAFLD severity, as well as a strong effect of sex on plasma BCAA levels. Subgroup analysis by sex revealed that while plasma BCAA concentrations increased with severity of NAFLD in women, they tended to decrease in men. Additionally, only women displayed significantly increased plasma BCAAs with increasing fibrosis.
Plasma BCAA concentrations display sex-dimorphic changes with increasing severity of NAFLD, independently of BMI, IR, and age. Additionally, plasma BCAA are associated with significant fibrosis in women, but not in men. These results highlight the importance of a careful consideration of sex as a major confounding factor in cross-sectional studies of NAFLD.
Nonalcoholic fatty liver disease (NAFLD) is a major global public health problem. NAFLD covers a spectrum of conditions from simple hepatic triglyceride accumulation, termed nonalcoholic fatty liver (NAFL), to more severe nonalcoholic steatohepatitis (NASH), which combines NAFL with hepatic necroinflammation (1). Patients with NASH are at high risk for progressive liver fibrosis, hepatocellular carcinoma, and cardiovascular disease (2). Recent studies indicate that NAFLD progression and incidence are significantly influenced by sex, suggesting NAFLD may be a sexually dimorphic disease (3,4).
Development of noninvasive diagnostic markers for NAFLD remains a major challenge. Current guidelines for accurate NAFLD diagnosis require liver biopsy (5,6), which is invasive and susceptible to interobserver discrepancies (7,8). Noninvasive imaging, individual biochemical markers, and combined clinical and biochemical score-based methods are being developed but have not yet been accepted as a valid substitute for histological diagnosis. Thus, there is an urgent need to identify accurate markers of NAFLD stages, especially NASH and fibrosis, to simplify disease staging for diagnosis and monitoring treatment response. Moreover, as biological plausibility is an important feature of these noninvasive markers, their identification often yields insight into disease mechanisms.
The branched chain amino acids (BCAA) leucine, valine, and isoleucine are essential amino acids whose plasma concentrations are increased in metabolic diseases such as obesity and type 2 diabetes (9-11). Recently, plasma BCAA were also found to be increased in NAFLD patients compared to patients without NAFLD (12-14). Interestingly, a recent large-scale population study demonstrated that plasma BCAA and their degradation products were elevated in men compared to women (15). Given the known discrepancies between men and women in metabolic disease susceptibility and the interaction between obesity, insulin resistance (IR), and NAFLD (9,11,16-20), it is currently unclear whether changes in plasma BCAA are specifically related to NAFLD progression or rather to accompanying metabolic alterations.
Consequently, the aim of this study was to determine whether changes in plasma BCAA concentrations are specifically associated with severity of NAFLD in humans. We measured plasma BCAA concentrations in a well-characterized patient cohort with histologically assessed NAFLD. Our results show that plasma BCAA levels vary with increasing severity from NAFL to NASH in a sex-dependent manner, independently of alterations in glucose metabolism.
Methods
Description of the patients
Patients were consecutively recruited at the metabolic unit of the obesity clinic of the Antwerp University Hospital (a tertiary referral facility) from October 2006 to May 2014. The study protocol, part of the HEPADIP protocol (Belgian registration number B30020071389), was approved by the Ethical Committee of the Antwerp University Hospital (file 6/25/125) and required written informed consent of the patient. Inclusion criteria were previously described (21). Briefly, patients underwent extensive metabolic characterization and systematic noninvasive screening for the presence of NAFLD (e.g., plasma alanine transaminase, aspartate transaminase, and gamma glutamyltransferase measurements and ultrasound features) and proposed for liver biopsy upon suspicion of NAFLD. Liver biopsy was performed percutaneously (16G Menghini), transjugularly (16G transjugular liver biopsy needle), or perioperatively (16G Trucut needle) for patients who subsequently underwent bariatric surgery. The herein described assessment, including liver biopsy, was performed before any treatment initiation or consideration.
Clinical assessment and biological assay
Fasting plasma glucose and insulin were measured as previously described (22). IR was estimated using both the homeostatic model assessment of IR (HOMA-IR) calculated by (insulin [mU/L] × glucose [mmol/L])/22.5 and using the updated homeostasis model assessment (HOMA2) from Levy et al (23), which estimates insulin resistance (HOMA2-IR), steady state beta cell function (HOMA2-B), and insulin sensitivity (HOMA2-S), as percentages of a normal reference population.
Liver histology
Hematoxylin and eosin, Sirius red, reticulin, and Perls iron stains were routinely performed on all liver biopsies and analyzed in batch by 2 experienced pathologists blinded to clinical data. The histological features of NAFLD (steatosis, ballooning, lobular inflammation and fibrosis) were assessed using the NASH Clinical Research Network Scoring System (5). According to biopsy evaluation, patients were divided in 4 groups: healthy, NAFL, NASH, and NASH with significant fibrosis. The healthy group was defined as steatosis = 0, ballooning = 0, lobular inflammation = 0, and fibrosis = 0. The NAFL group included patients with steatosis > 0 and allowing some presence of either ballooning or lobular inflammation, but not meeting the criteria for NASH. NASH diagnosis required the combined presence of steatosis, ballooning, and lobular inflammation, according to current guidelines (24,25). Patients with NASH were subsequently divided according to fibrosis stage: NASH without significant fibrosis (fibrosis ≤ 1) and NASH with significant fibrosis (NASH-F; fibrosis ≥ 2).
Plasma amino acid measurements
Blood samples were collected in ethylenediamine tetra-acetate–coated tubes after an overnight fast. Isolated plasma was aliquoted, immediately frozen, and stored at −80°C until analysis. Targeted metabolomics was performed to quantify plasma amino acids using the aTRAQ™ Kit (Sciex, Framingham, MA, US) as described previously (26). Briefly, plasma amino acids were amine-modified using the aTRAQ™ labeling reagent, which provides a specific mass tag for tandem mass spectrometry (MS). The tag is identified by MS/MS fragmentation of samples and standards while in multiple reaction monitoring mode. An internal standard (IS) set of aTRAQ™ labeled amino acids was used for detection and quantification by high performance liquid chromatography (Shimadzu C18 column, Kyoto, Japan) associated with MS/MS (Sciex 3200 Qtrap, Framingham, MA, US). Quantification was performed dividing the peak area for each analyte by the peak area of the corresponding IS and multiplying by the IS concentration.
Rationale of study group composition
As outlined in the previous discussion, BCAA metabolism and concentrations are influenced by body mass index (BMI), diabetes, and sex. These factors are poorly accounted for when studying the relationship between BCAA concentrations and presence and severity of NAFLD. To unequivocally study the relation between plasma BCAA concentrations and NAFLD severity, the following approach was used. Patients were first classified into clearly distinct groups (NAFLD stages) based on their liver histological phenotype as follows: healthy liver, NAFL, NASH, and NASH-F (see histology section) or unclassified (i.e., patients not clearly falling into one of the previously defined categories). Patients were subsequently selected from the 4 well-defined NAFLD stages to compose groups of equal size that were further matched for the following parameters: BMI, fasting plasma glucose (FPG), HOMA-IR, hemoglobin A1c (HbA1c), and age. Finally, an equal number of men and women was included in each study group when possible.
Statistical analysis
Patient selection was performed using regression-based matching in R (matchit package R-project) considering clinical parameters as previously described. Values are expressed as mean ± standard deviation (mean ± SD) or median ± interquartile range (IQR) as indicated in the figure legends. Statistical differences in clinical and biological parameters were assessed by Mann–Whitney or analysis of variance test for quantitative values and Chi-squared test for categorical values. The Spearman rank test was used to determine correlation between variables. All univariate correlations were then verified in a linear model adjusting for BMI, HOMA-IR, and sex. P-values less than 0.05 were considered statistically significant.
Results
Patient selection and matching
Among all consecutively recruited patients with available clinical information (n = 408) and fasting plasma samples, 4 study groups corresponding to different stages of NAFLD were established (study cohort) as described in the methods section. This process resulted in 4 clearly distinct liver phenotypical groups of about 30 patients, matched for BMI, FPG, HOMA-IR, HbA1c, and age. For the healthy liver group, a lower number of patients who met both the histological phenotype and all matching criteria was available (n = 23). As outlined in the methods section, an equal number of men and women was included in each study group when possible. The clinical, biological, and liver histological characteristics of the patients are shown in Table 1. Overall, 112 patients were divided over the 4 groups as follows: 23 healthy liver (15 women and 8 men), 30 with NAFL (15 women and 15 men), 30 with NASH (15 women and 15 men), and 29 with NASH-F (14 women and 15 men). As per the matching protocol, the 4 groups did not show significant differences in sex, age, BMI, FPG, HOMA-IR, and HbA1c (Table 1).
Clinical, biological and liver histological characteristics of patients according to NAFLD stage
| NAFLD Stage | All Patients | Healthy | NAFL | NASH | NASH-F | P-value |
|---|---|---|---|---|---|---|
| n | 112 | 23 | 30 | 30 | 29 | |
| Sex (women/men) | 59/53 | 15/8 | 15/15 | 15/15 | 14/15 | 0.61 |
| Age (years) | 42.6 ± 12.5 | 40 ± 12 | 43 ± 11 | 43 ± 13 | 43 ± 13 | 0.75 |
| BMI (kg/m2) | 40.5 ± 6.5 | 38 ± 4.9 | 42 ± 6.5 | 39 ± 4.5 | 41 ± 5.7 | 0.11 |
| Fasting plasma glucose (mg/dL) | 86 ± 10 | 85 ± 9.9 | 86 ± 13.6 | 87 ± 11.9 | 89 ± 8.8 | 0.23 |
| HbA1c (%) | 5.6 ± 0.5 | 5.4 ± 0.3 | 5.6 ± 0.4 | 5.6 ± 0.4 | 5.5 ± 0.6 | 0.32 |
| HOMA-IR | 4.1 ± 2.8 | 4.2 ± 4.7 | 3.5 ± 1.8 | 4.0 ± 2.4 | 4.3 ± 1.5 | 0.32 |
| HOMA2-B (%) | 181 ± 69 | 177 ± 65 | 186 ± 80 | 185 ± 73 | 174 ± 58 | 0.82 |
| HOMA2-S (%) | 57 ± 36 | 64 ± 46 | 48 ± 24 | 58 ± 28 | 60 ± 37 | 0.95 |
| HOMA2-IR | 2.3 ± 1.4 | 1.9 ± 0.9 | 2.8 ± 2 | 2.3 ± 1.2 | 2.1 ± 0.8 | 0.64 |
| Steatosis grade (0,1,2,3) | 23/39/25/25 | 23/0/0/0 | 0/22/8/0 | 0/12/6/12 | 0/5/11/13 | <0.0001 |
| Ballooning (0,1,2) | 43/46/23 | 23/0/0 | 20/7/3 | 0/18/12 | 0/21/8 | <0.0001 |
| Lobular inflammation (0,1,2,3) | 41/44/21/6 | 23/0/0/0 | 18/10/2/0 | 0/20/8/2 | 0/14/11/4 | <0.0001 |
| Fibrosis stage (0,1,2,3,4) | 69/12/23/8/0 | 23/0/0/0/0 | 26/2/2/0/0 | 20/10/0/0/0 | 0/0/21/8/0 | <0.0001 |
Data are expressed as mean ± standard deviation. P-values are obtained using the Chi-square test for qualitative data and the analysis of variance test for quantitative data. P-values < 0.05 are considered statistically significant (bold).
Plasma BCAA concentrations highly associate with sex but not with NAFLD stages
Plasma concentrations of the 3 BCAA in the study cohort were measured, and correlations between plasma BCAA concentrations and NAFLD stage were assessed. In agreement with previous studies (12-14), plasma leucine and, to a greater extent, plasma isoleucine correlated with NAFLD stage (Spearman coefficient: rho = 0.17, P = 0.06 and rho = 0.25, P < 0.01, respectively) (Fig. 1A, 1C). However, plasma valine concentrations did not significantly correlate with NAFLD stage (Fig. 1B).
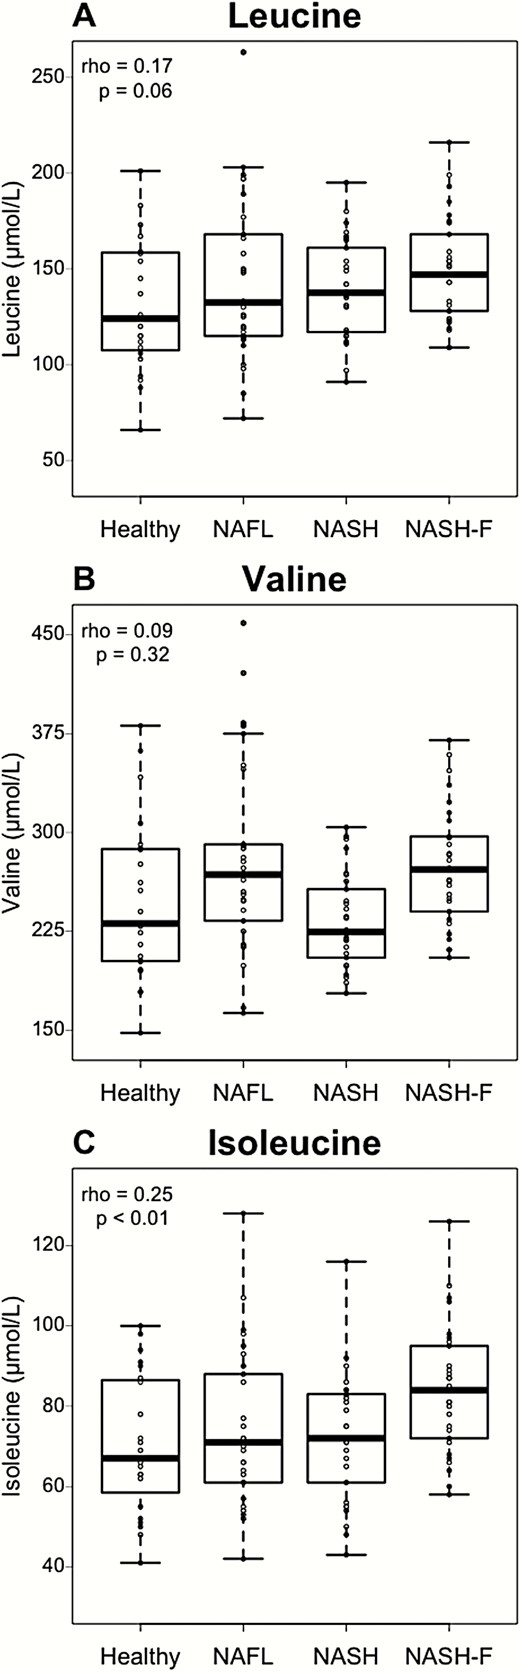
Plasma leucine and isoleucine but not valine are positively correlated to NAFLD stage. Plasma BCAA concentrations according to NAFLD stage in healthy (n = 23), NAFL (n = 30), NASH (n = 30), and NASH-F (n = 29) patients. Data are expressed as median ± IQR. Rho coefficients and P-values are obtained using the Spearman rank test.
To assess which factor most contributed to plasma BCAA variation in the study cohort, we calculated the correlations between BCAA and several known confounding factors (ie, age, BMI, HOMA-IR, and sex). Interestingly, sex showed the strongest association with plasma BCAA concentrations when compared to age, BMI, HOMA-IR, and NAFLD stage (Fig. 2). As expected based on the patient stratification strategy, no or minor correlations were observed between BCAA and age, BMI, and HOMA-IR. Moreover, we calculated the Spearman correlation coefficient between plasma BCAA and HOMA2 parameters (HOMA2-IR) and no significant correlations were observed (Fig. 2).
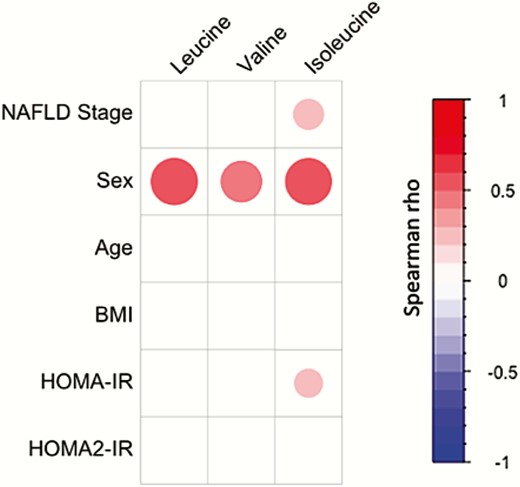
Plasma BCAA concentrations are strongly associated with sex. Spearman correlations between plasma BCAA concentrations and NAFLD stage, sex, age, BMI, and HOMA-IR and HOMA2-IR in the study cohort (n = 112). Colors and area of circles reflect the Spearman rho values (red for positive, blue for inverse correlations). Only correlations with significant P-value (P < 0.05) were represented.
To confirm this specific correlation of plasma BCAA with sex, independently of BMI, age, and glucose homeostasis parameters, a linear model including age, BMI, HOMA-IR, NAFLD stage, and sex was developed. This model confirmed an independent association between the 3 BCAA plasma concentrations and sex (P < 0.001). We consequently analyzed the BCAA concentrations in the study cohort separating men and women, irrespective of NAFLD status. The plasma concentrations of the 3 BCAA were higher in men compared to women (P < 0.001) (Fig. 3A-C), indicating that sex is a major determinant of plasma BCAA concentrations.

Plasma BCAA are affected by sex. BCAA concentrations in women (n = 59) and men (n = 53). Data are expressed as median ± IQR. P-values are obtained using the Mann–Whitney test.
Sex differentially influences the correlation of plasma BCAA with NAFLD severity
Due to the strong effect of sex on plasma BCAA concentrations, men and women were subsequently analyzed separately. Clinical, biological, and liver histological characteristics of the patients separated according to sex (53 men and 59 women) and NAFLD stage are shown in Table 2. The NAFLD subgroups stratified by sex remained matched according to age, BMI, and glucose homeostasis parameters (Table 2), as was the case for the 4 initial groups (Table 1). Moreover, average age, BMI, FPG, HOMA-IR, HbA1c, and liver histological characteristics were not different between men and women (Table 3). For women, menopause status was collected, and the proportion of postmenopausal women did not differ with NAFLD severity (Table 2). Moreover, for women with NASH (n = 29), we observed no significant differences in the plasma BCAA concentrations between pre menopausal (n = 18) and postmenopausal (n = 11) women (data not shown). The low numbers of postmenopausal patients in the healthy and NAFL groups did not permit the same comparison. Still, these results suggest that menopause alone is unlikely to lead to a major difference in plasma BCAA levels in the context of NAFLD.
Clinical, biological, and liver histological characteristics of the patients according to sex and NAFLD stage
| Characteristics | Healthy | NAFL | NASH | NASH-F | p-value |
|---|---|---|---|---|---|
| Men | |||||
| n | 8 | 15 | 15 | 15 | |
| Age | 38 ± 15 | 45 ± 11 | 41 ± 13 | 40 ± 11 | 0.48 |
| BMI (kg/m2) | 39 ± 4.6 | 41 ± 8.5 | 38 ± 4.6 | 39 ± 4.1 | 0.38 |
| Fasting Plasma Glucose (mg/dL) | 89 ± 12 | 88 ± 14 | 85 ± 6 | 89 ± 9 | 0.99 |
| HbA1c (%) | 5.5 ± 0.3 | 5.6 ± 0.5 | 5.6 ± 0.3 | 4.9 ± 0.3 | 0.99 |
| HOMA-IR | 5.8 ± 7.3 | 3.4 ± 1.2 | 3.6 ± 2.2 | 4 ± 1.3 | 0.95 |
| HOMA2-B (%) | 169 ± 33 | 162 ± 59 | 216 ± 79 | 171 ± 59 | 0.51 |
| HOMA2-S (%) | 56 ± 21 | 55 ± 26 | 51 ± 35 | 56 ± 23 | 0.94 |
| HOMA2-IR | 1.9 ± 0.6 | 2.3 ± 4.6 | 2.6 ± 1.2 | 2.1 ± 0.8 | 0.91 |
| Steatosis grade (0,1,2,3) | 8/0/0/0 | 0/11/4/0 | 0/7/3/5 | 0/1/6/8 | <0.0001 |
| Ballooning (0,1,2) | 8/0/0 | 7/6/2 | 0/10/5 | 0/11/4 | <0.0001 |
| Lobular inflammation (0,1,2,3) | 8/0/0/0 | 11/3/1/0 | 0/10/4/1 | 0/8/5/2 | <0.0001 |
| Fibrosis stage (0,1,2,3,4) | 8/0/0/0/0 | 12/1/2/0/0 | 10/5/0/0/0 | 0/0/11/4/0 | <0.0001 |
| Women | |||||
| n | 15 | 15 | 15 | 14 | |
| Age | 41 ± 11 | 42 ± 13 | 46 ± 14 | 45 ± 15 | 0.28 |
| BMI (kg/m2) | 38 ± 5.2 | 42 ± 4.8 | 39 ± 4.4 | 42 ± 6.8 | 0.13 |
| Fasting plasma glucose (mg/dL) | 83 ± 8 | 86 ± 13 | 89 ± 16 | 90 ± 9 | 0.16 |
| HbA1c (%) | 5.4 ± 0.4 | 5.6 ± 0.4 | 5.6 ± 0.6 | 5.6 ± 0.8 | 0.25 |
| HOMA-IR | 3.2 ± 1.6 | 3.6 ± 2.1 | 4.4 ± 2.7 | 4.7 ± 1.8 | 0.06 |
| HOMA-2B (%) | 181 ± 78 | 211 ± 93 | 154 ± 52 | 177 ± 59 | 0.42 |
| HOMA-2S (%) | 68 ± 56 | 41 ± 21 | 65 ± 41 | 64 ± 48 | 0.85 |
| HOMA2-IR | 2.0 ± 1.1 | 3.3 ± 2.4 | 2 ± 1.1 | 2.1 ± 0.8 | 0.54 |
| Menopause (no/yes) | 13/2 | 12/3 | 9/6 | 9/5 | 0.31 |
| Steatosis grade (0,1,2,3) | 15/0/0/0 | 0/11/4/0 | 0/5/3/7 | 0/4/5/5 | <0.0001 |
| Ballooning (0,1,2) | 15/0/0 | 13/1/1 | 0/8/7 | 0/10/4 | <0.0001 |
| Lobular inflammation (0,1,2,3) | 15/0/0/0 | 7/7/1/0 | 0/10/4/1 | 0/6/6/2 | <0.0001 |
| Fibrosis stage (0,1,2,3,4) | 15/0/0/0/0 | 14/1/0/0/0 | 10/5/0/0/0 | 0/0/10/4/0 | <0.0001 |
Data are expressed as mean ± standard deviation. P-values are obtained using the Chi-square test for qualitative data and the analysis of variance test for quantitative data. P-values < 0.05 are considered statistically significant (bold).
Clinical, biological, and liver histological characteristics of the patients according to sex
| Men | Women | P-value | |
|---|---|---|---|
| n | 53 | 59 | |
| Age | 41 ± 12 | 43 ± 12 | 0.89 |
| BMI (kg/m2) | 39 ± 5.5 | 40 ± 5.5 | 0.24 |
| Fasting plasma glucose (mg/dL) | 87 ± 9 | 86 ± 10 | 0.29 |
| HbA1c (%) | 5.5 ± 0.4 | 5.5 ± 0.5 | 0.58 |
| HOMA-IR | 4.2 ± 3.5 | 4.0 ± 2.1 | 0.77 |
| HOMA2-B (%) | 181 ± 65 | 181 ± 73 | 0.87 |
| HOMA2-S (%) | 54 ± 26 | 60 ± 44 | 0.93 |
| HOMA2-IR | 2.2 ± 1.2 | 2.3 ± 1.5 | 0.93 |
| Steatosis grade (0,1,2,3) | 8/19/13/13 | 15/20/12/12 | 0.58 |
| Ballooning (0,1,2) | 15/27/11 | 28/19/12 | 0.08 |
| Lobular inflammation (0,1,2,3) | 19/21/10/3 | 22/23/11/3 | 0.99 |
| Fibrosis stage (0,1,2,3,4) | 30/6/13/4/0 | 39/6/10/4/0 | 0.74 |
Data are expressed as mean ± standard deviation. P-values are obtained using the Chi-square test for qualitative data and the Mann–Whitney test for quantitative data. P-values < 0.05 are considered statistically significant.
Interestingly, plasma BCAA showed an inverse relation to NAFLD depending on patient sex. In men, plasma leucine and valine negatively correlated with increasing NAFLD stage (Fig. 4A and B), whereas plasma isoleucine did not correlate with NAFLD stage (Fig. 4C). Conversely, in women, plasma leucine, valine, and isoleucine concentrations all positively correlated with NAFLD severity (plasma leucine: Spearman rho = 0.43, P < 0.01; plasma valine: Spearman rho = 0.39, P < 0.01; plasma isoleucine: Spearman rho = 0.43, P < 0.01; Fig. 4D-F). These results indicate a sex-specific signature of plasma BCAA in NAFLD.
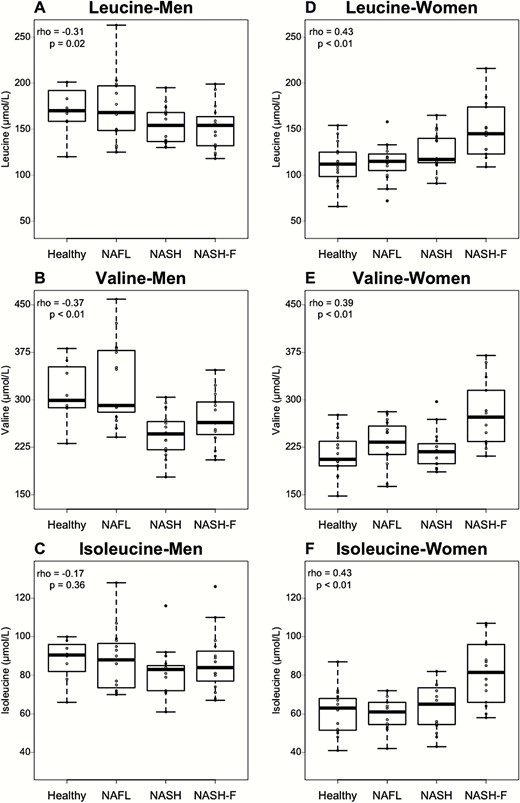
Plasma BCAA variations related to NAFLD stage are sex dependent. (A-C) BCAA concentrations according to NAFLD stage for men in Healthy (n = 8), NAFL (n = 15), NASH (n = 15), and NASH-F (n = 15) patients. (D-F) BCAA concentrations according to NAFLD stage for women in healthy (n = 15), NAFL (n = 15), NASH (n = 15), and NASH-F (n = 14) patients. Data are expressed as median ± IQR. Rho coefficients and P-values are obtained using the Spearman rank test.
Sex-dependent association of plasma BCAA with NAFLD features
To better understand the specific disease features associated with plasma BCAA changes, plasma BCAA concentrations were correlated with each NAFLD histological characteristic separately in men and women. In men (n = 53), with the exception of a modest inverse correlation of plasma valine with lobular inflammation (rho = -0.33, P = 0.02), plasma BCAA concentrations did not significantly associate with any of the parameters tested (Fig. 5). Conversely, in women, the 3 plasma BCAA correlated positively with steatosis and fibrosis. Additionally, plasma leucine and isoleucine concentrations significantly correlated with the histological ballooning score (leucine: rho = 0.36, P = 0.004; isoleucine: rho = 0.33, P = 0.009) (Fig. 5).
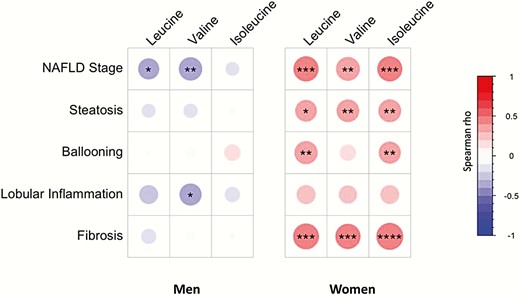
Association between plasma BCAA concentrations and liver histological characteristics are sex dependent. Spearman correlations between plasma BCAA concentrations and liver histological characteristics in the men (n = 53) and the women (n = 59) patients. Colors and area of circles reflect the Spearman rho values (red for positive, blue for inverse correlations). P-values are obtained by Spearman rank test, *P-value < 0.05, **P-value < 0.01, ***P < 0.001, and ****<P-value < 0.0001.
Interestingly, all 3 plasma BCAA most strongly correlated with fibrosis in women only (Fig. 5). To investigate whether BCAA could discriminate early from more advanced stages of fibrosis in patients with NASH, women and men were subgrouped in 2 fibrosis stages: no or low fibrosis (F0-F1) and significant fibrosis (F ≥ 2). In men, no significant association was found between plasma BCAA and fibrosis group (Fig. 6A-C). Conversely, women displayed a significant increase of all 3 plasma BCAAs with the presence of significant fibrosis (F0-F1 vs F ≥ 2: leucine: 117 ± 21 µmol/L vs 147 ± 31 µmol/L; valine: 221 ± 34 µmol/L vs 278 ± 50 µmol/L; isoleucine: 61 ± 10 µmol/L vs 81 ± 16 µmol/L (Fig. 6D-F). Moreover, as expected from the initial matching strategy, HOMA-IR, BMI, age, and glucose homeostasis parameters were not significantly different between the fibrosis subgroups.
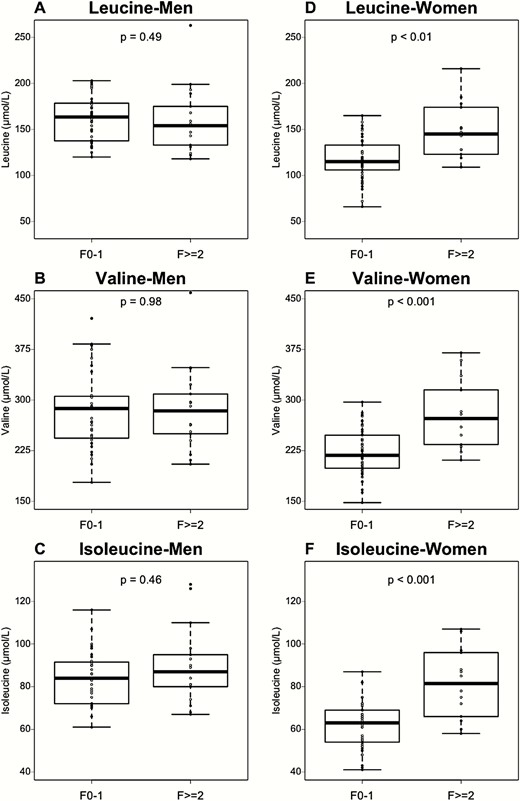
The association of plasma BCAA concentrations with fibrosis is sex dependent. (A-C) BCAA concentrations according to fibrosis stage (low fibrosis, F0-F1, n = 36; high fibrosis F ≥ 2, n = 17) in men group. (D-F) BCAA concentrations according to fibrosis stage (low fibrosis, F0-F1, n = 36; high fibrosis F ≥ 2, n = 17) in women group. Data are expressed as median ± IQR. P-values are obtained using the Mann–Whitney test.
Discussion
Here, we investigated the correlation of plasma BCAA levels with NAFLD severity and fibrosis in patient groups from a cross-sectional NAFLD cohort. To account for their potential confounding effects, groups were matched for age, BMI, glucose metabolism parameters, and sex. Our results indicate that plasma BCAA correlate with severity of NAFLD independently of known confounders, but in a sex-dependent manner, increasing from NAFL to fibrotic NASH in women, while decreasing in NASH in men.
Our results extend recent findings from Gaggini et al (14), who found a positive association of plasma BCAA with increasing NAFLD severity and fibrosis in a cohort of both obese and nonobese NAFLD patients. However, in this study, sex ratio imbalances were present between the disease groups (14). Indeed, there was a higher proportion of men in the obese NAFLD group, whereas in the control group, there was a higher proportion of women. Our results suggest this may have exaggerated the association of elevated BCAA with NAFLD. Lake et al also found a positive association between plasma BCAA and NAFLD stages with limited numbers of patients (12). However, nonstandard NAFLD classification criteria were used, and no data on sex distribution nor insulin-resistance were provided. Finally, our findings in women are in agreement with a third study reporting a positive association of plasma BCAA with increasing NAFLD severity in a cohort of obese, nondiabetic women (13).
There are numerous sources of seeming discordance in the literature among cohort studies of metabolite changes in NAFLD. These can arise from the definition of experimental groups (ie, NAFLD vs healthy, NASH vs NAFL, etc.) or differences in confounding parameters between experimental and control groups. For example, we found that alterations in circulating bile acids, previously reported to be elevated in NAFLD (27,28), may be due to differences in IR rather than NASH per se in a cohort of nondiabetic NASH patients (29). The present study, with clearly distinct groups based on their liver phenotype but matched for several potential confounders, allowed specific assessment of the association of histological liver alterations with plasma metabolites (ie, BCAA). Therefore, studies designed to identify specific associations with NAFLD presence and severity should, in our opinion, always be controlled for known confounding factors, especially sex, as shown in the present study.
The effect of sex in cohort studies of NAFLD has recently been highlighted, as prevalence and severity of NAFLD is higher in men than in premenopausal women (3,30,31). Hence, a specific metabolic signature dependent on patient sex may be expected in NAFLD. To our knowledge, the present study is the first to reveal sex-dependent associations of plasma metabolites with NAFLD severity. Indeed, plasma BCAA concentrations increased with NAFLD severity in women whereas they decreased in men, independent of glucose metabolism parameters. With respect to other clinical variables, we observed no significant differences between men and women for plasma triglycerides, plasma total cholesterol, aspartate amino transferase, or alanine amino transferase (data not shown). As expected, plasma high-density lipoprotein cholesterol was lower in men than in women and tended to decrease in both sexes with increasing NAFLD severity (data not shown). Based on the strong influence of patient sex in the determination of plasma metabolite composition (15), we believe that untargeted metabolomic studies may reveal further examples of such metabolic changes that may be key to explanations of divergent disease phenotypes between men and women. The fact that NAFLD is associated with changes in sex hormone concentrations such as sex hormone–binding globulin or testosterone may provide a potential explanation for sex susceptibility differences in NAFLD (32,33). Our data suggest that BCAA measurement could be useful to evaluate disease progression in women and thus be integrated in future noninvasive scores for NAFLD screening. However, large-scale prospective studies with paired biopsies, such as currently ongoing clinical trials, will be necessary to fully test the applicability of such a strategy.
Whether BCAA are markers or actors in NAFLD progression remains unclear. BCAA metabolism plays an important role in many cellular functions and signaling (34). Plasma BCAA levels reflect net differences in BCAA intake from the diet and their catabolism. The first 2 steps of BCAA catabolism, catalyzed by branched-chain amino acid transaminase in peripheral tissues and branched-chain α-ketoacid dehydrogenase mainly in liver, respectively, are reduced in IR and obesity (35). The reductions in these enzymatic activities limit the availability of BCAA-derived succinyl-coenzyme A and acetyl-coenzyme A, which would otherwise feed the tricarboxylic acid cycle. The combination of these changes could lead to lower hepatic mitochondrial activity. Interestingly, BCAA (especially leucine) are well-known activators of the mammalian target of rapamycin pathway (36-38), whose activation may further drive insulin resistance and abnormal lipid accumulation. In line, feeding obese mice with BCAA was associated with chronic phosphorylation of mammalian target of rapamycin and enhanced liver injury in this model (39). However, the involvement of BCAA in liver injury in humans appears to be inconsistent with these preclinical models. For example, in patients with cirrhosis, long-term oral BCAA supplementation reduced liver injury and related complications (40-42). Consequently, elevated plasma BCAA in humans may be a protective mechanism to reduce further hepatic injury in a chronic setting.
Although our findings do not prove causality of the observed association, they highlight that patient sex must be considered when developing metabolite-based diagnostic/evaluation scores for NAFLD.
Acknowledgments
We thank Magali Defevre, Laurence George and Alain Kerckhove (Centre de Biologie et Pathologie Génétique, CHU Lille, France) for help with plasma amino acid measurements.
Financial support: This work was supported by the French Agence Nationale pour la Recherche (ANR-10-LABX-0046 and ANR-16-RHUS-0006) and grants from the European Commission: HEPADIP (Contract LSHM-CT-2005–018734) and RESOLVE (Contract FP7-305707) projects. BS is a recipient of an ERC Advanced Grant (694717). SF has a senior clinical research mandate from the Fund for Scientific Research (FWO) Flanders (1802154N).
Additional Information
Disclosure Summary: BS and SF are consultants for Genfit S.A. SF and LV are consultants for Inventiva. All other authors have nothing to declare.
Data Availability: The datasets generated during and/or analyzed during the current study are not publicly available but are available from the corresponding author on reasonable request.
References
Author notes
These authors co-supervised the study.
