


Abstract
To characterize the relationship between hemoglobin A1c (HbA1c) levels and glucose tolerance across pregnancy and postpartum.
In a longitudinal study of pregnant women with gestational diabetes risk factors (N = 102), we performed oral glucose tolerance testing (OGTT) and HbA1c measurements at 10–15 weeks of gestation, 24–30 weeks of gestation (N = 73), and 6–24 weeks postpartum (N = 42). Complete blood counts were obtained from clinical records. We calculated HbA1c-estimated average glucose levels and compared them with mean OGTT glucose levels (average of fasting, 1- and 2-hour glucose levels). Linear mixed effects models were used to test for longitudinal changes in measurements.
Mean OGTT glucose increased between 10–15 and 24–30 weeks of gestation (β = 8.1 mg/dL, P = .001), while HbA1c decreased during the same time period (β = –0.13%, P < .001). At 10–15 weeks of gestation and postpartum the discrepancy between mean OGTT glucose and HbA1c-estimated average glucose was minimal (mean [standard deviation]: 1.2 [20.5] mg/dL and 0.16 [18.1] mg/dL). At 24–30 weeks of gestation, the discrepancy widened (13.2 [17.9] mg/dL, β = 12.7 mg/dL, P < .001, compared to 10–15 weeks of gestation, with mean OGTT glucose being higher than HbA1c-estimated average glucose). Lower hemoglobin at 24–30 weeks of gestation was associated with a greater discrepancy (β = 6.4 mg/dL per 1 g/dL lower hemoglobin, P = .03 in an age- and gestational age-adjusted linear regression model).
HbA1c accurately reflects glycemia in the 1st trimester, but underestimates glucose intolerance in the late 2nd trimester. Lower hemoglobin level is associated with greater underestimation. Accounting for gestational age and maternal hemoglobin may improve the clinical interpretation of HbA1c levels during pregnancy.
Hemoglobin A1c (HbA1c) is widely used to diagnose and manage diabetes outside of pregnancy based on its strong association with glycemia and diabetes complications (1–3). Its current widespread use is due, in part, to the burden associated with other assessments of glycemia, including oral glucose tolerance testing (OGTT, which requires fasting and repeated laboratory blood draws) and self-monitoring of blood glucose (SMBG, which requires frequent finger pricks). Although all three of these glycemic measurements are associated with diabetes complications, they measure distinct aspects of glycemic physiology and are not perfectly correlated (2,4–6).
In pregnancy, OGTT and SMBG remain the primary tools used to diagnose and monitor hyperglycemia; HbA1c is considered a less reliable marker of glycemia during gestation and often remains within the normal range in women with gestational diabetes (GDM) (7–9). While HbA1c is not recommended as a tool for diagnosis of GDM, HbA1c is used by obstetric providers to screen for pre-existing diabetes in early pregnancy, confirm glycemic control in women performing SMBG, and assess glycemic control when SMBG is inadequate (10, 11).
Despite the demonstrated clinical utility of HbA1c level as a marker of glycemia, it is known to be affected by conditions that alter red blood cell (RBC) lifespan, including iron deficiency anemia, hemolytic anemia, and erythropoietin treatment (12–15). Pregnancy is a state of altered RBC kinetics, increased erythropoiesis, and hemodilution (16–19). Yet, studies examining the effects of pregnancy on HbA1c have had inconsistent results. Most studies suggest that HbA1c underestimates glycemia in pregnant women (20–23). A recent study, in contrast, suggested that the HbA1c overestimates glycemia in pregnant women with diabetes (24). Limited information on longitudinal changes in the relationship between HbA1c and glycemia across gestation hinders the ability to interpret HbA1c results accurately in pregnant women (25–27). Clarifying the relationship between HbA1c and OGTT-based measures of glycemia across gestation could improve the clinical utility of HbA1c as a glycemic measure in pregnancy.
To assess the relationship between HbA1c and maternal glycemia across pregnancy and the postpartum period in women without pre-existing diabetes, we compared HbA1c measures to concurrent measures of glycemia by OGTT. We hypothesized that hemoglobin levels would be associated with the discrepancy between glycemia estimated by HbA1c and observed during an OGTT in pregnant women. We explored other RBC measurements from complete blood counts (CBCs) for potential associations with the discrepancy between HbA1c levels and OGTT glycemia during pregnancy.
Materials and Methods
The Study of Pregnancy Regulation of INsulin and Glucose (SPRING, NCT02763267) is a prospective cohort study of pregnant women with risk factors for gestational diabetes designed to examine longitudinal change in insulin physiology across pregnancy and postpartum. In this interim analysis for a secondary purpose, we analyzed data available as of August 2019. Participants were recruited from the obstetric practice at Massachusetts General Hospital (MGH, Boston, MA) and through paper and electronic advertisements to women in the Boston area between 2016 and 2019. To be included, women had to have either (1) body mass index (BMI) ≥ 25 kg/m2 (≥23 kg/m2 in women with self-reported Asian race) plus 1 additional risk factor as defined by American Diabetes Association guidelines, (2) abnormal glucose testing during a prior pregnancy, or (3) history of diabetes (including GDM) in a 1st degree family member (1). We excluded women with known pre-existing diabetes, HbA1c ≥ 6.5% at the 1st trimester study visit, or who were on medications that affect glucose tolerance (eg, metformin, systemic corticosteroids). For the current analyses we also excluded women with microcytosis in the 1st trimester (mean corpuscular volume, MCV < 80 fL, N = 2), suggesting possible chronic iron deficiency, or abnormal hemoglobin electrophoresis (available in 57 women, 1 with sickle cell trait). None of the participants had known chronic kidney disease and none is known to have developed clinically significant acute kidney injury during the study.
Participants had a standardized 2-hour 75-g OGTT and HbA1c assay performed on the same day in the 1st trimester (10–15 weeks of gestation), late 2nd trimester (24–30 weeks of gestation), and postpartum (6–24 weeks after delivery). Some subjects with abnormal glucose tolerance in the 1st trimester (fasting glucose ≥ 92 mg/dL, 1-hour glucose ≥ 180 mg/dL, 2-hour glucose ≥ 153 mg/dL) did not undergo OGTT later in pregnancy and were instead referred to their obstetric provider for potential treatment, as per the study protocol (Fig. 1) (28). The fasting level for referral for treatment in the 1st trimester pregnancy changed during the course of the study from 92 mg/dL to 100 mg/dL based on accumulating evidence that fasting glucose thresholds for GDM diagnosis at 24–28 weeks should not be applied to early pregnancy (29–31).
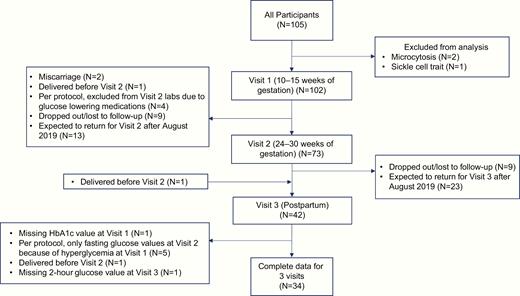
Inclusion and follow-up of study participants. A flow chart describing the inclusion and follow-up of participants study of pregnancy regulation of insulin and glucose for the present analysis.
Glucose was measured using the hexokinase method in the MGH core clinical laboratory using the Cobas 8000 modular analyzer (Roche Diagnostics). We used the International Association of the Diabetes in Pregnancy Study Groups’ (IADPSG) 2010 criteria to define GDM (fasting glucose ≥ 92 mg/dL, 1-hour glucose ≥180 mg/dL, 2-hour glucose ≥153 mg/dL) (28). Both women with and without GDM were included in our analyses. We calculated mean glucose levels during OGTT (mean OGTT glucose) by averaging the fasting, 1-hour, and 2-hour values.
We measured HbA1c in two National Glycohemoglobin Standardization Program certified laboratories using the Tina Quant (Roche Diagnostics), which is an immunoturbidometric assay (Assay 1), or the Premier Hb9210 Analyzer (Trinity Biotech), which is a boron hydride-based affinity assay (Assay 2). Measurements from the 2 methods on duplicate samples from non-pregnant research subjects were highly correlated (r2 > 0.99, data not shown). HbA1c-estimated average glucose levels were calculated using the HbA1c-derived average glucose formula, which has been validated outside of pregnancy: average glucose (mg/dL) = 28.7 × HbA1c – 46.7 (2). HbA1c-estimated average glucose was compared with mean OGTT glucose, chosen a priori as the primary glycemia measure. The discrepancy between HbA1c-estimated glucose and mean OGTT glucose was calculated by subtracting HbA1c-estimated average glucose from the mean OGTT glucose. In a secondary analysis we also expressed the discrepancy as a percentage of the mean OGTT glucose ([mean OGTT glucose minus HbA1c-estimated average glucose]/mean OGTT glucose).
CBC, including hemoglobin, MCV, and red cell distribution width (RDW), was measured in the 1st trimester and around 28 weeks of gestation in clinical laboratories at the sites where participants received prenatal care. We abstracted CBC values from the clinical records as available.
Values are given as mean (standard deviation) unless otherwise noted. Linear mixed effect models, accounting for repeated measures and within-individual correlation, were used to assess longitudinal changes in glycemic and hematologic measurements. We repeated the longitudinal analyses in women who had complete data on HbA1c and mean OGTT glucose at all 3 study timepoints. Unless otherwise noted, β values with 95% confidence intervals describe differences across time points from these linear mixed models, with 1st trimester as the reference. Pearson’s correlation was used to assess associations between variables of interest at each time point. Age- and gestational age-adjusted multivariable linear regression models were used to investigate the relationship between the hematologic variables (hemoglobin, MCV, RDW) and the discrepancy between mean OGTT glucose and HbA1c-estimated average glucose. We also conducted stratified analyses by the laboratory in which HbA1c was measured to determine if the relationships that we observed were consistent across the 2 HbA1c assays. Statistical analyses were conducted in STATA/IC version 14 (College Station, TX). The Partners Committee on Human Research (Institutional Review Board) approved the study and participants gave written informed consent.
Results
Participant characteristics
Participant characteristics of the full cohort (N = 102) are described in Table 1. Forty-nine participants (48.0%) were from racial/ethnic minority groups. Women were studied at a mean (standard deviation) gestational age of 12.6 (1.6) weeks (1st trimester), 26.6 (1.9) weeks in (late 2nd trimester, N = 73), and 10.2 (4.5) weeks postpartum (N = 42). Fig. 1 describes the availability of data from participants at each time point at the time of analysis. Fifteen subjects met criteria for GDM in the 1st trimester (14.7%), and an additional 11 subjects with normal OGTT in the 1st trimester met the criteria for GDM in the late 2nd trimester (18.3% of those with normal 1st trimester OGTT). The average HbA1c in the 1st trimester was 5.3 [0.3] % and ranged from 4.7% to 6.1%.
Characteristics of study participants
| Mean (SD) or N (%) | |
|---|---|
| 10–15 weeks of gestation | |
| N | 102 |
| Age (years) | 32.0 (4.9) |
| Gestational age (weeks) | 12.6 (1.6) |
| Race-Ethnicity | |
| Hispanic/Latina | 24 (23.5%) |
| Non-Hispanic/Latina | |
| White | 53 (52.0%) |
| Black/African-American | 13 (12.8%) |
| Asian | 9 (8.8%) |
| Other/Multiple | 3 (2.9%) |
| College graduate | 84 (82%) |
| Nulliparous | 48 (47.1%) |
| Body mass indexa, (kg/m2) | 29.9 (6.7) |
| Hemoglobin (g/dL) (n = 91) | 12.8 (0.7) |
| Mean corpuscular volume (fL) (n = 91) | 89.2 (4.0) |
| Red cell distribution width (%) (n = 89) | 13.0 (0.9) |
| Mean OGTT glucose (mg/dL) | 104.9 (22.2) |
| Hemoglobin A1C (%) | 5.25 (0.3) |
| Hemoglobin A1C-estimated average glucose (mg/dL) | 104.0 (8.2) |
| 24–30 weeks of gestation | |
| N | 73 |
| Gestational age (weeks) | 26.6 (1.9) |
| Body mass indexa, (kg/m2) | 31.8 (5.9) |
| Hemoglobin (g/dL) (n = 69) | 11.8 (0.8) |
| Mean corpuscular volume (fL) (n = 69) | 91.2 (4.6) |
| Red cell distribution width (%) (n = 69) | 13.3 (0.7) |
| Mean OGTT glucose (mg/dL) | 111.2 (19.0) |
| Hemoglobin A1C (%) | 5.10 (0.3) |
| Hemoglobin A1C-estimated average glucose (mg/dL) | 99.6 (8.5) |
| Postpartum | |
| N | 42 |
| Time postpartum (weeks) | 10.2 (4.5) |
| Breastfeeding status | |
| Exclusively breastfeeding | 19 (47.5%) |
| Breastfeeding and formula feeding | 14 (35.0%) |
| Formula feeding only | 7 (17.5%) |
| Body Mass Indexa, (kg/m2) | 30.0 (6.1) |
| Mean OGTT glucose (mg/dL) | 105.1 (19.0) |
| Hemoglobin A1C (%) | 5.28 (0.2) |
| Hemoglobin A1C-estimated average glucose (mg/dL) | 104.9 (6.9) |
aBody mass index was calculated from height measured at the 1st visit, and weight measured at each visit.
Longitudinal changes in glycemia and HbA1c
Average glycemic and HbA1c measurements available at each time point are given in Table 1. Mean glucose during the OGTT (Fig. 2A) increased between the 1st trimester and late 2nd trimester (β = 8.1 mg/dL, 95% CI 3.2, 13.0, P = .001). The increase in mean glucose was due to an increase in post-load glucose rather than fasting glucose (data not shown). Mean glucose during the OGTT was not significantly different postpartum compared to 1st trimester (β = 0.79 mg/dL, 95% CI –5.0, 6.6, P = .79).
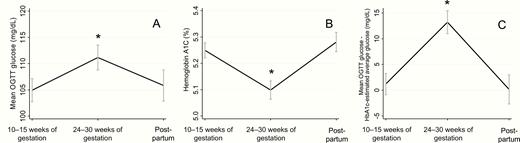
Longitudinal changes in OGTT-assessed glycemia and HbA1c across pregnancy and postpartum. Mean OGTT glucose (A), hemoglobin A1c (B), and the discrepancy between mean OGTT glucose and HbA1c-estimated average glucose (C) were measured at 10–15 weeks of gestation (N = 102), 24–30 weeks of gestation (N = 73), and postpartum (N = 42, 6–24 weeks after delivery. Error bars depict the standard error of the mean. *Denotes values significantly different from first trimester.
In contrast to mean glucose during the OGTT, HbA1c (Fig. 2B) decreased between the 1st trimester and late 2nd trimester (β = –0.13%, 95% CI –0.19, –0.07, P < .001). HbA1c was not significantly different postpartum from the 1st trimester (β = 0.06%, 95% CI –0.02, 0.14, P = .13). HbA1c-estimated average glucose was lower in the late 2nd trimester than in the 1st trimester (β = –3.7 mg/dL, 95% CI –5.6, –1.9), P < .001) and was not significantly different postpartum compared with the 1st trimester (β = 1.7, 95% CI –0.52, 4.0, P = .13).
When we limited our analysis to participants with complete glucose and HbA1c data at all study time points (N = 34), longitudinal results were largely consistent with those described above (Fig. 3A and 3B). Specifically, there was an increase in mean OGTT glucose from the 1st trimester to the late 2nd trimester (β = 9.5 mg/dL, 95% CI 2.7, 16.4, P = .007) and no significant difference in the mean OGTT glucose postpartum compared to the 1st trimester (β = 4.4 mg/dL, 95% CI –2.4, 11.3, P = .21). HbA1c was lower in the late 2nd trimester than in the 1st trimester (β = –0.12 %, 95% CI –0.21, –0.03, P = .008). HbA1c was higher postpartum than in the 1st trimester (β = 0.15%, 95% CI 0.06, 0.24, P = .001); this was not seen in analysis that included participants who had missing data.
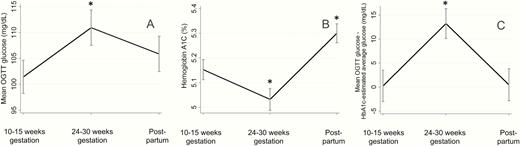
Longitudinal changes in OGTT-assessed glycemia and HbA1c across pregnancy and postpartum in participants with complete data. Mean OGTT glucose (A), hemoglobin A1c (B), and the discrepancy between mean OGTT glucose and HbA1c-estimated average glucose (C) were measured at 10–15 weeks of gestation, 24–30 of weeks gestation, and postpartum (6–24 weeks after delivery) in 34 participants. Error bars depict the standard error of the mean. *Denotes values significantly different from 1st trimester.
Relationship between mean OGTT glucose and HbA1c
HbA1c and mean OGTT glucose were significantly correlated at all study time points (1st trimester: r = 0.38, P < .001; late 2nd trimester: r = 0.34, P = .01; postpartum: r = 0.32, P = .04). In the 1st trimester, HbA1c was also correlated with fasting glucose (r = 0.43, P < .001), 1-hour glucose (r = 0.36, P < .001), and 2-hour glucose (r = 0.28, P = .004). Correlations between HbA1c and timed OGTT glucose levels were similar in the late 2nd trimester (fasting glucose: r = 0.45, P < .001; 1-hour glucose: r = 0.30, P = .01; 2-hour glucose r = 0.28, P = .03), but were weaker or non-significant postpartum (fasting glucose: r = 0.12, P = .45; 1-hour glucose: r = 0.21, P = .19; 2-hour glucose: r = 0.33, P = .03).
Although there were no substantial differences in the strength of the correlation between mean OGTT glucose and HbA1c across gestation, the quantitative relationship between mean OGTT glucose and HbA1c-estimated average glucose changed. The mean OGTT glucose was higher than the HbA1c-estimated average glucose at all timepoints. In the 1st trimester and postpartum, the discrepancy between mean OGTT glucose and HbA1c-estimated glucose was minimal (1.2 [20.5] mg/dL in the 1st trimester, 0.16 [18.1] mg/dL postpartum), while in the late 2nd trimester, the discrepancy between mean OGTT glucose and HbA1c-estimated average glucose increased (13.2 [17.9]; β = 12.7 mg/dL, 95% CI 7.8, 17.5, P < .001 versus 1st trimester, Fig. 2C). There was no statistically significant difference in the discrepancy between mean OGTT glucose and HbA1c-estimated average glucose postpartum compared with the 1st trimester (β = –1.8, 95% CI –7.5, 4.0, P = .55). These findings were similar among the 34 participants with complete measurements at all 3 study timepoints (difference in discrepancy between 1st trimester and late 2nd trimester: β = 13.0 mg/dL, 95% CI 5.7, 20.3, P = .001; difference in discrepancy between postpartum and 1st trimester: β = 0.22 mg/dL, 95% CI –7.1, 7.6, P = .95, (Fig. 3C). Adjustment for white and non-Hispanic race ethnicity had no effect on the longitudinal changes in the discrepancy and the longitudinal changes in discrepancy were similar across race ethnicity groups.
Longitudinal changes in hematologic measurements and relationships between hematologic and glycemic measurements
CBCs were available in 91 participants in the 1st trimester and 69 participants in the late 2nd trimester (Table 1). Hemoglobin decreased between the 1st trimester and late 2nd trimester (β = –1.0 g/dL, 95% CI –1.2, –0.82, P < .001), while MCV and RDW increased (MCV: β = 1.8 fL, 95% CI 1.1, 2.4, P < .001; RDW: β = 0.32 %, 95% CI 0.13, 0.51, P = .001).
Correlations between glycemic and hematologic variables in the 1st trimester and late 2nd trimester are presented in Table 2. In the 1st trimester, HbA1c was inversely associated with MCV, positively associated with RDW, and not associated with hemoglobin. In the 1st trimester, mean OGTT glucose was positively associated with hemoglobin and not associated with RDW. There was a trend toward inverse association between 1st trimester mean OGTT glucose and MCV. In the late 2nd trimester, HbA1c was inversely associated with MCV, but not associated with hemoglobin or RDW. There was a trend toward negative association between late 2nd trimester mean OGTT and hemoglobin, but no association between late 2nd trimester mean OGTT glucose and MCV or RDW.
Correlations between hematologic and glycemic measures in pregnancy
| HbA1c | Mean OGTT glucose | |||
|---|---|---|---|---|
| R | P | R | P | |
| 10–15 weeks of gestation | ||||
| Hemoglobin | –0.05 | 0.65 | 0.22 | 0.04 |
| MCV | –0.27 | 0.01 | –0.20 | 0.06 |
| RDW | 0.24 | 0.02 | –0.05 | 0.66 |
| 24–30 weeks of gestation | ||||
| Hemoglobin | –0.15 | 0.26 | –0.24 | 0.09 |
| MCV | –0.27 | 0.04 | –0.15 | 0.31 |
| RDW | 0.13 | 0.34 | 0.02 | 0.87 |
Bold values are statistically significant.
Relationships between hematologic measurements and mean OGTT glucose-HbA1c discrepancy in the late 2nd trimester
In an age- and gestational age-adjusted linear regression model, lower late 2nd trimester hemoglobin was associated with greater discrepancy between mean OGTT glucose and HbA1c-estimated average glucose (β = 6.4 mg/dL greater discrepancy per 1 g/dL lower hemoglobin, 95% CI 0.62–12.2, P = .03, Fig. 4). This association was not affected by adjustment for body mass index (β = 6.7 mg/dL, P = .03) and remained significant when the measure of discrepancy between mean OGTT and HbA1c-estimated average glucose was expressed as a percent of the mean OGTT glucose (β = 6.3%, P = .02). There was no association between MCV (P = .21) or RDW (P = .69) and the discrepancy between mean OGTT glucose and HbA1c-estimated average glucose in the late 2nd trimester.
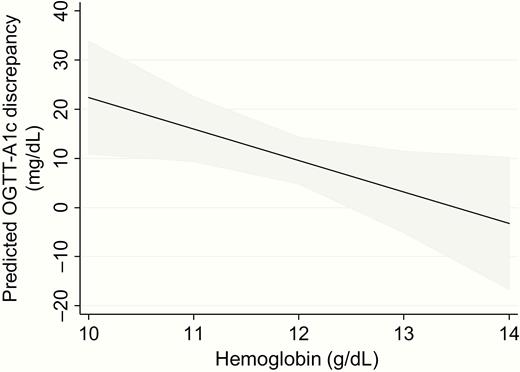
Association of hemoglobin level with discrepancy between mean OGTT glucose and HbA1c-estimated average glucose in the late 2nd trimester. In an age- and gestational age-adjusted linear regression model, late 2nd trimester hemoglobin level was inversely associated with the discrepancy between mean OGTT glucose and HbA1c-estimated average glucose. Here the predicted discrepancy from this linear regression model is plotted for hemoglobin levels between 10 and 14 g/dL. The grey shaded region depicts the 95% confidence interval for the prediction.
Analyses stratified by HbA1c assay
In the 1st trimester, N = 51 samples were measured with the immunoturbidometric assay (Assay 1), and N = 50 were measured with the boron-hydride affinity assay (Assay 2). In the late 2nd trimester, N = 36 samples were measured with Assay 1, and N = 37 were measured with Assay 2. Postpartum, N = 22 samples were measured with Assay 1 and N = 20 samples were measured with Assay 2. In the stratified analysis, we observed changes in HbA1c across gestation and postpartum that were consistent with those in our primary analyses. However, the association between late 2nd trimester hemoglobin and the discrepancy between mean OGTT glucose and HbA1c-estimated average glucose was only present when HbA1c was measured using Assay 1 (Assay 1: N = 27, β = –9.8, 95% CI –17.5, –2.0, P = .02; Assay 2: N = 23, β = –0.87, 95%CI –12.0, 10.3, P = .87).
Discussion
In this longitudinal study of women with risk factors for GDM, we found that HbA1c provides an accurate estimate of mean glycemia in the 1st trimester but underestimates the degree of glucose intolerance in the late 2nd trimester. These findings were robust across 2 different standardized HbA1c assays, each with different measurement principles. We also found that lower hemoglobin levels in the late 2nd trimester, at the time of usual GDM screening, are associated with greater HbA1c underestimation of glucose intolerance. Of note, the correlations between HbA1c and mean OGTT glucose within each gestational period were of similar strength, despite the changes in the relationship between these two measurements across pregnancy and postpartum. This implies that adjusting HbA1c levels for gestational age and/or hemoglobin may improve the accuracy of estimation of glycemia in pregnancy.
To the extent that the mean OGTT glucose is indicative of average glycemia, our data suggest that the pregnancy-associated reduction in HbA1c cannot be attributed to concurrent changes in glycemia. Indeed, HbA1c levels failed to reflect the progressive glucose intolerance that develops in mid to late gestation (27, 32, 33). There is likely a lag between the development of glucose intolerance and reflection in the HbA1c, thus we cannot entirely rule out that uncaptured lower average glycemia occurring between our 1st and 2nd trimester study time points contributed to the reduced HbA1c that we observed in the late 2nd trimester. Still, our data highlight the limitations preventing widespread clinical use of HbA1c for diagnosis and monitoring of hyperglycemia in pregnant women.
To our knowledge, no other study in pregnant women has examined longitudinal changes in the relationship between OGTT glycemia and HbA1c measured using modern standardized HbA1c assays (34). Previous cross-sectional studies have compared HbA1c values in pregnant and nonpregnant women without diabetes, though glycemia was often not measured (20, 35–37). A longitudinal study conducted serial HbA1c measurements using older unstandardized assays in 21 women without diabetes during pregnancy and found that HbA1c declines between the 1st trimester and 24 weeks of gestation, then subsequently increases toward term (25). However, due to the timing of the measurements in relation to glucose tolerance testing, it was unclear whether the changes in HbA1c were independent of changes in glycemia. Another study in over 300 women without pre-existing diabetes, also using older unstandardized HbA1c assays, suggested that glycemia nadirs at 20 weeks of gestation, while the HbA1c nadirs at 24 weeks of gestation; the investigators concluded that the decline in HbA1c at 20 weeks is the result of glycemic changes earlier in gestation (26). Yet, the changes observed in glycemia in that study were not consistent with those seen in other longitudinal pregnancy studies, perhaps due to the suboptimal means of assessing glycemia using a non-fasting glucose load test. The present study provides new clinically relevant information on the longitudinal relationships between glycemia and HbA1c, measured using modern standardized assays, in pregnant women without pre-existing diabetes.
A few studies have examined the relationship between glycemia and HbA1c in pregnant women with diabetes that preceded pregnancy. Herranz et al. compared HbA1c levels to average glycemia measured by SMBG 4 or 5 times daily in women with type 1 diabetes, and found that HbA1c underestimates average glycemia in pregnancy, consistent with our findings (22). More recently, Law et al. analyzed the relationship between HbA1c and glycemia in 117 women with diabetes using continuous glucose monitoring (CGM) applied intermittently at 4 to 6 time points across pregnancy (24). In contrast to the aforementioned studies and our own, this study found that traditional estimations of average glucose based on HbA1c overestimate glycemia in pregnant women with diabetes. Overall, HbA1c was a poor predictor of glycemia, capturing just 21% of the variation in average glucose measured by CGM. Of note, when HbA1c was below 6%, there appeared to be an underestimation of glycemia, consistent with observations in our study.
Previous studies of hematologic changes across gestation have shown that hemoglobin levels decline as the result of an increase in plasma volume, despite an increase in total hemoglobin mass (16–18). Most studies also show that MCV and RDW increase; we observed hematologic changes consistent with these prior findings (38–41). Some prior studies suggested that average RBC age decreases as pregnancy progresses (19, 39, 42–44). However, these studies relied on cellular density as a marker of RBC age; the relationship between RBC age and density has subsequently been shown to be unreliable for this purpose (45). A reduction in average RBC age during pregnancy may explain the relative underestimation of glycemia by HbA1c that we observed in the late 2nd trimester, but given the flaws in the methods used to assess RBC lifespan in previous pregnancy studies, this has not been definitively established.
The fact that the inverse relationship between late 2nd trimester hemoglobin and the discrepancy between HbA1c-estimated average glucose and mean glucose during an OGTT was only observed with one of the HbA1c assays (the immunoturbidometric assay) deserves attention. Because of our limited sample size, we may have lacked power to detect a relationship between the discrepancy and hemoglobin in a subset of our participants. However, it is also possible that interference by other blood components with the immunoturbidometric assay accounts for the relationships we observed. This leads us to consider the possibility that pregnancy related factors may have effects on HbA1c measurements and that these putative effects may differ according to the type of assay used, even among standardized assays.
Strengths of our study include its longitudinal design, the analysis of concurrent HbA1c and OGTT measurements, the inclusion of women at high risk for GDM, and the modern, standardized assays used for HbA1c measurement. Most prior studies have been cross-sectional, did not include both HbA1c and OGTT measures, and/or used older unstandardized HbA1c assays. Limitations of our study include reliance on clinical CBC measurements, lack of availability of longitudinal measurements in all participants at the time of analysis, and glycemic assessments that did not include every gestational week. Of note, when we conducted an analysis among women with complete glycemic and HbA1c data across our 3 study time points, our results did not substantially change. We did not collect data on whether participants received blood transfusions, but we expect this to have been an uncommon occurrence in our study population, particularly prior to delivery in women without chronic anemia. While we saw some possible differences between the 2 HbA1c assays used, we did not have duplicate measurements in our study population comparing the assays in the same women, limiting our interpretation of the analysis stratified by HbA1c assay. Finally, the mean OGTT glucose is a proxy for average glycemia and may not represent true average glycemia, as could be assessed using continuous glucose monitoring. Mean OGTT glucose likely overestimates average glycemia because of the relatively large contribution of post-challenge glucose levels to this measure. Reassuringly, the mean OGTT glucose in our study followed a similar pattern to reported average glucose measured by continuous glucose monitoring across gestation (33).
In conclusion, we have shown that HbA1c fails to capture longitudinal changes in glucose tolerance during pregnancy; specifically, HbA1c underestimates maternal glucose intolerance in the late 2nd trimester, at the time of usual GDM screening. HbA1c could provide false reassurance to obstetric providers if it is used as a measure of glycemia in mid to late gestation. The degree to which HbA1c underestimates maternal glycemia is associated with maternal hemoglobin level, with greater underestimation of maternal glycemia in women with lower hemoglobin levels. Thus, accounting for maternal hemoglobin level and gestational age may aid in the clinical interpretation of HbA1c levels during pregnancy. Further studies evaluating HbA1c more frequently with continuous glucose monitoring are needed to characterize the relationship between HbA1c, hemoglobin, and glycemic control at various timepoints in pregnancy more precisely. Additionally, studies evaluating the effects of pregnancy on red blood cell turnover are needed to better understand the underlying influences on HbA1c’s accuracy as a glycemic marker during gestation.
Abbreviations
- BMI
body mass index
- CBC
complete blood count
- CGM
continuous glucose monitoring
- GDM
gestational diabetes
- HbA1c
hemoglobin A1c
- MCV
mean corpuscular volume
- MGH
Massachusetts General Hospital
- OGTT
oral glucose tolerance testing
- RBC
red blood cell
- RDW
red cell distribution width
- SMBG
self-monitoring of blood glucose
Acknowledgments
Portions of this study in abstract form were presented at the 66th Annual Scientific Meeting of the Society for Reproductive Investigation, March 2019 in Paris, France.
Financial Support
C.E.P. and the SPRING cohort are supported by NIH K23DK113218 and the Robert Wood Johnson Foundation’s Harold Amos Medical Faculty Development Program. J.S.T. is supported by NIH K23DK120874. M.F.H. is supported by American Diabetes Association’s Pathways Award # 1-15-ACE-26. Grant Numbers 1UL1TR001102-01 and 8 UL1 TR000170-05, Harvard Clinical and Translational Science Center, from the National Center for Advancing Translational Science provided support for data collection. The content is solely the responsibility of the authors and does not necessarily represent the official views of the National Center for Research Resources, the National Center for Advancing Translational Science or the National Institutes of Health.
Additional Information
Disclosure Summary: D.M.N. previously received research funding from Alere Inc. (now Abbott) to conduct an investigator-initiated study of a point of care HbA1c device. The device was not used in the study presented here. The other authors declare no conflicts of interest.
Data Availability: Restrictions apply to the availability of data generated or analyzed during this study to preserve participant confidentiality. The corresponding author will on request detail the restrictions and any conditions under which access to some data may be provided.
References
