


Abstract
Type 2 diabetes (T2D) is closely associated with nonalcoholic fatty liver disease (NAFLD); however, evidence regarding the link between blood glucose, especially below the threshold for T2D, and NAFLD is scarce.
The objective of this work is to examine the associations of fasting glucose, oral glucose tolerance test (OGTT) 2-hour glucose, and hemoglobin A1c (HbA1c), and changes in these measures with development and resolution of NAFLD in nondiabetic individuals.
This longitudinal cohort study comprised 4273 Chinese adults age 40 years or older and free of baseline T2D from 2010 to 2015. Blood sampling was performed during the OGTT test. NAFLD was ascertained by hepatic ultrasonography. Risk ratios (RRs) were calculated using modified Poisson regression models.
During a mean 4.4 years of follow-up, NAFLD occurred in 573 (17.9%) of the 3209 participants without baseline NAFLD and resolved in 304 (28.6%) of the 1064 participants with baseline NAFLD. OGTT 2-h glucose was positively associated with NAFLD incidence (RR per 1-SD increase: 1.16, 95% CI: 1.08-1.25), whereas fasting (RR: 0.86, 95% CI: 0.78-0.94) and 2-hour glucose (RR: 0.85, 95% CI: 0.77-0.93) were inversely associated with resolution of NAFLD. Glycemic deterioration conferred increased risk of developing NAFLD and decreased likelihood of resolution of NAFLD than maintaining normal glycemic regulation (NGR). The strongest associations were observed for individuals who developed T2D. Meanwhile, baseline or incident NAFLD significantly increased the risk of deterioration in glucose metabolism.
Increased glycemic levels within the nondiabetic range, as well as progression from NGR to T2D or prediabetes, were adversely associated with development and improvement of NAFLD.
Nonalcoholic fatty liver disease (NAFLD) encompasses a wide spectrum of liver damage from simple steatosis progressing to nonalcoholic steatohepatitis and advanced fibrosis, and has become the most common chronic liver disease worldwide (1). With rapid spikes in economic growth and lifestyle transition, the prevalence of NAFLD in China has dramatically increased from 18% to 29% over the past decade, posing a major health threat to the Chinese population (2-4). The burden of NAFLD is rising in parallel with an epidemiological surge of metabolic diseases such as obesity, dyslipidemia, and type 2 diabetes (T2D) (5). It is estimated that 85% of patients with NAFLD have at least one cardiometabolic disorder (6).
T2D and NAFLD share similar risk factors and each may serve as a strong determinant and accelerator for the other (7). Robust evidence has indicated higher risk of NAFLD in diabetic individuals (7-9). However, whether blood glucose within the nondiabetic range is associated with NAFLD risk, and whether there is a threshold effect if the association exists, are unknown. Several studies have shown that random plasma glucose and hemoglobin A1c (HbA1c) were positively associated with NAFLD among individuals without T2D (10, 11), but comprehensive data about the relationship between glycemic profile and NAFLD are limited. Additionally, substantial uncertainty remains as to the influence of glycemia on resolution of existing NAFLD. In longitudinal observational studies, NAFLD improvement has been shown to reduce the risk of T2D, whereas the development of new NAFLD could increase T2D risk (12-14). Currently, NAFLD outcomes associated with change in glucose metabolism are still a knowledge gap.
According to the latest national survey in 2013, the estimated overall prevalence of prediabetes in Chinese adults was 35.7% (15), which is supposed to subsequently translate into a greater T2D epidemic in the near future. Therefore, a better understanding of the link between altered glucose homeostasis and risk of NAFLD, especially among those with prediabetes, may have substantial public health implications for lowering NAFLD burden. In this population-based prospective study, we examined the associations of glycemic measures and change in glycemic regulation status with development and resolution of NAFLD among nondiabetic adults.
Methods
Study population
The study population consisted of registered residents from 10 communities in Jiading District, Shanghai, China, as described elsewhere (16). Briefly, during March and August 2010, a total of 10 375 local residents age 40 years or older were recruited and completed a health screening examination. All participants received a comprehensive survey comprising a standard questionnaire and relevant clinical measurements. Between August 2014 and May 2015, the enrolled participants were invited to attend a follow-up visit. In this study, we excluded those with known liver diseases including viral and autoimmune hepatitis, cirrhosis, and cancer (n = 721), excessive alcohol consumption (alcohol consumption ≥ 140 g/week in men and ≥ 70 g/week in women, n = 901), T2D (previously diagnosed or screen-detected, n = 1679), or with missing data on abdominal ultrasonography (n = 45). The remaining 7029 participants were divided into 2 groups according to the presence of ultrasound-detected fatty liver at baseline. Among them, 4273 with complete ultrasound data at follow-up were included for analysis (Fig. 1). This study was approved by the Committee on Human Research at Rui-Jin Hospital, Shanghai Jiao Tong University School of Medicine. All study participants provided written informed consent.
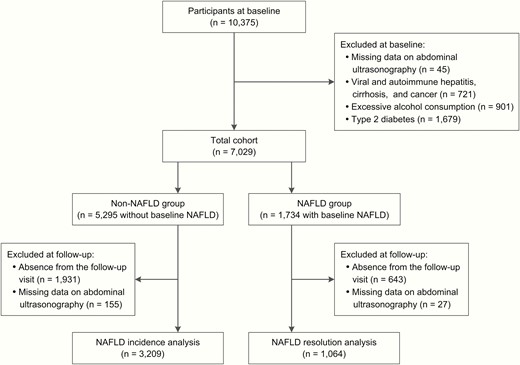
Flowchart of the study population.
Data collection and biochemical measurements
At baseline and follow-up visits, information on sociodemographic characteristics, smoking, alcohol consumption, physical activity, personal and family medical history, and current medications was collected through standard questionnaires. Questions on alcohol drinking habits included the type, amount, and frequency of alcohol intake. Current drinkers or smokers were defined as those who consumed any beverage or smoked cigarettes regularly in the past 6 months. Regular exercise was defined as engaging in physical exercise more than twice a week (12). Anthropometric measurements including body height, weight, waist circumferences, and blood pressure were performed using calibrated instruments with a standard protocol. Body mass index (BMI) was calculated as body weight in kilograms divided by height in meters squared.
All participants underwent an oral glucose tolerance test (OGTT) after an overnight fast of at least 10 hours, and venous blood samples were obtained at 0 and 2 hours during the test. Plasma glucose levels were measured using the glucose oxidase method on an automated analyzer (Modular P800; Roche) within 2 hours after sampling under a stringent quality control program. HbA1c was determined by high-performance liquid chromatography using the VARIANT II Hemoglobin Testing System (Bio-Rad Laboratories). Fasting serum insulin, total cholesterol, low-density lipoprotein (LDL) cholesterol, high-density lipoprotein (HDL) cholesterol, triglycerides, alanine aminotransferase (ALT), and aspartate aminotransferase (AST) were measured by the chemiluminescence methods with an autoanalyzer (Modular E170; Roche).
Definition
The homeostasis model assessment of insulin resistance index was determined by the following formula: fasting insulin (pmol/L) × fasting glucose (mmol/L)/156.3 (17). Hypertension was defined as systolic blood pressure 140 mm Hg or greater, diastolic blood pressure 90 mm Hg or greater, or use of antihypertensive medication. Dyslipidemia was defined based on the National Cholesterol Education Program guidelines as total cholesterol 6.22 mmol/L or greater, LDL cholesterol 4.14 mmol/L or greater, HDL cholesterol less than 1.04 mmol/L, triglycerides 2.26 mmol/L or greater, or taking lipid-lowering medications (18). According to the 2010 American Diabetes Association criteria, T2D was defined as fasting glucose 7.0 mmol/L or greater, 2-hour glucose 11.1 mmol/L or greater, HbA1c 6.5% or greater, or taking antidiabetic medications (19); among participants without T2D, prediabetes was defined as fasting glucose of 5.6 to 6.9 mmol/L, 2-hour glucose of 7.8 to 11.0 mmol/L, or HbA1c of 5.7% to 6.4%.
Nonalcoholic fatty liver disease diagnosis
Hepatic ultrasonography was performed by 2 experienced technicians, who were unaware of clinical and laboratory data, using a high-resolution B-mode tomographic ultrasound system (Esaote Biomedica SpA) with a 3.5-MHz probe at both visits. Diagnosis of fatty liver was ascertained according to the presence of at least 2 of the abnormal imaging findings: 1) diffusely increased echogenicity of the liver relative to the kidney or spleen; 2) ultrasound beam attenuation; and 3) poor visualization of intrahepatic structures (20). NAFLD was determined on the diagnosis of fatty liver after exclusion of alcohol abuse and other liver diseases. Resolution of NAFLD referred to diagnosis of having NAFLD at baseline but not at follow-up.
In participants with incident NAFLD, we used the fibrosis-4 (FIB-4) index as a noninvasive marker to evaluate the probability of fibrosis. The index was calculated with the following formula: FIB-4 = age (years) × AST (U/L)/[platelet count (×109/L) × ALT (U/L)1/2]. A higher probability of advanced fibrosis was defined as a FIB-4 of 1.3 or greater (21).
Statistical analysis
Data on baseline characteristics were summarized using frequencies for categorical variables and mean ± standard deviation (SD) or median (interquartile range) for continuous variables. Modified Poisson regression models with a robust error variance were used to estimate risk ratios (RRs) for development and resolution of NAFLD associated with glycemic measures (22). To confirm graded associations, each glycemic measure was categorized into 4 groups as follows: fasting glucose less than 5.0 (reference), 5.0 to 5.5, 5.6 to 6.0, and 6.1 to 6.9 mmol/L; 2-hour glucose less than 6.0 (reference), 6.0 to 7.7, 7.8 to 8.9, and 9.0 to 11.0 mmol/L; HbA1c less than 5.4% (reference), 5.4% to 5.6%, 5.7% to 6.0%, and 6.1% to 6.4%. Glycemic measures were also fitted as continuous variables to estimate risk for 1-SD difference (fasting glucose 0.56 mmol/L, 2-h glucose 1.70 mmol/L, HbA1c 0.34%). The models were initially adjusted for age and sex, and further adjusted for education, smoking status, alcohol drinking, regular exercise, family history of diabetes, hypertension, and dyslipidemia (model 1). Model 2 was adjusted for BMI and fasting insulin based on model 1. The analysis of HbA1c was additionally adjusted for hemoglobin. We then examined the pattern of associations between glycemic measures and NAFLD outcomes using restricted cubic splines with knots at the 5th, 50th, and 95th percentiles of distribution of glycemic levels in the multivariable models, and the reference value was set at the 10th percentile.
With repeated assessment of glycemic measures that were taken about 4.4 years apart, we estimated RRs for incident NAFLD and resolution of baseline NAFLD according to changes in glucose metabolism status among normal, prediabetes, and T2D categories, as defined by different measures. In the analyses, the same adjustment was applied and change in BMI during follow-up was also adjusted. To explore the bidirectionality of the relationship between glucose metabolism and NAFLD, we investigated the impact of NAFLD status on changes in glucose metabolism at follow-up. All analyses were performed using SAS version 9.4 (SAS Institute) and R version 3.5.3 (R Foundation for Statistical Computing). A 2-sided P value of less than .05 was considered statistically significant.
Results
Baseline characteristics according to development of nonalcoholic fatty liver disease
Among the 4273 participants included, the mean (SD) age was 56.7 (8.6) years and 72.2% were women. The prevalence of NAFLD at baseline was 24.9%. Baseline characteristics of the cohort according to development of incident NAFLD at follow-up are shown in Table 1. Of the 3209 participants without baseline NAFLD, 573 (17.9%) incident cases of NAFLD were identified during a mean follow-up of 4.4 years. Participants who developed NAFLD seemed to have higher levels of BMI, waist circumference, blood pressure, total cholesterol, LDL cholesterol, triglycerides, fasting insulin, OGTT 2-hour glucose, and HbA1c compared with those remaining free from NAFLD.
Baseline characteristics of study participants according to development of nonalcoholic fatty liver disease
| Incident NAFLD | |||
|---|---|---|---|
| Characteristics | No (n = 2636) | Yes (n = 573) | P |
| Age, y | 56.6 (8.8) | 56.8 (8.5) | .656 |
| Women, % | 72.2 | 73.8 | .439 |
| High education, %a | 65.7 | 62.7 | .177 |
| Current smoker, % | 13.9 | 14.7 | .616 |
| Current drinker, % | 1.7 | 1.2 | .372 |
| Regular exercise, % | 59.6 | 60.0 | .860 |
| Family history of diabetes, % | 7.6 | 9.6 | .114 |
| Hypertension, % | 48.8 | 59.3 | < .001 |
| Dyslipidemia, % | 29.5 | 45.7 | < .001 |
| BMI, kg/m2 | 23.8 (2.6) | 25.6 (2.8) | < .001 |
| Waist circumference, cm | 78.3 (7.5) | 82.7 (7.1) | < .001 |
| Systolic BP, mm Hg | 136.9 (19.5) | 141.5 (20.6) | < .001 |
| Diastolic BP, mm Hg | 81.0 (9.8) | 83.5 (10.4) | < .001 |
| Total cholesterol, mmol/L | 5.3 (0.9) | 5.5 (1.0) | < .001 |
| LDL cholesterol, mmol/L | 3.1 (0.8) | 3.3 (0.9) | < .001 |
| HDL cholesterol, mmol/L | 1.4 (0.3) | 1.3 (0.3) | < .001 |
| Triglycerides, mmol/L | 1.2 (0.9-1.6) | 1.5 (1.1-2.1) | < .001 |
| AST, IU/L | 21.1 (18.1-24.5) | 20.8 (17.8-24.6) | .262 |
| ALT, IU/L | 16.0 (12.6-20.8) | 17.4 (13.8-23.4) | < .001 |
| HOMA-IR | 1.3 (0.9-1.7) | 1.6 (1.2-2.2) | < .001 |
| Fasting insulin, pmol/L | 39.6 (28.5-52.8) | 49.7 (36.1-66.7) | < .001 |
| Fasting glucose, mmol/L | 5.0 (0.5) | 5.1 (0.5) | .652 |
| 2-h glucose, mmol/L | 6.4 (1.6) | 6.8 (1.7) | < .001 |
| HbA1c, % | 5.5 (0.3) | 5.6 (0.3) | < .001 |
Data are mean (SD) or median (interquartile range) or percentage.
Abbreviations: ALT, alanine aminotransferase; AST, aspartate aminotransferase; BMI, body mass index; BP, blood pressure; HbA1c, hemoglobin A1c; HDL, high-density lipoprotein; HOMA-IR, homeostasis model assessment of insulin resistance; LDL, low-density lipoprotein; NAFLD, nonalcoholic fatty liver disease.
aHigh school or above.
Glycemic measures and incident nonalcoholic fatty liver disease
Table 2 shows the risk of incident NAFLD according to baseline levels of glycemic measures. After adjusting for covariates, elevated 2-hour glucose and HbA1c levels were positively associated with incident NAFLD. Further adjustment for BMI and fasting insulin did not change the association for 2-hour glucose, but attenuated the association for HbA1c. Compared with the reference group (< 6.0 mmol/L), the RRs (95% CI) for incident NAFLD with 2-hour glucose in the categories of 6.0 to 7.7, 7.8 to 8.9, and 9.0 to 11.0 mmol/L were 1.27 (1.07-1.52), 1.46 (1.16-1.83), and 1.46 (1.13-1.88), respectively (P trend < .001). The RR (95% CI) corresponding to each 1-SD increment in 2-hour glucose was 1.16 (1.08-1.25). The linear association between 2-hour glucose and NAFLD was confirmed by the spline regression analysis (Fig. 2). Furthermore, among the participants with NAFLD, 2-hour glucose was associated with a higher probability of advanced fibrosis (RR per 1-SD increase: 1.07, 95% CI: 1.02-1.12).
Risk of incident nonalcoholic fatty liver disease according to baseline levels of glycemic measures
| Multivariable-adjusted RR (95% CI) | ||||||
|---|---|---|---|---|---|---|
| Variable | No. | No. of Cases | Incidence Rate, % | Age- and Sex-Adjusted RR (95% CI) | Model 1 | Model 2 |
| Fasting glucose, mmol/L | ||||||
| < 5.0 | 1592 | 282 | 17.7 | (Reference) | (Reference) | (Reference) |
| 5.0-5.5 | 1154 | 212 | 18.4 | 1.03 (0.88-1.22) | 0.97 (0.83-1.14) | 0.92 (0.79-1.08) |
| 5.6-6.0 | 325 | 52 | 16.0 | 0.90 (0.69-1.18) | 0.83 (0.63-1.09) | 0.81 (0.62-1.06) |
| 6.1-6.9 | 138 | 27 | 19.6 | 1.10 (0.77-1.57) | 0.93 (0.65-1.34) | 0.82 (0.58-1.17) |
| P for trend | .979 | .282 | .076 | |||
| Per 1-SD increment | 1.02 (0.94-1.10) | 0.97 (0.89-1.05) | 0.93 (0.86-1.01) | |||
| 2-h glucose, mmol/L | ||||||
| < 6.0 | 1344 | 178 | 13.2 | (Reference) | (Reference) | (Reference) |
| 6.0-7.7 | 1231 | 247 | 20.1 | 1.52 (1.28-1.82) | 1.41 (1.18-1.69) | 1.27 (1.07-1.52) |
| 7.8-8.9 | 372 | 85 | 22.9 | 1.75 (1.39-2.22) | 1.62 (1.28-2.05) | 1.46 (1.16-1.83) |
| 9.0-11.0 | 258 | 62 | 24.0 | 1.85 (1.43-2.40) | 1.64 (1.27-2.13) | 1.46 (1.13-1.88) |
| P for trend | < .001 | < .001 | < .001 | |||
| Per 1-SD increment | 1.27 (1.18-1.37) | 1.22 (1.13-1.31) | 1.16 (1.08-1.25) | |||
| HbA1c, % | ||||||
| < 5.4 | 868 | 132 | 15.2 | (Reference) | (Reference) | (Reference) |
| 5.4-5.6 | 1149 | 196 | 17.1 | 1.12 (0.92-1.38) | 1.13 (0.93-1.39) | 1.07 (0.88-1.30) |
| 5.7-6.0 | 974 | 198 | 20.3 | 1.34 (1.09-1.64) | 1.33 (1.08-1.63) | 1.16 (0.95-1.41) |
| 6.1-6.4 | 213 | 46 | 21.6 | 1.42 (1.05-1.93) | 1.49 (1.10-2.03) | 1.28 (0.94-1.75) |
| P for trend | .001 | .001 | .063 | |||
| Per 1-SD increment | 1.14 (1.05-1.23) | 1.14 (1.05-1.24) | 1.08 (0.99-1.17) | |||
Model 1: adjusted for age, sex, education level, smoking, alcohol drinking, physical exercise, family history of diabetes, hypertension, dyslipidemia, and hemoglobin (HbA1c only); model 2: model 1 further adjusted for BMI and insulin.
Missing data: 4 for 2-h glucose and 5 for HbA1c.
Abbreviations: BMI, body mass index; HbA1c, hemoglobin A1c; RR, risk ratio.
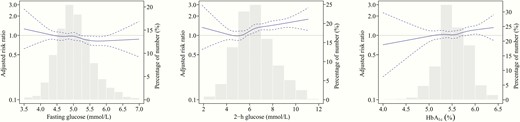
Associations between glycemic levels and risk of incident nonalcoholic fatty liver disease (NAFLD) in nondiabetic individuals. The solid lines indicate adjusted risk ratios and dashed lines indicate 95% CIs based on restricted cubic regression models. The bars indicate the distributions of glycemic levels among participants. Multivariable models were adjusted for age, sex, education, smoking, alcohol drinking, physical exercise, family history of diabetes, hypertension, dyslipidemia, hemoglobin (HbA1c only), body mass index, and fasting insulin.
Change in glycemic measures and incident nonalcoholic fatty liver disease
We further investigated the relationship between change in glucose regulation status and incident NAFLD. The risk of NAFLD increased with graded deterioration of glucose metabolism (Table 3). Compared with those who had normal 2-hour glucose values at both visits, the highest risk of incident NAFLD was observed for individuals who progressed from normal to T2D (RR: 2.45 [95% CI: 1.85-3.26]) or from impaired glucose tolerance (IGT) to T2D (2.27 [1.77-2.91]), followed by individuals who transitioned from normal to IGT (1.72 [1.43-2.06]) or had sustained IGT (1.68 [1.34-2.11]), whereas individuals who regressed from IGT to normal showed no higher risk (1.03 [0.71-1.50]). Similarly, increases in fasting glucose and HbA1c with conversion to T2D or prediabetes were associated with significantly higher risk of NAFLD.
Risk of incident nonalcoholic fatty liver disease according to changes in levels of glycemic measures during follow-up
| Multivariable-Adjusted RR (95% CI) | ||||||
|---|---|---|---|---|---|---|
| Change Categorya | No. | No. of Cases | Incidence Rate, % | Age- and Sex-Adjusted RR (95% CI) | Model 1 | Model 2 |
| Fasting glucose | ||||||
| Normal-normal | 1600 | 231 | 14.4 | (Reference) | (Reference) | (Reference) |
| Normal-impaired | 1090 | 242 | 22.2 | 1.54 (1.31-1.82) | 1.43 (1.21-1.69) | 1.31 (1.11-1.54) |
| Normal-diabetic | 50 | 20 | 40.0 | 2.77 (1.94-3.97) | 2.42 (1.72-3.42) | 2.31 (1.66-3.21) |
| Impaired-normal/impaired | 401 | 58 | 14.5 | 1.01 (0.77-1.32) | 0.91 (0.70-1.19) | 0.88 (0.68-1.14) |
| Impaired-diabetic | 62 | 21 | 33.9 | 2.37 (1.64-3.42) | 2.10 (1.44-3.06) | 1.89 (1.29-2.77) |
| 2-h glucose | ||||||
| Normal-normal | 1790 | 223 | 12.5 | (Reference) | (Reference) | (Reference) |
| Normal-impaired | 659 | 166 | 25.2 | 2.05 (1.71-2.45) | 1.91 (1.59-2.29) | 1.72 (1.43-2.06) |
| Normal-diabetic | 96 | 34 | 35.4 | 2.92 (2.17-3.94) | 2.64 (1.97-3.54) | 2.45 (1.85-3.26) |
| Impaired-normal | 196 | 25 | 12.8 | 1.05 (0.71-1.54) | 1.01 (0.70-1.48) | 1.03 (0.71-1.50) |
| Impaired-impaired | 294 | 74 | 25.2 | 2.08 (1.65-2.63) | 1.90 (1.50-2.40) | 1.68 (1.34-2.11) |
| Impaired-diabetic | 136 | 47 | 34.6 | 2.88 (2.20-3.75) | 2.63 (2.02-3.43) | 2.27 (1.77-2.91) |
| HbA1c | ||||||
| Normal-normal | 1757 | 260 | 14.8 | (Reference) | (Reference) | (Reference) |
| Normal-elevated/diabetic | 241 | 65 | 27.0 | 1.82 (1.44-2.31) | 1.79 (1.41-2.27) | 1.48 (1.15-1.91) |
| Elevated-normal | 539 | 83 | 15.4 | 1.05 (0.83-1.31) | 1.07 (0.86-1.35) | 1.03 (0.83-1.28) |
| Elevated-elevated | 593 | 137 | 23.1 | 1.57 (1.30-1.89) | 1.52 (1.26-1.83) | 1.33 (1.10-1.59) |
| Elevated-diabetic | 43 | 21 | 48.8 | 3.34 (2.41-4.63) | 3.19 (2.26-4.50) | 2.89 (2.06-4.05) |
Model 1: adjusted for age, sex, education level, smoking, alcohol drinking, physical exercise, family history of diabetes, hypertension, dyslipidemia, and hemoglobin (HbA1c only); model 2: model 1 further adjusted for baseline BMI and insulin and change in BMI during follow-up.
Missing paired data: 6 for fasting glucose, 38 for 2-h glucose, and 36 for HbA1c.
Abbreviations: BMI, body mass index; HbA1c, hemoglobin A1c; RR, risk ratio.
aFasting glucose (normal: < 5.6; impaired: 5.6-6.9; diabetes: ≥ 7.0 mmol/L or diabetes medication use), 2-h glucose (normal: < 7.8 mmol/L; impaired: 7.8-11.0 mmol/L; diabetes: ≥ 11.1 mmol/L or diabetes medication use), HbA1c (normal: < 5.7%; impaired: 5.7%-6.4%; diabetes: ≥ 6.5% or diabetes medication use). Owing to small numbers, the impaired-normal category for fasting glucose and the normal-diabetic category for HbA1c were combined into the adjacent category.
Baseline characteristics according to resolution of nonalcoholic fatty liver disease
Among the 1064 participants with NAFLD at baseline, NAFLD resolved in 304 (28.6%) participants during follow-up. Baseline characteristics of the cohort according to resolution of NAFLD are listed in Table 4. Participants who achieved resolution of NAFLD were older, and more likely to be men and have healthier metabolic parameters including lower levels of fasting insulin, fasting, and OGTT 2-hour glucose than those with a consistent presence of NAFLD.
Baseline characteristics of study participants according to resolution of nonalcoholic fatty liver disease
| NAFLD Resolution | |||
|---|---|---|---|
| Characteristics | No (n = 760) | Yes (n = 304) | P |
| Age, y | 56.4 (8.0) | 57.5 (8.1) | .038 |
| Women, % | 73.9 | 65.1 | .004 |
| High education, %a | 66.6 | 66.8 | .951 |
| Current smoker, % | 13.0 | 14.8 | .444 |
| Current drinker, % | 1.6 | 4.9 | .002 |
| Regular exercise, % | 57.8 | 59.2 | .665 |
| Family history of diabetes, % | 12.2 | 9.5 | .212 |
| Hypertension (%) | 72.1 | 63.5 | .006 |
| Dyslipidemia (%) | 61.3 | 55.9 | .105 |
| BMI, kg/m2 | 27.5 (2.8) | 27.1 (2.9) | .012 |
| Waist circumference, cm | 88.1 (7.3) | 87.5 (7.7) | .257 |
| Systolic BP, mm Hg | 145.5 (18.6) | 143.2 (18.3) | .062 |
| Diastolic BP, mm Hg | 86.1 (10.0) | 84.6 (10.2) | .032 |
| Total cholesterol, mmol/L | 5.6 (1.2) | 5.4 (1.0) | .015 |
| LDL cholesterol, mmol/L | 3.3 (0.9) | 3.2 (1.0) | .045 |
| HDL cholesterol, mmol/L | 1.2 (0.3) | 1.2 (0.3) | .495 |
| Triglycerides, mmol/L | 1.9 (1.4-2.7) | 1.7 (1.3-2.4) | .047 |
| AST, IU/L | 22.3 (19.0-26.8) | 21.8 (18.6-26.3) | .157 |
| ALT, IU/L | 22.8 (17.5-31.9) | 20.0 (14.9-27.2) | < .001 |
| HOMA-IR | 2.4 (1.7-3.3) | 2.0 (1.5-2.8) | < .001 |
| Fasting insulin, pmol/L | 72.2 (52.1-95.5) | 60.8 (45.8-84.0) | < .001 |
| Fasting glucose, mmol/L | 5.3 (0.6) | 5.1 (0.5) | < .001 |
| 2-h glucose, mmol/L | 7.5 (1.7) | 7.0 (1.7) | < .001 |
| HbA1c, % | 5.7 (0.3) | 5.6 (0.3) | .051 |
Data are mean (SD) or median (interquartile range) or percentage.
Abbreviations: ALT, alanine aminotransferase; AST, aspartate aminotransferase; BMI, body mass index; BP, blood pressure; HbA1c, hemoglobin A1c; HDL, high-density lipoprotein; HOMA-IR, homeostasis model assessment of insulin resistance; LDL, low-density lipoprotein; NAFLD, nonalcoholic fatty liver disease.
aHigh school or above.
Glycemic measures and resolution of nonalcoholic fatty liver disease
Table 5 shows the association between levels of glycemic measures and resolution of NAFLD at follow-up. After full adjustment for covariates, fasting and 2-hour glucose were negatively associated with resolution of NAFLD. The RRs (95% CI) for resolution of NAFLD corresponding to each 1-SD increment in fasting glucose and 2-hour glucose were 0.86 (0.78-0.94) and 0.85 (0.77-0.93), respectively. The dose-response association with HbA1c was less clear. Spline regression analyses indicated a significant decrease in likelihood of resolution of NAFLD when fasting and 2-hour glucose levels exceeded the prediabetes threshold (Fig. 3).
Associations between baseline levels of glycemic measures and resolution of nonalcoholic fatty liver disease
| Multivariable-adjusted RR (95% CI) | ||||||
|---|---|---|---|---|---|---|
| Variable | No. | No. of Resolution | Resolution Rate, % | Age- and Sex-Adjusted RR (95% CI) | Model 1 | Model 2 |
| Fasting glucose, mmol/L | ||||||
| < 5.0 | 378 | 131 | 34.7 | (Reference) | (Reference) | (Reference) |
| 5.0-5.5 | 428 | 118 | 27.6 | 0.81 (0.66-1.00) | 0.85 (0.69-1.04) | 0.88 (0.71-1.08) |
| 5.6-6.0 | 162 | 40 | 24.7 | 0.72 (0.53-0.97) | 0.73 (0.54-1.00) | 0.74 (0.54-1.01) |
| 6.1-6.9 | 96 | 15 | 15.6 | 0.43 (0.27-0.70) | 0.46 (0.28-0.75) | 0.47 (0.29-0.76) |
| P for trend | < .001 | < .001 | < .001 | |||
| Per 1-SD increment | 0.84 (0.77-0.92) | 0.85 (0.78-0.93) | 0.86 (0.78-0.94) | |||
| 2-h glucose (mmol/L) | ||||||
| < 6.0 | 227 | 87 | 38.3 | (Reference) | (Reference) | (Reference) |
| 6.0–7.7 | 408 | 125 | 30.6 | 0.81 (0.65-1.01) | 0.86 (0.69-1.07) | 0.87 (0.70-1.09) |
| 7.8–8.9 | 220 | 51 | 23.2 | 0.60 (0.44-0.80) | 0.63 (0.47-0.84) | 0.64 (0.48-0.86) |
| 9.0–11.0 | 207 | 41 | 19.8 | 0.51 (0.37-0.70) | 0.57 (0.41–0.79) | 0.59 (0.43-0.82) |
| P for trend | < .001 | < .001 | < .001 | |||
| Per 1-SD increment | 0.81 (0.74-0.89) | 0.84 (0.76-0.92) | 0.85 (0.77-0.93) | |||
| HbA1c (%) | ||||||
| < 5.4 | 191 | 62 | 32.5 | (Reference) | (Reference) | (Reference) |
| 5.4–5.6 | 351 | 110 | 31.3 | 0.95 (0.73-1.22) | 0.92 (0.71-1.18) | 0.93 (0.72-1.20) |
| 5.7–6.0 | 386 | 97 | 25.1 | 0.75 (0.57-0.98) | 0.73 (0.56-0.96) | 0.73 (0.56-0.95) |
| 6.1-6.4 | 134 | 35 | 26.1 | 0.78 (0.55-1.11) | 0.79 (0.56-1.12) | 0.82 (0.58-1.16) |
| P for trend | .027 | .032 | .038 | |||
| Per 1-SD increment | 0.90 (0.82-0.99) | 0.91 (0.82-1.00) | 0.91 (0.83-1.00) | |||
Model 1: adjusted for age, sex, education level, smoking, alcohol drinking, physical exercise, family history of diabetes, hypertension, dyslipidemia, and hemoglobin (HbA1c only); model 2: model 1 further adjusted for BMI and insulin.
Missing data: 2 for 2-h glucose and 2 for HbA1c.
Abbreviations: BMI, body mass index; HbA1c, hemoglobin A1c; RR, risk ratio.
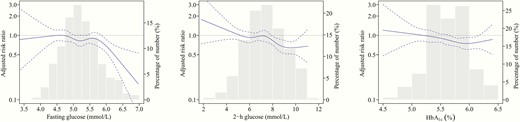
Associations between glycemic levels and resolution of baseline nonalcoholic fatty liver disease (NAFLD) in nondiabetic individuals. The solid lines indicate adjusted risk ratios and dashed lines indicate 95% CIs based on restricted cubic regression models. The bars indicate the distributions of glycemic levels among participants. Multivariable models were adjusted for age, sex, education, smoking, alcohol drinking, physical exercise, family history of diabetes, hypertension, dyslipidemia, hemoglobin (HbA1c only), body mass index, and fasting insulin.
Change in glycemic measures and resolution of nonalcoholic fatty liver disease
The resolution rate of NAFLD was highest for those who had normal glycemic values at both assessments and decreased with deterioration of glucose metabolism (Table 6). The RR (95% CI) for resolution of NAFLD was lowest in individuals who progressed from IGT to T2D (0.34 [0.21-0.54]) or from impaired fasting glucose (IFG) to T2D (0.45 [0.25-0.83]), as compared to those with sustained normal values. Individuals with stable IFG/IGT or transition from normal to IFG/IGT or T2D also had decreased likelihood of NAFLD resolution. There was a similar pattern of associations between change in HbA1c and resolution of NAFLD.
Associations between changes in levels of glycemic measures during follow-up and resolution of nonalcoholic fatty liver disease
| Multivariable-adjusted RR (95% CI) | ||||||
|---|---|---|---|---|---|---|
| Change Categorya | No. | No. of Resolution | Resolution Rate, % | Age- and Sex-Adjusted RR (95% CI) | Model 1 | Model 2 |
| Fasting glucose | ||||||
| Normal-normal | 390 | 140 | 35.9 | (Reference) | (Reference) | (Reference) |
| Normal-impaired | 382 | 102 | 26.7 | 0.75 (0.61-0.93) | 0.77 (0.63-0.95) | 0.83 (0.67-1.02) |
| Normal-diabetic | 33 | 7 | 21.2 | 0.61 (0.31-1.19) | 0.68 (0.35-1.35) | 0.75 (0.39-1.44) |
| Impaired-normal | 19 | 7 | 36.8 | 1.03 (0.58-1.81) | 1.05 (0.58-1.88) | 1.06 (0.59-1.89) |
| Impaired-impaired | 178 | 38 | 21.4 | 0.59 (0.43-0.81) | 0.62 (0.45-0.84) | 0.63 (0.46-0.87) |
| Impaired-diabetic | 60 | 10 | 16.7 | 0.44 (0.25-0.78) | 0.42 (0.23-0.77) | 0.45 (0.25-0.83) |
| 2-h glucose | ||||||
| Normal-normal | 330 | 133 | 40.3 | (Reference) | (Reference) | (Reference) |
| Normal-impaired | 241 | 60 | 24.9 | 0.61 (0.47-0.78) | 0.62 (0.48-0.80) | 0.65 (0.51-0.84) |
| Normal-diabetic | 56 | 14 | 25.0 | 0.60 (0.37-0.96) | 0.59 (0.36-0.96) | 0.65 (0.40-1.06) |
| Impaired-normal | 81 | 26 | 32.1 | 0.80 (0.56-1.13) | 0.84 (0.59-1.18) | 0.84 (0.60-1.18) |
| Impaired-impaired | 194 | 47 | 24.2 | 0.57 (0.43-0.76) | 0.59 (0.45-0.79) | 0.64 (0.49-0.84) |
| Impaired-diabetic | 142 | 17 | 12.0 | 0.29 (0.18-0.46) | 0.31 (0.19-0.50) | 0.34 (0.21-0.54) |
| HbA1c | ||||||
| Normal-normal | 427 | 148 | 34.7 | (Reference) | (Reference) | (Reference) |
| Normal-elevated /diabetic | 111 | 23 | 20.7 | 0.59 (0.40-0.87) | 0.60 (0.40-0.88) | 0.61 (0.42-0.89) |
| Elevated-normal | 172 | 62 | 36.1 | 1.02 (0.81-1.30) | 1.01 (0.79-1.28) | 1.00 (0.78-1.26) |
| Elevated-elevated | 279 | 60 | 21.5 | 0.60 (0.47-0.78) | 0.61 (0.47-0.79) | 0.61 (0.47-0.78) |
| Elevated-diabetic | 61 | 8 | 13.1 | 0.37 (0.19-0.72) | 0.39 (0.20-0.76) | 0.42 (0.22-0.82) |
Model 1: adjusted for age, sex, education level, smoking, alcohol drinking, physical exercise, family history of diabetes, hypertension, dyslipidemia, and hemoglobin (HbA1c only); model 2: model 1 further adjusted for baseline BMI and insulin and change in BMI during follow-up.
Missing paired data: 2 for fasting glucose, 20 for 2-h glucose, and 14 for HbA1c.
Abbreviations: BMI, body mass index; HbA1c, hemoglobin A1c; RR, risk ratio.
aFasting glucose (normal: < 5.6 mmol/L; impaired: 5.6-6.9 mmol/L; diabetes: ≥ 7.0 mmol/L or diabetes medication use), 2-h glucose (normal: < 7.8 mmol/L; impaired: 7.8-11.0 mmol/L; diabetes: ≥11.1 mmol/L or diabetes medication use), HbA1c (normal: < 5.7%; impaired: 5.7%-6.4%; diabetes: ≥ 6.5% or diabetes medication use). Owing to small numbers, the normal-diabetic category for HbA1c was combined into the adjacent category.
Nonalcoholic fatty liver disease status and change in glucose metabolism
To test the bidirectionality, we further examined the impact of NAFLD on change in glucose metabolism (Fig. 4). When taking normal to normal and regression to normal categories as the reference outcome, baseline NAFLD was associated with a higher risk of progression to T2D (based on fasting glucose, RR: 1.52 [95% CI: 1.16-1.98]; based on 2-h glucose, 1.55 [1.28-1.87]; based on HbA1c, 1.98 [1.31-2.99]) and transition from normal to IGT (1.20 [1.09-1.32]). The development of NAFLD showed a more pronounced association with glycemic deterioration, whereas NAFLD resolution was inversely associated with glycemic deterioration.
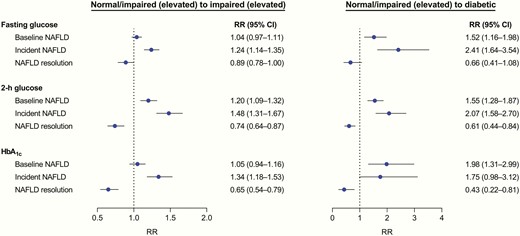
Associations between nonalcoholic fatty liver disease (NAFLD) status and changes in glucose metabolism during follow-up. In the multinomial regression models, the combined normal-normal and impaired (elevated)-normal categories were treated as the reference outcome. Models were adjusted for age, sex, education, smoking, alcohol drinking, physical exercise, family history of diabetes, hypertension, dyslipidemia, hemoglobin (HbA1c only), body mass index (BMI), fasting insulin, and baseline values of corresponding glycemic measures. For analysis of changes in glucose metabolism with incident NAFLD or NAFLD resolution, change in BMI was additionally adjusted.
Discussion
In this prospective study of middle-aged and elderly Chinese adults without T2D, 2-hour glucose was positively associated with incident NAFLD, whereas fasting and 2-h glucose were inversely associated with resolution of baseline NAFLD. During follow-up, individuals with greater increases in any of the glycemic measures had increased risk of developing NAFLD and decreased likelihood of remission of NAFLD. The associations were most notable for individuals who developed T2D, followed by individuals who developed prediabetes or remained in prediabetes status. Furthermore, baseline or incident NAFLD conferred excess risk of deterioration in glucose metabolism.
T2D as a risk factor for the development of NAFLD has been well documented (7-10). Nevertheless, substantial uncertainty remains as to whether glycemic levels among individuals without T2D are associated with NAFLD risk. In a cross-sectional analysis of nondiabetic Korean adults attending a health checkup program, the risk of NAFLD increased with increasing levels of HbA1c (11). The large, prospective China Kadoorie Biobank study that involved 0.5 million people reported a positive and dose-dependent association between random blood glucose and NAFLD in participants without previously diagnosed T2D (10). Our findings extend the current evidence by identifying a graded risk of incident NAFLD associated with 2-hour glucose across the continuous spectrum of the nondiabetic range. Intriguingly, we still found inverse associations of fasting and 2-hour glucose with resolution of NAFLD. It is noteworthy that NAFLD cases in this study were ascertained through on-site testing by hepatic ultrasonography, therefore largely reducing the possibility of underdiagnosis of asymptomatic NAFLD, a potential limitation as indicated in the China Kadoorie Biobank study, in which hospitalized NAFLD cases were targeted.
In the present study, we observed a significant relationship between 2-hour glucose and NAFLD incidence after controlling for the influence of insulin, reflecting an independent role of postprandial hyperglycemia in driving NAFLD. It has been shown that IGT is more common than IFG in NAFLD patients without known T2D (23). More than half of the NAFLD patients with normal fasting glucose were reported to have a 2-hour glucose of 7.8 mmol/L or greater (24). IGT differs from IFG in its pathophysiology, with IFG being predominantly related to impaired basal and first-phase insulin secretion, whereas IGT is mainly characterized by insulin resistance (25). Moreover, we found a positive association of 2-hour glucose and risk of advanced fibrosis among participants with NAFLD. Our analysis, together with prior studies, suggests that postprandial glucose should be considered for routine testing to assess not only the risk of NAFLD but also the prognosis of NAFLD.
Several longitudinal studies indicated the association between NAFLD improvement and T2D incidence reduction (12-14); however, the impact of change in glucose metabolism on NAFLD outcomes has not been fully elucidated. In this study, individuals who developed T2D exhibited an approximately 1 to 2 times higher risk of incident NAFLD and a 30% to 60% lower likelihood of resolution of existing NAFLD, as compared with those who maintained normal glycemic levels. Strikingly, there was a significant increase in the risk of NAFLD by 30% to 70% and a decrease in the likelihood of resolution of NAFLD by 20% to 40% for individuals who developed prediabetes or remained in prediabetes status. These results contribute new knowledge that glycemic deterioration over time, even below the threshold for T2D, may play an unfavorable role in preventing or improving NAFLD, which highlights the importance of maintaining long-term normoglycemia.
Besides the role of glycemic measures in NAFLD, we detected an increased risk of deterioration in glucose metabolism linked with baseline or incident NAFLD and a decreased risk with NAFLD resolution. A series of prospective studies reported that baseline NAFLD and NAFLD development or improvement were closely associated with the risk of incident T2D (12-14, 26). Consistent with our results, growing evidence suggests the bidirectional associations of NAFLD and T2D (9, 27). Given the complex interplay between the 2 metabolic conditions, NAFLD may act both as a determinant and a consequence of T2D or even prediabetes.
NAFLD and T2D frequently coexist because they share pathogenic abnormalities. Insulin resistance promotes free fatty acid influx into the liver, thereby contributing to de novo lipid synthesis (28). Hyperglycemia per se can directly lead to hepatic steatosis by increasing lipogenesis and inhibiting fat oxidation via upregulation of key lipogenic transcription factors sterol regulatory element-binding protein 1c and carbohydrate response element-binding protein (29). In turn, hepatic steatosis could stimulate the release of proatherogenic and proinflammatory mediators from the liver that exacerbate hepatic and systemic insulin resistance (30). Several genetic and environmental factors may also explain the link between hyperglycemia and NAFLD (7).
The primary strength of this study is its ability to comprehensively examine the impact of multiple glycemic variables, namely fasting glucose, 2-hour glucose, and HbA1c, on the development and resolution of NAFLD in nondiabetic individuals. Another novel aspect is that the repeated assessments allow us to evaluate the association between change in glycemic measures and outcomes. Several limitations of this study merit consideration. First, NAFLD diagnosis was determined using ultrasound, which is incapable of detecting steatosis at a degree less than 20% (31). This might lead to underestimate of NAFLD incidence rate and overestimate of remission rate. Even so, ultrasound is the most common technique used for diagnosing NAFLD in clinical practice or population-based settings given its wide availability and affordability (32). Second, because NAFLD and glycemic measures at follow-up were determined concurrently, uncertainty regarding temporal relations between change in glucose metabolism and incident NAFLD may potentially exist. Nevertheless, we found a similar association of change in glycemic levels with incident NAFLD when excluding self-reported NAFLD cases during follow-up. Moreover, the graded risk estimates largely attribute causality to this association. Future studies with multiple follow-up data are needed to validate our findings. Third, the study participants mainly consisted of women (~ 70%) and had an average age of approximately 55 years, thus the present results may not be directly generalizable to other populations. Finally, although we fully adjusted for various confounders, several factors that could affect glycemic measures and NAFLD such as dietary habits were unavailable in this study.
In conclusion, among nondiabetic Chinese adults, 2-hour glucose was positively associated with NAFLD incidence, whereas fasting and 2-hour glucose were negatively associated with resolution of NAFLD. Transition from normal glycemic regulation to T2D or even prediabetes conferred increased risk of developing NAFLD and decreased likelihood of resolution of NAFLD. Meanwhile, baseline or incident NAFLD significantly increased the risk of deterioration in glucose metabolism. Our findings support the intervention strategies that target prevention and treatment of NAFLD by managing long-term healthy glycemic status and vice versa.
Abbreviations
- ALT
alanine aminotransferase
- AST
aspartate aminotransferase
- BMI
body mass index
- BP
blood pressure
- HbA1c
hemoglobin A1c
- IFG
impaired fasting glucose
- IGT
impaired glucose tolerance
- NAFLD
nonalcoholic fatty liver disease
- OGTT
oral glucose tolerance test;
- RR
risk ratio
- T2D
type 2 diabetes.
Acknowledgments
Financial Support: This work was funded by the National Key R&D Program of China (Grants 2016YFC1305600, 2017YFC1310700, 2018YFC1311800, 2016YFC0901200, and 2016YFC1304904), Non-profit Industry Research Subject (Grant 201502007), National Natural Science Foundation of China (Grants 81621061, and 81561128019), the Shanghai Pujiang Program (Grant 18PJ1409600) and Shanghai Municipal Education Commission–Gaofeng Clinical Medicine (Grants 20171901, 20161301, 20152508, and 20161307), and the Shanghai Outstanding Academic Leaders Plan (Grant 18XD1402500).
Additional Information
Disclosure Summary: The authors have nothing to disclose.
Data Availability: Restrictions apply to the availability of data generated or analyzed during this study to preserve patient confidentiality or because they were used under license. The corresponding author will on request detail the restrictions and any conditions under which access to some data may be provided.
References
Author notes
Bin Wang and Mian Li contributed equally to this work.
