


Abstract
Reports on the incidence, characteristics, and comorbidity in Asian patients with acromegaly are scarce.
To evaluate the incidence of acromegaly and the risk of comorbidities in East Asia, especially South Korea.
This nationwide population-based cohort study using the Korean Health Insurance Review and Assessment claims database evaluated the incidence of acromegaly, initially diagnosed from 2010 to 2013. We identified comorbidities during, before, and 2 years after diagnosis. Acromegaly and control cases (718 and 7180, respectively) were included in the analysis.
A longitudinal case-control study using a nationwide population cohort.
The mean annual incidence rate of acromegaly was 3.57 cases per 1 000 000. Malignancies occurred in 61 patients with acromegaly (8.5%) during the study period and thyroid cancer was the most common malignancy (n = 38). In the acromegaly group, the overall risk of malignancy was higher: hazard ratio (HR), 2.82 (95% confidence interval [CI]: 2.12–3.74). Malignancy risk was more pronounced in females, with increased risk from the prediagnosis period that is sustained until the postdiagnosis period. Prevalence of diabetes mellitus (DM) and heart failure increased significantly in acromegalic patients. Over the entire period, DM developed in 51.1% and 57.0% of male and female acromegalic patients, respectively. Mortality risk was higher (HR 1.65, 95%; CI: 1.13–2.41) and statistically significant in females (HR 1.75, 95%; CI: 1.07–2.84).
Comorbidities associated with acromegaly differed by sex in Korean subjects. High malignancy and mortality risk should be considered in female patients when managing acromegaly in Korea.
Acromegaly is a rare endocrine disease caused by the excessive secretion of growth hormone (GH), which increases the production of insulin-like growth factor 1 (IGF-1), mostly in the liver. Both GH and IGF-1 promote the growth of many tissues and impair metabolic organs, resulting in glucose intolerance and diabetes mellitus (DM), hypertension, left ventricular hypertrophy, arteriosclerosis, valve disease, arrhythmia, cardiovascular diseases, and a shortened average life span (1). Overall, the standardized mortality ratio (SMR) of acromegaly is between 1.5 and 2.5 (2–4), with the main contributors to increased mortality being cardiovascular disease, metabolic impairment, and malignancies.
Although acromegaly-associated comorbidities can develop directly via hypersecretion of GH/IGF-1, they are representative categories of a multifactorial disease, and differences in diet and race can significantly influence the development of comorbidities. Previous reports on acromegaly-associated comorbidities are based on data from Western countries, mostly from Europe and the United States (4–6). In Asian countries, including Korea, there are no reports on the prevalence, characteristics, and consequences of such complications in patients with acromegaly.
Single-center or multicenter studies are not sufficient to study an extremely rare disease such as acromegaly and may result in selection bias attributable to the small number of patients enrolled. Fortunately, a national database exists, which is useful to study the epidemiology of these extremely rare diseases in South Korea. The National Health Insurance (NHI) claims database and the Korean Health Insurance Review and Assessment (HIRA) claims database include health-related data for all the population in South Korea and are managed by the government. The NHI and HIRA databases have been used for nationwide epidemiology studies for a variety of diseases from various medical fields (7–10). Consequently, these databases can provide reliable information regarding the epidemiology of acromegaly, which is not well known in Asia.
The aim of this study was to determine the incidence of acromegaly and the risk of acromegaly-related comorbidities compared to that in the general population in South Korea.
Materials and Methods
Data sources
We conducted a nationwide population-based study using the HIRA claims database. We analyzed the claims data obtained between January 2007 and December 2017.
The HIRA is an agency that is responsible for claim reviews and quality assessment of the NHI system (NHIS), which is a unique health care system in South Korea. The NHIS is a mandatory universal health insurance system that has covered the entire Korean population (> 50 000 000) since 1989. In 2011, the NHI started constructing a health information database; data of all claims since 2000 have been filed into the database. Medical institutions electronically submit health care utilization information such as admission, ambulatory care, and pharmaceutical services for reimbursement purposes; this information is integrated into the NHI claims database, thereby capturing all health care use in South Korea. Health Insurance and Review Assessment claims data are collected when medical providers submit a claim for NHI reimbursement for medical services provided to patients. The HIRA database, like the NHI database, also includes patient records regarding sex, age, diagnoses, treatments, and prescriptions. In addition, the government of South Korea initiated the Rare Intractable Disease (RID) program in 2009 in an effort to reduce the cost burden within the NHI scheme. This program offers a co-payment reduction up to 10% for 138 rare intractable diseases, including acromegaly. Based on the medical environment in Korea, all Korean acromegaly patients are treated with the support of the NHIS. Therefore, data on the medical use of all acromegaly patients are being stored in the NHIS or RID databases, and their information is being captured in the HIRA database.
Incidence analysis of acromegaly
Patients with acromegaly were defined as those who used medical services more than once with the diagnostic codes for acromegaly (E22.0) of the International Classification of Diseases, 10th Revision (ICD-10). The analysis period for acromegaly incidence was restricted to 2010–2013 to secure a sufficient observation period for the occurrence of acromegaly-related comorbidities. Between January 2010 and December 2013, there were 5497 patients with a diagnostic code for acromegaly reported to the NHIS. To select the incident cases of acromegaly, we selected patients who underwent acromegaly-related treatment (medical therapy, operation, or radiotherapy) within 2 years of the first medical claim for acromegaly (n = 1374). Among the 1374 patients selected as acromegaly patients, we set a 3-year washout period to exclude patients who were diagnosed in the past. A total of 656 patients were excluded in the incidence analysis, resulting in the inclusion of 718 patients in the final analysis as newly diagnosed acromegaly patients (Fig. 1).

Study framework (1). A total of 718 patients who were newly diagnosed with acromegaly between January 2010 and December 2013 were assigned to the acromegaly group. The control group representing the general population was randomly selected from those who had undergone appendectomy without a diagnosis of acromegaly during the same period. Ten age- and sex-matched controls per acromegaly patient were selected (n = 7180). We compared the incidence and risk of comorbidities such as diabetes mellitus, heart failure, malignancy, and mortality between the acromegaly group and the control group.
Comparison of acromegaly-related comorbidities
We compared the incidence and risk of comorbidities such as DM, heart failure (HF), malignancy, and mortality between patients with acromegaly and the general population. For the comparison, we set-up the control group to represent the general population. As shown in Fig. 1, we randomly selected subjects who had undergone appendectomy without a diagnosis of acromegaly during the same period as the control group. Ten age- and sex-matched controls per acromegaly patient were selected (n = 7180). The method to establish the control group was based on a previous study that used the same data source (11). Considering both the analyzable period within the HIRA database and the analyzed period of incidence, we set the observation period for the occurrence of comorbidities as 2 years before the index date until December 2017, the maximum date for observation. According to the characteristics of comorbidities, the prevalence of DM and HF was compared, while for malignancy, the incidence was compared.
Comparison of the incidence and risk of malignancy
Patients with malignancy were defined as those who were admitted to the hospital with the ICD-10 code for cancer (C00-C97). We first extracted cases who used medical services with a corresponding diagnostic ICD-10 code for malignancy from 2007. To analyze the incidence rate of malignancy during the observation period, we set a 1-year washout period and excluded pre-existing malignancy before the observation period.
The cumulative incidence was investigated 2 years before the index date until December 2017 in order to observe the incidence of malignancy for as long as possible. Risk of malignancy was estimated via a Cox proportional hazard analysis that was limited to 2 years before and after the index date, which is a common observation period in all incident cases. The period of hazard ratio (HR) analysis was divided into 3 categories based on the index date: prediagnostic period (1–2 years before index date), peridiagnostic period (6 months before and after diagnosis), and postdiagnostic period (1–2 years after diagnosis). The prediagnostic period was set to confirm the impact of exposure to GH excess before acromegaly diagnosis. The postdiagnostic period was set to determine whether the risk of comorbidity changes after the treatment for GH excess. The peridiagnosis period was set to consider the screening effect. The HR was also compared according to sex and age between two groups. We described the detailed study design for the incidence and HR analysis for malignancy in Fig. 2.
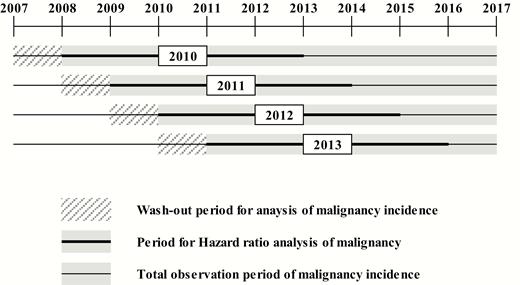
Schematic for the incidence and hazard ratio (HR) analysis of malignancy. The cumulative incidence of malignancy was observed from 2 years before the index date until December 2017. To exclude those who had such malignancy before the observation period, patients who had corresponding diagnostic ICD-10 codes for comorbidities 2 to 3 years before the index date were washed out. The period for hazard ratio (HR) analysis was limited to 2 years before and after the index date during the entire observation period, which is a common observation period in all incident cases.
Comparison of the prevalence of DM and HF
Patients with DM were defined as those who had claim records with the ICD-10 code for type 2 DM (E11.0–11.9) more than once in the year. Patients with HF were defined as those who used medical services with the ICD-10 code for HF (I50) more than once in the year.
The prevalence of DM and HF were investigated over the 2-year period before and after the index date (overall period). The prevalence of DM and HF in the prediagnostic period was analyzed separately to confirm the impact of exposure to GH excess before acromegaly diagnosis and to remove the screening effect.
Comparison of the mortality
Mortality was defined using the national statistics for death. Mortality in patients with acromegaly and in the control group was analyzed from the index date to the day when follow-up was possible. The cumulative incidence of mortality was observed from the index date to December 2017, and HR for mortality was analyzed.
Statistical analyses
Incidence rates for acromegaly are presented as the number of cases per 1 000 000 person-years and 95% confidence interval (CI). Incidence estimates are stratified by sex, age (<39, 40–49, 50–59, and ≥60 years of age), and diagnosis year. Cumulative incidence curves of malignancy are presented to show differences in the incidence of malignancy between 2 groups. Risk of malignancy was estimated via a Cox proportional hazard analysis, and the HR is presented for the overall period and according to the time period (pre, peri, and postdiagnostic period). Categorical variables are presented as numbers and percentages, and continuous variables as mean ± standard deviations. A chi-square test or Fisher’s exact test was used for the comparison of categorical variables. The results were considered statistically significant if P < 0.05. All statistical analyses were performed using R 3.2.2 (R Development Core Team; R Foundation for Statistical Computing, Vienna, Austria).
Ethics statement
The Institutional Review Board of the Yonsei University Hospital approved the study protocol (IRB # 4-2019-0053), and the study was conducted in accordance with the Declaration of Helsinki. Requirement for informed consent was waived by the board.
Results
Characteristics of patients with acromegaly
From 2010 to 2013, 718 patients (311 males and 407 females) were diagnosed with acromegaly. The male to female ratio was 1:1.3. The mean age at diagnosis was 46.0 (total), 43.5 (male), and 47.9 (female) years. Of the 718 patients with acromegaly, 85.5% of the patients (n = 614) received surgery and 21.9% of the patients (n = 157) were treated with somatostatin receptor ligands (SRL) or radiation therapy in addition to surgery. Most surgeries were performed using the trans-sphenoidal approach (n = 601). Detailed patient characteristics are described in Table 1.
Baseline characteristics of acromegaly (2010–2013)
| Value | % | |
|---|---|---|
| Total | 718 | – |
| Sex | ||
| Male | 311 | 43.3 |
| Female | 407 | 56.7 |
| Age (years, mean ± SD) | ||
| Total | 46.0 ± 12.9 | |
| Male | 43.5 ± 12.6 | |
| Female | 47.9 ± 12.8 | |
| Age group (years) | ||
| Total | ||
| <39 | 225 | 31.3 |
| 40–49 | 204 | 28.4 |
| 50–59 | 185 | 25.8 |
| ≥60 | 104 | 14.5 |
| Male | ||
| <39 | 117 | 37.6 |
| 40–49 | 92 | 29.6 |
| 50–59 | 69 | 22.2 |
| ≥60 | 33 | 10.6 |
| Female | ||
| <39 | 108 | 26.5 |
| 40–49 | 112 | 27.5 |
| 50–59 | 116 | 28.5 |
| ≥60 | 71 | 17.4 |
| Treatment | ||
| Surgery (TSA + open) | 614 | 85.5 |
| Somatostatin Analogues | 236 | 32.9 |
| Radiation | 55 | 7.7 |
| Days from diagnosis to treatment (median [IQR]) | ||
| Surgery (TSA + open) | 53 (24–104) | |
| Somatostatin analogues | 124 (35–286) | |
| Radiation | 333 (162–443) |
Abbreviations: IQR, interquartile range; SD, standard deviation; TSA, trans sphenoidal approach.
Malignancies occurred in 61 patients (8.5%). The most common malignancy was thyroid cancer, and the second most common malignancy was colorectal cancer (Table 2). All thyroid and colorectal cancers were diagnosed during the peridiagnosis and postdiagnosis periods but not during the prediagnosis period. During follow up, 31 patients died in the acromegaly group. The mean age at diagnosis, the proportion of patients who did not receive surgical resection, and the proportion of patients with comorbidities, such as HF and malignancy, were significantly higher in patients who died than in survivors (Table 3).
Frequency of malignancies in patients with acromegaly and control group
| Acromegaly Group | Control Group | |||||||||||
|---|---|---|---|---|---|---|---|---|---|---|---|---|
| Total | Male | Female | Total | Male | Female | |||||||
| n = 718 | (%) | n = 311 | (%) | n = 407 | (%) | n = 7180 | (%) | n = 3110 | (%) | n = 4070 | (%) | |
| Total cancer | 61 | 13 | 48 | 223 | 63 | 160 | ||||||
| Thyroid | 38 | 62.3 | 7 | 53.8 | 31 | 64.6 | 39 | 17.5 | 6 | 9.5 | 39 | 24.4 |
| Colorectal | 5 | 8.2 | 1 | 7.7 | 4 | 8.3 | 23 | 10.3 | 18 | 28.6 | 23 | 14.4 |
| Breast | 3 | 4.9 | 0 | 0.0 | 3 | 6.3 | 12 | 5.4 | 0 | 0.0 | 12 | 7.5 |
| Cervix | 3 | 4.9 | 0 | 0.0 | 3 | 6.3 | 3 | 1.3 | 0 | 0.0 | 3 | 1.9 |
| Unspecified | 2 | 3.3 | 0 | 0.0 | 2 | 4.2 | 1 | 0.4 | 0 | 0.0 | 1 | 0.6 |
| Bile duct | 1 | 1.6 | 1 | 7.7 | 0 | 0.0 | 0 | 0.0 | 1 | 1.6 | 0 | 0.0 |
| Pancreas | 1 | 1.6 | 0 | 0.0 | 1 | 2.1 | 0 | 0.0 | 1 | 1.6 | 2 | 1.3 |
| Lung | 1 | 1.6 | 1 | 7.7 | 0.0 | 0 | 0.0 | 2 | 3.2 | 3 | 1.9 | |
| Bone | 1 | 1.6 | 0 | 0.0 | 1 | 2.1 | 0 | 0.0 | 0 | 0.0 | 0 | 0.0 |
| Connected tissue | 1 | 1.6 | 1 | 7.7 | 0 | 0.0 | 0 | 0.0 | 0 | 0.0 | 5 | 3.1 |
| Uterus | 1 | 1.6 | 0 | 0.0 | 1 | 2.1 | 0 | 0.0 | 0 | 0.0 | 7 | 4.4 |
| Prostate | 1 | 1.6 | 1 | 7.7 | 0 | 0.0 | 0 | 0.0 | 3 | 4.8 | 0 | 0.0 |
| Spinal cord | 1 | 1.6 | 0 | 0.0 | 1 | 2.1 | 0 | 0.0 | 0 | 0.0 | 1 | 0.6 |
| Non-Hodgkin’s lymphoma | 1 | 1.6 | 1 | 7.7 | 0 | 0.0 | 0 | 0.0 | 0 | 0.0 | 1 | 0.6 |
| Multiple myeloma | 1 | 1.6 | 0 | 0.0 | 1 | 2.1 | 0 | 0.0 | 2 | 3.2 | 0 | 0.0 |
Clinical characteristics of patients with acromegaly who died
| Total | Died | Survived | P-value | |
|---|---|---|---|---|
| No. of patients | 718 | 31 | 687 | |
| Sex | 0.712 | |||
| Male | 311 | 12 (3.9%) | 299 (96.1%) | |
| Female | 407 | 19 (4.7%) | 388 (95.3%) | |
| Age (years, mean ± SD) | 46.0 ± 12.9 | 55.6 ± 15.4 | 45.6 ± 12.6 | 0.001 |
| Age group (yrs) | <0.001 | |||
| <39 | 225 | 6 (2.7%) | 219 (97.3%) | |
| 40–49 | 204 | 4 (2.0%) | 200 (98.0%) | |
| 50–59 | 185 | 6 (3.2%) | 179 (96.8%) | |
| ≥60 | 104 | 15 (14.4%) | 89 (85.6%) | |
| Presence of comorbidities during the observation period (2007–2017) | ||||
| Diabetes mellitus | 0.440 | |||
| No | 470 | 18 (3.8%) | 452 (96.2%) | |
| Yes | 248 | 13 (5.2%) | 235 (94.8%) | |
| Heart failure | <0.001 | |||
| No | 656 | 22 (3.4%) | 634 (96.6%) | |
| Yes | 62 | 9 (14.5%) | 53 (85.5%) | |
| Malignancy | <0.001 | |||
| No | 641 | 21 (3.3%) | 620 (96.7%) | |
| Yes | 77 | 10 (13.0%) | 67 (87.0%) |
Abbreviation: SD, standard deviation.
Incidence rate of acromegaly
The mean annual incidence rate of acromegaly from 2010–2013 was 3.57 cases/106 persons. The incidence rate among females was higher than that among males (4.06 cases/106 persons vs. 3.09 cases/106 persons). There were no significant differences between the years assessed. Sex differences in the incidence rate according to age were noted. The age at peak incidence rate was 40–49 years for males and 50–59 years for females (Fig. 3). Detailed patient numbers and incidence information by year and age group are provided in Table 4.
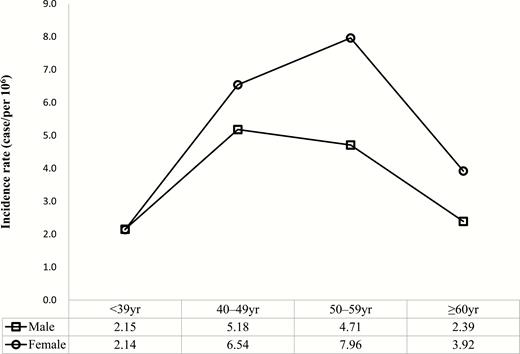
Incidence rate of acromegaly according to sex and age (2010–2013). The incidence rate was higher in females. Age groups showing peak incidence rates were found in 40–49-year-old males and 50–59-year-old females.
Incidence rate of acromegaly (2010–2013)
| Total | Male | Female | ||||||||
|---|---|---|---|---|---|---|---|---|---|---|
| No. | Population Denominator | Incidence Rate (95% CI) | No. | Population Denominator | Incidence Rate (95% CI) | No. | Population Denominator | Incidence Rate (95% CI) | ||
All Year | 718 | 50 223 891 | 3.57 (3.32–3.85) | 311 | 25 132 343 | 3.09 (2.76–3.46) | 407 | 25 091 548 | 4.06 (3.67–4.47) | |
| 2010 | 190 | 49 879 812 | 3.81 (3.29–4.39) | 86 | 24 977 164 | 3.44 (2.75–4.25) | 104 | 24 902 648 | 4.18 (3.41–5.06) | |
| 2011 | 184 | 50 111 476 | 3.67 (3.16–4.24) | 77 | 25 081 788 | 3.07 (2.42–3.84) | 107 | 25 029 688 | 4.27 (3.50–5.17) | |
| 2012 | 169 | 50 345 325 | 3.36 (2.87–3.90) | 67 | 25 187 494 | 2.66 (2.06–3.38) | 102 | 25 157 831 | 4.05 (3.31–4.92) | |
| 2013 | 175 | 50 558 952 | 3.46 (2.97–4.01) | 81 | 25 282 928 | 3.20 (2.54–3.98) | 94 | 25 276 024 | 3.72 (3.01–4.55) | |
| Age group (yrs) | <39 | 225 | 26 223 339 | 2.15 (1.93–2.51) | 117 | 13 584 221 | 2.15 (1.78–2.58) | 108 | 12 639 118 | 2.14 (1.75–2.58) |
| 40–49 | 204 | 8 723 664 | 5.85 (5.29–6.95) | 92 | 4 439 942 | 5.18 (4.18–6.35) | 112 | 4 283 722 | 6.54 (5.38–7.86) | |
| 50–59 | 185 | 7 306 515 | 6.33 (5.58–7.46) | 69 | 3 661 861 | 4.71 (3.67–5.96) | 116 | 3 644 654 | 7.96 (6.57–9.54) | |
| ≥60 | 104 | 7 970 374 | 3.26 (2.81–4.12) | 33 | 3 446 320 | 2.39 (1.65–3.36) | 71 | 4 524 053 | 3.92 (3.06–4.95) | |
Incidence rate is presented as cases/1 000 000.
Abbreviation: CI, confidence interval.
The incidence and the risk of malignancy in acromegaly
As shown in Fig. 4, more malignancies occurred in the acromegaly group. The rise in the incidence curve in females before the diagnosis was sustained after diagnosis throughout the entire observation period and showed the high incidence of malignancies in the acromegaly group.
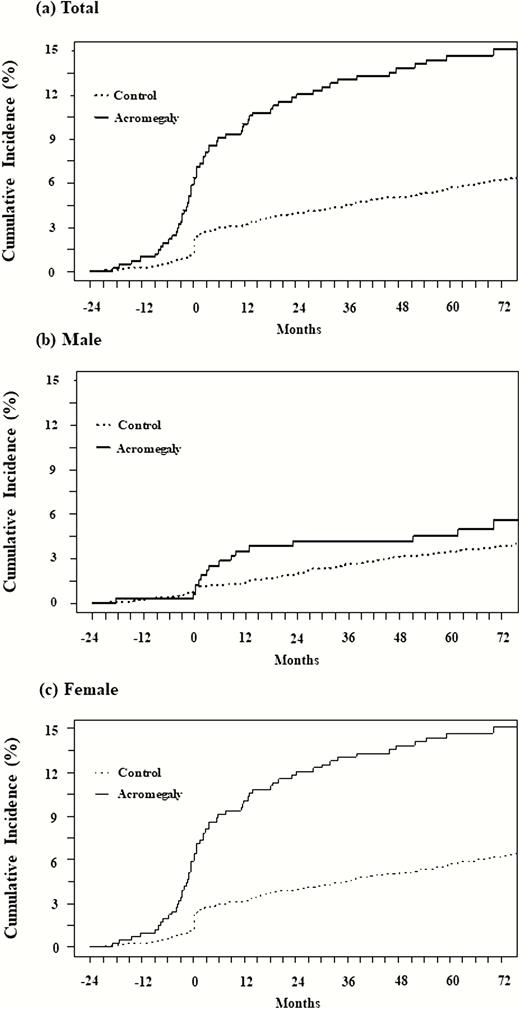
Cumulative incidence (%) of malignancy. The cumulative incidence (%) of malignancy in the acromegaly group (solid line) and control group (dotted line) is expressed according to sex. A, total; B, male; and C, female. More malignancies occurred in the acromegaly group. The incidence curve in females began to rise before diagnosis sustained after diagnosis throughout the entire observation period.
The HR for malignancy was increased and more pronounced in female patients in the acromegaly group; the HR in females and males was 3.14 (95% CI: 2.28–4.34) and 2.28 (95% CI: 1.14–3.78), respectively (Fig. 5A). Females showed high HR from the prediagnostic period, which was sustained until the postdiagnostic period; however, males showed high HR in the peridiagnostic period only. To determine the effect of age on the risk of malignancy, HR analysis was conducted based on an age cut-off of 50 years (Fig. 5B). In both age groups, the overall HR was statistically higher in the acromegaly group. The malignancy risk was significantly higher in the group under 50 years, but not in the group over 50 years in the prediagnosis period. Contrarily, in the postdiagnostic period, the malignancy risk was significantly higher in the group over 50 years, but not in the group under 50 years.
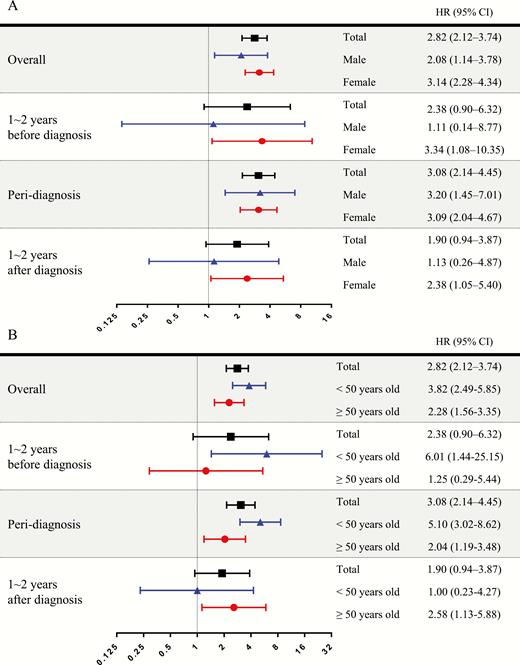
Risk of malignancy in acromegaly. Hazard ratios (HRs) are analyzed and presented as forest plots according to sex and age group. The period of HR analysis was divided into 3 categories based on the index date: prediagnostic period (1–2 years before index date), peridiagnostic period (6 months before and after diagnosis), and pos-diagnostic period (1–2 years after diagnosis). The HR for malignancy increased and was more pronounced in female patients with acromegaly. The HR in the prediagnosis period was higher in the group under 50 years, but not in the group over 50 years.
The prevalence of DM and HF in acromegaly
In the overall period, patients with acromegaly had a higher prevalence of DM compared to the general population (54.5% vs. 15.1%, P < 0.001), and the differences were more pronounced in the younger age group. In the prediagnostic period, the overall prevalence of DM was already higher in the acromegaly group than that in the general population (30.5% vs. 8.6%, P < 0.001) and was more pronounced in females and the younger age groups.
The prevalence of HF in the acromegaly group was also higher than that in the control group, not only in the overall period (5.6% vs. 2.6%, P < 0.001) but also in the prediagnostic period (3.1% vs. 1.2%, P < 0.001). The prevalence of HF was not different according to sex.
Detailed patient numbers and prevalence information of DM and HF are provided in Table 5.
Prevalence of diabetes mellitus and heart failure in patients with acromegaly
| Diabetes Mellitus | Heart Failure | |||||||||
|---|---|---|---|---|---|---|---|---|---|---|
| Acromegaly Group (n = 718) | Control Group (n = 7180) | P-value | Acromegaly Group (n = 718) | Control Group (n = 7180) | P-value | |||||
| n | (%) | n | (%) | n | (%) | n | (%) | |||
| Overall period (2 years before and after the index date) | ||||||||||
| Total | 391 | 54.5% | 1083 | 15.1% | <0.001 | 40 | 5.6% | 184 | 2.6% | <0.001 |
| Sex | ||||||||||
| Male | 159 | 51.1% | 456 | 14.7% | <0.001 | 17 | 5.5% | 63 | 2.0% | <0.001 |
| Female | 232 | 57.0% | 627 | 15.4% | <0.001 | 23 | 5.7% | 121 | 3.0% | 0.006 |
| Age group (yrs) | ||||||||||
| <39 | 93 | 41.3% | 92 | 4.1% | <0.001 | 9 | 4.0% | 9 | 0.4% | <0.001 |
| 40–49 | 99 | 48.5% | 237 | 11.6% | <0.001 | 3 | 1.5% | 27 | 1.3% | 0.7498 |
| 50–59 | 117 | 63.2% | 410 | 22.2% | <0.001 | 16 | 8.6% | 49 | 2.6% | <0.001 |
| ≥60 | 82 | 78.8% | 344 | 33.1% | <0.001 | 12 | 11.5% | 99 | 9.5% | 0.624 |
| Pre-diagnostic period (1–2 years before index date) | ||||||||||
| Total | 219 | 30.5% | 615 | 8.6% | <0.001 | 22 | 3.1% | 88 | 1.2% | <0.001 |
| Sex | ||||||||||
| Male | 80 | 25.7% | 263 | 8.5% | <0.001 | 11 | 3.5% | 31 | 1.0% | <0.001 |
| Female | 139 | 34.2% | 352 | 8.6% | <0.001 | 11 | 2.7% | 57 | 1.4% | 0.066 |
| Age group (yrs) | ||||||||||
| <39 | 37 | 16.4% | 40 | 1.8% | <0.001 | 4 | 1.8% | 4 | 0.2% | 0.003 |
| 40–49 | 45 | 22.1% | 117 | 5.7% | <0.001 | 1 | 0.5% | 11 | 0.5% | >0.999 |
| 50–59 | 80 | 43.2% | 249 | 13.5% | <0.001 | 9 | 4.9% | 21 | 1.1% | <0.001 |
| ≥60 | 57 | 54.8% | 209 | 20.1% | <0.001 | 8 | 7.7% | 52 | 5.0% | 0.345 |
Mortality in acromegaly
In the Cox proportional hazard analysis, the overall HR for mortality was statistically higher in the acromegaly group (HR 1.65, 95% CI: 1.13–2.41, P = 0.01), and the risk of mortality was significant in females (HR 1.75, 95% CI: 1.07–2.84, P = 0.025), but not in males (HR 1.51, 95% CI: 0.83–2.78, P = 0.18) (Fig. 6).

Risk of mortality in acromegaly. Hazard ratios (HRs) are analyzed according to sex from the index date to the day when follow-up was possible. Overall HR for mortality was statistically high in the acromegaly group and significant in females.
Discussion
This study is the first nationwide population-based study to accurately estimate the incidence rate, risk of comorbidities, and mortality associated with acromegaly in East Asia, especially Korea. We showed similar incidence rates of acromegaly in Korea to those in Western countries (6, 12). We found an elevated risk of malignancy and mortality, especially in females, and a significantly high prevalence of DM and HF in patients with acromegaly. The prevalence and risk of acromegaly-related comorbidities were already increased in the preperiod of acromegaly diagnosis.
Our study has several strengths. First, we used HIRA claims data that included all the population in South Korea; therefore, the accuracy of this study is expected to be higher than that of single-center or multicenter studies. Because acromegaly is rare, only nationwide surveys can provide adequate statistical power. Secondly, our study differs from previous population-based studies in that we analyzed the risk of comorbidities not only in the postperiod but also in the preperiod of diagnosis in patients with acromegaly. Although GH excess started many years before the diagnosis of acromegaly, most previously reported population-based studies analyzed the risk of comorbidities only in the postperiod of acromegaly diagnosis. In addition, the study period took place after SRLs were introduced; therefore, this study reflects current epidemiology data in contrast to studies analyzing complications before SRL use, which is the strength of this study.
In this study, the incidence rate of acromegaly was 3.57 cases/106 persons from 2010 to 2013. Although we used a claims database and defined acromegaly according to the operational definition, our incidence data are similar to the results from a recent multicenter study in Korea (3.8–4.1 cases/106 persons in 2003–2007) that used medical records and was based on the academic definition of acromegaly (13). Consequently, the operational definition for acromegaly in this study is appropriate. Recently, Western studies using population-based databases reported incidence rates of acromegaly that are not significantly different from the results of the present study. In an Italian study conducted between 2012 and 2016, the overall incidence rate was 5.3 cases/106 persons (95% CI: 4.2–6.7) (14), with a mean age at diagnosis of 50.9 years. In a study in Denmark conducted from 1991 to 2010, the annual incidence rate was 3.8 cases/106 persons (95% CI: 3.6–4.1) and mean age at diagnosis was 48.7 years (95% CI: 47.2–50.1) (15).
Evaluating and interpreting cancer risk in acromegaly is very challenging, because many factors such as differences in the control population, database used, methodology, sample size, study period, as well as changes and effectiveness of acromegaly treatments may influence the results. In a population-based series of studies documenting standardized incidence ratios (SIRs), cancer risk increased in 5 studies (SIR, 1.5 to 3.4) (16–20), but did not increase in 3 studies (21–23). A recent meta-analysis of cancer SIRs from 23 studies yielded an SIR for overall cancer of 1.5 (95% CI: 1.2–1.8) (24). Our result on the elevated risk of malignancy is in line with that from previous studies. An interesting point in our study was that we analyzed the risk in the preperiod of acromegaly diagnosis. Previous studies that analyzed the risk of malignancy analyzed only the postperiod of acromegaly diagnosis. In addition, we observed a pronounced risk in female patients with acromegaly. The malignancy risk in females was elevated during all periods, but the risk was elevated only in the peridiagnostic period in males. While an elevated risk in the peridiagnostic period may reflect a screening effect, elevated risk in the period before diagnosis does not. Because the mean age of female patients was higher than that of males, we conducted HR analyses based on an age of 50 years and concluded that the higher mean age of female patients might have underestimated the HR but not overestimated it. Until now, two previous studies showed an increased malignancy risk in females (25, 26). The high risk of malignancy in females may be due to the delayed diagnosis and sustained exposure to GH. In the Liege Acromegaly Survey Database of 14 European countries, female patients showed a significantly longer delay before diagnosis (27). A French registry also showed delayed diagnosis in female patients (5).
In this study, we found that the overall prevalence of DM during the observation period was 54.5% in patients with acromegaly, higher than in the general population. We also showed that the prevalence of DM was already increased prior to the diagnosis of acromegaly (30.5% vs. 8.6%). Previous studies have shown that the prevalence of DM is higher in patients with acromegaly (28–30), and the reported prevalence of DM ranged from 16% to 56% (31, 32). Various factors may contribute to this difference, including the study region and the methodology used to diagnose DM. Excessive GH affects insulin sensitivity and gluconeogenesis, which can alter pancreatic beta-cell function in many patients with acromegaly, leading to a derangement in glucose metabolism (31). Given the positive correlation between excessive GH and the incidence of DM, the risk for DM is thought to differ after acromegaly treatment.
Our result and previous studies indicate that DM is initiated and influenced by exposure to high levels of GH before acromegaly diagnoses.
In this study, we observed a higher prevalence of HF in patients with acromegaly, and showed that the prevalence of HF had been higher before the diagnosis of acromegaly. A recent Western study reported that the risk of HF was higher in acromegaly than in the general population (HR 2.5, 95% CI: 1.6–2.6) (6). In addition to HF, various cardiovascular diseases occur frequently in patients with acromegaly (27, 32–35). Chronic excess of GH and IGF-I secretion affects cardiac morphology and performance, resulting in biventricular concentric hypertrophy and HF. Metabolic abnormalities, such as DM, hypertension, and obstructive sleep apnea, also affect the occurrence of HF in acromegaly.
Acromegaly is associated with a 2- or 3-fold increase in mortality (36–38). However, recent studies have shown a lower mortality rate than past studies (2–4), and we also demonstrated that the mortality risk showed a less than 2-fold increase (HR 1.65, 95% CI: 1.13–2.41). Holdaway et al meta-analyzed 18 published studies by dividing data according to the published year, that is, before 1984 and after 1984. They observed that the SMR decreased from 2.2 (95% CI: 1.8–2.8) to 1.3 (95% CI: 1.1–1.6) (3). Another meta-analysis reviewing acromegaly mortality in 16 studies from 1970 to 2005 showed that SMRs are lower in studies published after 1995 than in studies published before 1995 (1.62 and 2.11, respectively) (2). The study subjects in this study were all diagnosed after 2010, so that the risk seems to be not much higher.
Our study has several limitations. First, we could not consider the effect of treatment status on the risk of comorbidities. The database used in this study is a claims database rather than a medical records database, and we could not confirm the laboratory results such as hormone levels; this is a common and major limitation of studies using health administrative databases. The second limitation was the short observation period for comorbidities. As the HIRA database did not contain information prior to 2007 under the Privacy Act, we could not fully observe comorbidity events during the prediagnosis period in patients with acromegaly. As acromegaly is generally diagnosed more than 10 years after the onset of excessive GH levels, an accurate assessment of risk requires an observation period of at least 10 years. Fortunately, as NHIS and HIRA continue to accumulate claims data, we will be able to analyze long-term data for acromegaly in a follow-up study. Third, our study design likely underestimated the risk of comorbidities in patients with acromegaly. As the claims database does not include data from patients who died in the past, only nonfatal events before the diagnosis were analyzed. In addition, we limited the observation period for the occurrence of comorbidities to only 2 years before the index date, although the effect of GH excess appeared several years prior to diagnosis. Therefore, this study might have underestimated the risk of comorbidity, but not overestimated it. Finally, the incidence rate and prevalence rate in this study did not reflect the actual rates associated with the disease nor the real health status of patients with acromegaly because they were extrapolated from claims data.
In conclusion, comorbidities associated with acromegaly differed by sex in Korean subjects although the overall incidence was similar to that in Western populations. Specifically, females had a higher and more pronounced risk for and prevalence of malignancy and mortality than males. The therapeutic aim of acromegaly is to normalize the mortality caused by comorbidities, which are significantly influenced by sex, race, and lifestyle; therefore, determining the geographic epidemiology of comorbidities is essential to manage subjects with acromegaly. These data could be useful for the clinical application of the evaluation and management of acromegaly.
Acknowledgments
We would like to thank Editage (www.editage.co.kr) for English language editing.
Financial support: None.
Additional Information
Disclosure Summary: The authors have nothing to disclose.
Data Availability: All data generated or analyzed during this study are included in this published article or in the data repositories listed in the References section.
