


Abstract
Exercise training improves glycemic control and increases mitochondrial content and respiration capacity in skeletal muscle. Rodent studies suggest that training increases mitochondrial respiration in adipose tissue.
To assess the effects of endurance training on respiratory capacities of human skeletal muscle and abdominal subcutaneous adipose tissue and to study the correlation with improvement in insulin sensitivity.
Using high-resolution respirometry, we analyzed biopsies from 25 sedentary (VO2 peak 25.1 ± 4.0 VO2 mL/[kg*min]) subjects (16 female, 9 male; 29.8 ± 8.4 years) with obesity (body mass index [BMI] 31.5 ± 4.3 kg/m2), who did not have diabetes. They performed a supervised endurance training over 8 weeks (3 × 1 hour/week at 80% VO2 peak).
Based on change in insulin sensitivity after intervention (using the Matsuda insulin sensitivity index [ISIMats]), subjects were grouped in subgroups as responders (>15% increase in ISIMats) and low-responders. The response in ISIMats was correlated to a reduction of subcutaneous and visceral adipose tissue volume. Both groups exhibited similar increases in fitness, respiratory capacity, and abundance of mitochondrial enzymes in skeletal muscle fibers. Respiratory capacities in subcutaneous adipose tissue were not altered by the intervention. Compared with muscle fibers, adipose tissue respiration showed a preference for β-oxidation and complex II substrates. Respiratory capacities were higher in adipose tissue from female participants.
Our data show that the improvement of peripheral insulin sensitivity after endurance training is not directly related to an increase in mitochondrial respiratory capacities in skeletal muscle and occurs without an increase in the respiratory capacity of subcutaneous adipose tissue.
Lifestyle and other environmental factors are considered to be the key drivers of the type 2 diabetes (T2D) epidemic (1). The 2 main factors in individual lifestyle that influence the risk for T2D development are nutrition and physical activity (2). High body fat content and low cardiorespiratory fitness are consequences of an overcaloric nutrition combined with a sedentary lifestyle. Both are important predictors of T2D. Thus, promoting physical activity with or without dietary restrictions can markedly reduce the risk to develop T2D (3-5). Exercise preserves peripheral insulin sensitivity in healthy persons and can even restore compromised insulin sensitivity in subjects with prediabetes (6).
Exercise research focuses mainly on skeletal muscle and its relevance for the beneficial effects of physical activity. In healthy individuals, skeletal muscle is responsible for the bulk of glucose disposal in response to insulin (7). T2D development often starts with a reduction of insulin-induced glucose uptake into skeletal muscle, which contributes to peripheral insulin resistance. Impaired mitochondrial function is discussed as contributing factor, but both the mechanism and the cause-effect relationship remain matters of debate (8, 9). In general, enhanced substrate uptake and oxidation in the skeletal muscle are considered to play an essential role in the improvement in insulin sensitivity and glucose control after exercise training (10, 11). Relevant and acknowledged adaptations involved in this metabolic benefit are the increases in muscle mass, capillarization, and mitochondrial content (12-14). Together with changes in mitochondrial protein composition, this results in an increased mitochondrial respiration, which can be measured ex vivo by high-resolution respirometry of skeletal muscle tissue biopsies (15). The improvement in insulin sensitivity after exercise training is paralleled by an increased abundance of transcripts and proteins of mitochondrial regulators and enzymes. This mitochondrial adaptation to exercise is less pronounced or absent in subjects who failed to improve their peripheral insulin sensitivity after an exercise intervention (16, 17). However, it has not been demonstrated that the increase in insulin sensitivity after exercise training is quantitatively correlated to the increase in mitochondrial respiration in skeletal muscle.
In addition to the effects on skeletal muscle, recent data suggest alterations in mitochondrial respiration in adipose tissue after exercise training, which likely contributes to the improvement of glycemic control, at least in rodents (18). Further studies in rodents demonstrate molecular adaptations in subcutaneous adipose tissue, such as enhanced expression of mitochondrial biogenetic factors, increased mitochondrial content and the development of a brown adipose tissue-like phenotype in white adipose tissue (19-21). However, these effects are less clear in humans and evidence that exercise training can alter insulin sensitivity or mitochondrial respiration of the adipose tissue is scarce. Long-term endurance training was reported to improve adipose tissue insulin sensitivity (22, 23), to upregulate respiratory chain markers (23-25), and to induce genome-wide changes in DNA methylation pattern in adipose tissue (26). A recent study demonstrates a higher abundance of respiratory chain proteins and enzymes of lipid metabolism in adipose tissue of endurance-trained compared to untrained humans (27). Collectively, exercise training might increase mitochondrial respiration in subcutaneous adipose tissue, but the few studies investigating human adipose tissue biopsies before and after training could not demonstrate such a response (28-30).
In this study, we aimed to elucidate whether changes in mitochondrial respiration in skeletal muscle and subcutaneous adipose tissue reflect the improvement in whole-body insulin sensitivity after exercise training. Untrained subjects with overweight or obesity performed an 8-week supervised aerobic endurance training intervention. We analyzed mitochondrial respiration ex vivo in skeletal muscle fibers obtained from vastus lateralis muscle and in abdominal subcutaneous adipose tissue biopsies. Oral glucose tolerance tests (OGTTs) were performed to assess insulin sensitivity as Matsuda index (ISIMats) before and after the intervention. In addition, body fat distribution by magnetic resonance imaging and physical fitness were analyzed to assess the potential influence of these parameters on the change of peripheral insulin sensitivity after the training intervention.
Material and Methods
Study participants
Healthy, sedentary (<120 minutes of physical activity per week) individuals at high risk for T2D with at least one of the following risk factors (BMI >27 kg/m2, family history (first degree) of T2D, former gestational diabetes) were recruited. Twenty-six subjects met the study criteria and completed the study. After 1 dropout due to newly diagnosed autoimmune thyroiditis, 25 individuals were included for data analysis. For anthropometric data, see Table 1. Severe diseases were excluded by anamnesis including medication, monitoring routine laboratory parameters, electrocardiogram, and physical examination. All participants gave written informed consent, and the study protocol was approved by the ethics committee of the University of Tübingen and was in accordance with the declaration of Helsinki. The study was registered at Clinicaltrials.gov as trial number NCT03151590.
Anthropometrics, Performance, and Insulin Sensitivity of Included Subjects
| Parameter | Pre | Post 8-week | P value |
|---|---|---|---|
| Sex | 16 female / 9 male | - | |
| Age, years | 29.8 ± 8.4 | 29.9 ± 8.3 | - |
| Height, cm | 170.3 ± 9.9 | - | |
| Body mass, kg | 91.6 ± 16.2 | 90.7 ± 16.5 | 0.030 |
| BMI, kg/m2 | 31.5 ± 4.3 | 31.2 ± 4.4 | 0.027 |
| Waist-to-hip ratio | 0.890 ± 0.059 | 0.884 ± 0.060 | >0.1 |
| Total AT volume, L | 39.89 ± 11.13 | 39.01 ± 11.17 | 0.005 |
| Subcutaneous AT, L | 15.10 ± 5.50 | 14.57 ± 5.70 | 0.008 |
| Visceral AT, L | 3.40 ± 1.62 | 3.27 ± 1.53 | 0.047 |
| AT: lower extremities, L | 16.22 ± 4.53 | 15.92 ± 4.61 | 0.067 |
| AT: femural head, L | 0.461 ± 0.123 | 0.443 ± 0.121 | 0.016 |
| Non-AT: lower extremities, L | 17.87 ± 4.09 | 18.16 ± 3.86 | 0.073 |
| IATergo/BM, W/kg | 1.11 ± 0.22 | 1.33 ± 0.26 | <0.001 |
| VO2peakergo/BM, mL/(kg*min) | 25.10 ± 4.01 | 26.97 ± 4.64 | 0.007 |
| Systolic BP, mm Hg | 133.5 ± 13.8 | 130.4 ± 15.3 | >0.1 |
| Diastolic BP, mm Hg | 88.4 ± 12.0 | 83.5 ± 11.4 | 0.045 |
| Glucose fasting, mmol/L | 5.11 ± 0.39 | 5.02 ± 0.38 | >0.1 |
| Glucose OGTT120 min, mmol/L | 5.68 ± 1.22 | 5.52 ± 1.56 | >0.1 |
| Insulin fasting, pmol/L | 105 ± 43 | 100 ± 37 | >0.1 |
| Insulin OGTT120 min, pmol/L | 545 ± 410 | 457 ± 347 | >0.1 |
| ISIMats | 8.71 ± 5.04 | 9.22 ± 4.55 | >0.1 |
| HbA1c, mmol/mol Hb | 34.3 ± 2.6 | 33.6 ± 2.6 | 0.068 |
Paired t tests or Wilcoxon signed rank tests when data were not normally distributed. N = 25, mean ± SD.
Abbreviations: AT, adipose tissue; BMI, body mass index; BP, blood pressure; IAT, individual aerobic threshold; BM, body mass; ergo, bicycle ergometer; ISI, insulin sensitivity index.
Study design
The participants performed an 8-week supervised aerobic endurance exercise intervention program as described below. Individual training intensity was set at 80% of VO2peak determined before the intervention and kept constant throughout the training program. Insulin sensitivity was assessed after an overnight fast by 75g-OGTTs at baseline and 5 days after the last exercise bout (blood sampling at timepoints 0, 30, 60, 90, and 120 minutes after glucose intake); blood samples for clinical routine parameters were obtained before the glucose load. Subcutaneous adipose tissue and vastus lateralis muscle biopsies were taken 60 minutes after end of the OGTT before and after the 8-week intervention. Two additional adipose tissue and skeletal muscle biopsies, which were used in the present study for respirometry, were taken 60 minutes after the first and last ergometer exercise bout of the 8-week intervention. 45 minutes before these exercise bouts, the participants had a standardized meal (1 bun, 20 g butter, 1 slice cheese, 150 g apple puree, water ad libitum).
Routine analysis and anthropometry
Clinical routine parameters were measured with an ADVIA 1650 clinical chemical analyzer and ADVIA Centaur immunoassay system (both Siemens Healthcare Diagnostics, Fernwald, Germany).The insulin sensitivity index was estimated from the OGTT by the method of Matsuda and DeFronzo (ISIMats) (31). Body fat mass and distribution were measured by magnetic resonance imaging (32). In brief, an axial T1-weighted fast spin-echo technique was applied on a 3T whole-body imager (Magnetom Vida, Siemens Healthineers, Erlangen, Germany). A set of 100 to 120 images were acquired from each participant in a measuring time of about 20 minutes. Subjects were in a prone position with extended arms. Segmentation of different adipose tissue compartments (subcutaneous adipose tissue, SCAT; visceral adipose tissue, VAT) and lean tissue (nonadipose tissue, ie, muscle and abdominal organs) was done by an automated procedure based on fuzzy-clustering (33) and the compartments were divided in 3 body-parts: lower extremities (feet to femoral head), abdomen (femoral head to humeri), and upper extremities (humeri to fingers).
Performance measurement and exercise intervention
To analyze physical fitness and to set the individual training intensity, all participants underwent cardiopulmonary exercise testing using an electromagnetically braked bicycle ergometer before and after the intervention (Excalibur Sport, Lode BV, Groningen, Netherlands). The incremental performance test started at a resistance of 50 watts (W) for male and 25 W for female participants and was increased by 25 W every 3 minutes. Participants cycled continuously until they were exhausted and no longer able to maintain cadence above 60 revolutions per minute (rpm). Blood samples (20 μL) were taken from the earlobe at rest and at the end of each 3-minute increment to determine lactate concentration at each workload. The capillary blood lactate concentration was determined using a stationary analyzer (Biosen S-Line by EKF Diagnostics, Barleben, Germany) and the individual anaerobic threshold (IAT) was calculated as the lactate concentration of 1.0 mmol/L above the lowest value of the lactate to performance ratio (34). Peak VO2 was defined as the mean VO2 over the last 20 seconds prior to cessation of exercise and assessed by metabolic gas analysis (MetaLyzer 3B and MetaMax 3B, Cortex Biophysics GmbH, Leipzig, Germany). The heart rate corresponding to 80% VO2peak was chosen as target heart rate for the following 8-week intervention and used to control exercise intensity. Each session consisted of 30 minutes of treadmill walking and 30 minutes of bicycle exercise.
Reagents
Unless stated otherwise, standard laboratory reagents were purchased in molecular biology grade from Sigma Aldrich (St. Louis, USA).
Biopsy collection
Muscle biopsies were obtained from the lateral part of vastus lateralis muscle. After local anesthesia (2% Scandicaine, Astra Zeneca, Wedel, Germany), skin, fat tissue, fascia, and the muscle epimysium were cut under sterile conditions using a scalpel, and a piece of muscle was removed using a Bergström needle (Pelomi Medical, Albertslund, Denmark) with suction. Adipose tissue biopsies were performed under sterile conditions after local anesthesia going back and forth lateral of the navel with a Menghini-needle (Hepafix, B. Braun, Melsungen, Germany). Wound treatment was done lege artis; in the case of muscle biopsies, a compression bandage was attached for at least 12 hours.
Sample preparation for high-resolution respirometry
For muscle tissue, single fibers were prepared under a binocular using extra-fine forceps in a drop of MIR05 (0.5 mM EGTA, 3 mM MgCl2(H2O)6, 60 mM K-lactobionate, 20 mM taurine, 10 mM KH2PO4, 20 mM HEPES, 110 mM sucrose, 1 g/L BSA, pH 7.1) on a chilled glass dish. Subsequently, fibers were permeabilized in saponin solution (50 µg/mL in MIR05) for 30 minutes at 4 °C while gently rocking and washed 3 times in MIR05 without saponin (10 minutes, 4 °C, gently rocking). For measurement, 2 mg of permeabilized and washed fibers were placed in the measurement chamber of an Oroboros Oxygraph 2k (Oroboros Instruments GmbH, Innsbruck, Austria). From adipose tissue, roughly 50 mg tissue were transferred to a reaction tube containing 700 µL MIR05 and minced with sharp scissors on ice. The minced tissue was then transferred to the measurement chamber and digitonin solution was added for permeabilization (final concentration 12 µM).
High-resolution respirometry
Respirometry was performed at 37 °C in an Oxygraph-2k. Oxygen concentration in the chamber (filled with 2 mL MIR05) was kept between 100 and 180 µM by aeration. Malate was added (1.28 mM), followed by octanoylcarnitine (0.5 mM; Tocris Bioscience, Bristol, UK), adenosine diphosphate (ADP; 2.5 mM; Merck Millipore, Burlington, USA), sodium pyruvate (5 mM), succinate (2.5 mM), and cytochrome c (10 µM). FCCP was titrated in 125 nM steps for muscle and 1 µM steps for adipose tissue. Lastly, rotenone (1.25 µM) and antimycin A (5 µM) were added. After each addition, the measurement was allowed to reach a plateau which was used for calculation of the flux rate. Non-mitochondrial oxygen consumption (after antimycin injection) was subtracted from all flux rates. Flux rates were normalized to tissue wet weight.
Protein extraction and quantification
After high-resolution respirometry, the chamber content was recovered and pelleted (20000g, 2 minutes, 4 °C). The supernatant was removed by suction and the pellet was frozen at −80 °C. For protein extraction, pellets were thawed on ice and 75 µL RIPA buffer (25 mM Tris, 150 mM NaCl, 0.1% SDS, 0.5% sodium desoxycholate, 1% Triton X100, pH 7.6, supplemented with Protease [cOmplete, Mini, EDTA-free, Roche, Basel, Switzerland] and phosphatase inhibitors [10 mM NaF, 5 mM Na4P2O7, 10 mM Na3VO4; 10 mM glycerol 2-phosphate]) and lysed by vigorous shaking (10 minutes, 4 °C). Afterwards, the sample was pelleted (20000g, 4 °C, 5 minutes) and the supernatant was recovered. Protein concentration of the supernatant was measured by BCA assay (Pierce BCA Protein Assay Kit, Thermo Fisher Scientific, Waltham, USA) and samples were stored at −80°C.
Immunoblotting
Lämmli sample buffer was added to samples and then heated to 50 °C for 5 minutes. Protein separation was performed by sodium dodecyl sulfate–polyacrylamide gel electrophoresis (SDS-PAGE; 5% stacking gel, 7.5%-15% resolving gradient gel), and transferred to polyvinylidene fluoride membranes by the semidry method (transfer buffer: 48 mM Tris, 39 mM glycine, 0.0375% SDS, and 20% (v/v) methanol). Gels contained 0.5% 2,2,2-trichloroethanol (TCE, Carl Roth, Karlsruhe, Germany) for total protein detection. Protein detection was carried out immediately after transfer before washing and blocking. TCE was activated by 45 seconds of light illumination followed by signal detection using the ChemiDoc Touch System (Bio-Rad, Hercules, USA). For blocking, washing, and antibody dilution, NETG buffer was used (150 mM NaCl, 50 mM Tris/HCl, pH 7.4, 5 mM EDTA, 0.05% Triton X-100, and 0.25% gelatin), except for the final 2 washes before detection, which were performed using TBST and TBS buffer. IRDye-labeled antibodies were used, and detection was carried out with the Odyssey imaging system (Li-COR Biosciences GmbH, Bad Homburg vor der Höhe, Germany). Antibodies used were total rabbit OXPHOS cocktail (ab110413, 1:500, Abcam, Cambridge, UK), citrate synthase (ab96600, Abcam, 1:1000), IRDye donkey-anti-rabbit 800LT (925–32213, Li-COR, 1:10000, +0.02% SDS), and IRDye donkey-anti-mouse 680LT (926–68022, Li-COR, 1:20000, +0.02% SDS). Apart from OXPHOS antibody incubation, which was done overnight at 4 °C, all incubations were performed for 2 hours at room temperature.
Measurement of adipocyte size
Adipose tissue biopsy material was paraffin-embedded, sliced, and the sections were stained with hematoxylin and eosin. Analysis of adipocyte size was done manually with Image J. Five to 10 pictures of each microscope slide were taken, and 8 adipocytes per picture were mapped.
Data analysis and statistics
For initial data collection, the manufacturer’s software of the respective devices was used: (Image Studio Lite 5.2, Li-COR), ImageLab (Bio-Rad), DatLab 7 (Oroboros instruments). Data were collected in Excel (Microsoft, Redmond, USA) which was used for normalization and other calculations. Furthermore, Excel was employed for t tests of respirometry and immunoblot data. GraphPad Prism 8 (GraphPad Software, San Diego, USA) was used for mixed-effect analysis. Linear regression models and anthropometric data were analyzed with R3.6.1/RStudio (The R Foundation, Vienna, Austria and RStudio Inc, Boston, USA). Normality was tested by Shapiro-Wilk test. Nonnormal data were log-transformed. Tests were performed using raw data or adequately transformed data. If no normal distribution was achieved, nonparametric tests were used. Tests used are indicated in the respective figure legends. Data in the main text, tables and figures represent mean ± standard deviation.
Results
Training increases fitness parameters and changes body mass and body composition
25 participants, 16 female and 9 male, completed the study and were included for data analysis (Table 1). Twenty-one of the 25 subjects underwent 20 sessions of training while the other 4 participants underwent 18, 19, 21, and 24 sessions. Twenty out of 25 subjects increased their aerobic threshold (IAT) by more than 10%, with an average increase of 20.7 ± 12.2% over all subjects (1.33 ± 0.26 vs 1.11 ± 0.21 W/kg; P < 0.001). The average increase in VO2peak was smaller but still significant (26.97 ± 4.64 vs 25.10 ± 4.01 mL/(kg*min); P = 0.007). Body mass and BMI were significantly decreased by approximately 1% (90.7 ± 16.5 vs 91.6 ± 16.2 kg; P = 0.030; 31.2 ± 4.4 vs 31.5 ± 4.3 kg/m2; P = 0.027). No significant change in waist-to-hip ratio was seen, but there was a significant decrease in adipose tissue volume by −2.3 ± 3.9% (P = 0.005). This was partly due to decreases in subcutaneous adipose tissue by −4.0 ± 7.1% (P = 0.008), visceral adipose tissue by −2.8 ± 13.6% (P = 0.047), and leg adipose tissue by −3.7 ± 8.0% (P = 0.016). Nonadipose tissue volume in leg tended to increase by 2.1 ± 4.8% (P = 0.073). While systolic blood pressure remained unchanged, diastolic blood pressure was significantly lower after the exercise intervention (83.5 ± 11.4 vs 88.4 ± 12.0 mm Hg; P = 0.045).
Individual response in metabolic parameters
In the cohort as a whole, no significant improvement in ISIMats was observed (Table 1). This was due to a large individual variance in the metabolic response. Fourteen subjects increased their ISIMats by more than 15% (designated “responders”), while 11 subjects showed almost no improvement or a decrease in insulin sensitivity (P < 0.0001; Fig. 1A and Table 2). Comparison of the responders in ISIMats with the low-responders revealed that both groups exhibited a comparable increase in the fitness parameters IAT and VO2peak (Table 2). Training volume (responders 20.3 ± 1.1 hours vs low-responders 19.8 ± 0.6 hours; P = 0.20; data not shown) and intensity (responders 0.38 ± 0.04 kJ/(kg*min) vs low-responders 0.38 ± 0.09 kJ/[kg*min]; P = 0.91; data not shown) were not different between groups. The groups showed a different response in waist-to-hip ratio, plasma insulin in the fasted state and 120 minutes after the glucose load in the OGTT, and a trend toward a different response in subcutaneous adipose tissue (Table 2). These parameters were decreased in the responders after exercise training, but not in the low-responders. When correlated to the change in ISIMats, the change in visceral adipose tissue followed the same trend as the change in subcutaneous adipose tissue (Fig. 1B,C). Next, we studied whether individual differences in the exercise training induced changes in mitochondrial respiration in skeletal muscle or adipose tissue are related to the different response in ISIMats and body fat.
Anthropometrics, Performance, and Insulin Sensitivity of Included Subjects Classified as Responders and Low-Responders
| Parameter | Pre | Post-8-week | Fold change Post/Pre | P value comparing fold change Post/Pre of RE and LRE | |||
|---|---|---|---|---|---|---|---|
| Group | RE | LRE | RE | LRE | RE | LRE | |
| Sex | 8f, 6m | 8f, 3m | - | - | - | - | - |
| Age, years | 29.0 ± 6.9 | 30.8 ± 10.2 | - | - | - | - | - |
| Height, cm | 171 ± 10 | 169 ± 10 | 171 ± 10 | 169 ± 10 | - | - | - |
| Body mass, kg | 91.0 ± 15.9 | 92.3 ± 17.4 | 89.7 ± 16.1 | 91.9 ± 17.6 | 0.98 ± 0.02 | 1.00 ± 0.03 | >0.1 |
| BMI, kg/m 2 | 31.0 ± 3.5 | 32.1 ± 5.2 | 30.5 ± 3.6 | 32.0 ± 5.3 | 0.98 ± 0.02 | 1.00 ± 0.03 | >0.1 |
| Waist-to-hip ratio | 0.90 ± 0.07 | 0.87 ± 0.04 | 0.89 ± 0.07 | 0.88 ± 0.05 | 0.99 ± 0.03 | 1.00 ± 0.02 | 0.0452 |
| Total AT volume, L | 38.5 ± 8.5 | 41.6 ± 14.0 | 37.3 ± 8.9 | 41.2 ± 13.7 | 0.96 ± 0.03 | 0.99 ± 0.04 | >0.1 |
| Subcutaneous AT, L | 14.6 ± 4.3 | 15.8 ± 6.9 | 13.7 ± 4.2 | 15.7 ± 7.2 | 0.94 ± 0.06 | 0.99 ± 0.07 | 0.051 |
| Visceral AT, L | 3.7 ± 1.8 | 3.1 ± 1.4 | 3.5 ± 1.7 | 3.0 ± 1.2 | 0.94 ± 0.12 | 1.01 ± 0.15 | >0.1 |
| AT lower extremities, L | 15.3 ± 3.8 | 17.4 ± 5.2 | 15.0 ± 4.1 | 17.2 ± 5.1 | 0.97 ± 0.05 | 0.99 ± 0.06 | >0.1 |
| AT femural head, L | 0.46 ± 0.11 | 0.47 ± 0.14 | 0.43 ± 0.10 | 0.45 ± 0.14 | 0.96 ± 0.10 | 0.97 ± 0.06 | >0.1 |
| Non-AT lower extremities, L | 18.0 ± 4.1 | 17.8 ± 4.2 | 18.3 ± 3.9 | 18.0 ± 4.0 | 1.02 ± 0.06 | 1.02 ± 0.04 | >0.1 |
| IAT ergo /BM, W/kg | 1.12 ± 0.20 | 1.08 ± 0.24 | 1.35 ± 0.26 | 1.30 ± 0.27 | 1.21 ± 0.15 | 1.20 ± 0.09 | >0.1 |
| VO 2 peak ergo /BM, mL/(kg*min) | 25.4 ± 0.3 | 24.7 ± 0.5 | 26.7 ± 0.4 | 27.3 ± 0.6 | 1.06 ± 0.12 | 1.13 ± 0.15 | >0.1 |
| Systolic BP, mm Hg | 134 ± 13 | 132 ± 15 | 129 ± 17 | 132 ± 14 | 0.96 ± 0.08 | 1.01 ± 0.18 | >0.1 |
| Diastolic BP, mm Hg | 88 ± 13 | 89 ± 11 | 82 ± 12 | 85 ± 11 | 0.95 ± 0.14 | 0.96 ± 0.16 | >0.1 |
| Glucose fasting, mmol/L | 5.09 ± 0.40 | 5.14 ± 0.40 | 5.08 ± 0.41 | 4.95 ± 0.34 | 1.00 ± 0.05 | 0.97 ± 0.06 | >0.1 |
| Glucose 120min, mmol/L | 5.96 ± 1.29 | 5.92 ± 1.09 | 5.37 ± 0.90 | 5.70 ± 2.18 | 0.93 ± 0.19 | 1.10 ± 0.48 | >0.1 |
| Insulin fasting, pmol/L | 120 ± 38 | 86 ± 42 | 96 ± 38 | 106 ± 38 | 0.81 ± 0.21 | 1.32 ± 0.31 | 0.0002 |
| Insulin 120min, pmol/L | 666 ± 454 | 392 ± 299 | 444 ± 321 | 474 ± 393 | 0.70 ± 0.28 | 1.29 ± 1.07 | 0.0028 |
| ISI Mats | 6.9 ± 3.1 | 11.0 ± 6.2 | 9.4 ± 4.4 | 9.0 ± 4.9 | 1.36 ± 0.23 | 0.83 ± 0.15 | <0.0001 |
| HbA 1c , mmol/mol Hb | 34.2 ± 3.0 | 34.4 ± 2.1 | 32.9 ± 3.0 | 34.4 ± 1.7 | 0.96 ± 0.06 | 1.00 ± 0.03 | 0.0651 |
Unpaired t tests or Wilcoxon signed rank tests when data were not normally distributed. Mean ± SD.
Abbreviations: AT, adipose tissue; BM, body mass; BMI, body mass index; BP, blood pressure; ergo, bicycle ergometer; IAT, individual aerobic threshold; ISI, insulin sensitivity index; LRE, low responder in ISIMats; RE, responder in ISIMats.
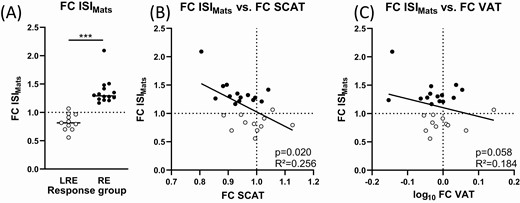
Individual response and relation to changes in adipose tissue compartments. (A) Subjects were grouped into low-responders (LRE, open circles) and responders (RE, filled circles) in ISI Matsuda Index (ISIMats). The fold change (FC) in ISIMats correlated with the change in (B) subcutaneous adipose tissue (SCAT) and (C) visceral adipose tissue (VAT). FC always denotes division of the value post-intervention by the pre-intervention value. Regression lines: GraphPadPrism. Statistics: Linear regression models, P values after adjusting for pre-intervention values of ISIMats, SCAT, and VAT. Nonnormally distributed data were log-transformed. N = 24-25. P values and R2 from linear models. Dotted lines denote a fold change of 1 / no change. *** P < 0.001.
Exercise increases mitochondrial respiration in skeletal muscle
Biopsies from the vastus lateralis skeletal muscle were used to investigate mitochondrial respiration in skeletal muscle fibers ex vivo by high-resolution respirometry (Fig. 2). Over all subjects, skeletal muscle oxygen consumption normalized to wet weight was higher after exercise training (Fig. 2A). Fatty acid oxidation capacity (FAO) was measured after addition of malate, octanoylcarnitine, and ADP and was 45% higher after training (P < 0.001). Proton leak oxygen flux measured before addition of ADP was at or near background flux (data not shown). Respiration and pyruvate and FAO combined was 45% higher after training (P = 0.01). This latter state is closest to the in vivo situation, where muscle can rely on both glycolysis and β-oxidation. Maximal coupled respiration (+Succ), total maximal uncoupled respiration (+FCCP), and complex II respiration (+Rot) also increased by 36%, 35%, and 31%, respectively (P = 0.003, 0.003, and 0.0099). The state after addition of succinate measures maximal oxidative phosphorylation (OXPHOS) capacity, while the state after FCCP addition measures electron transfer system capacity. The last 2 states are unlikely to be found in vivo but demonstrate that all complexes of the respiratory chain including adenosine triphosphate (ATP) synthase showed higher activity per tissue weight after training. When the individual changes in respiration were compared between responders and low-responders in ISIMats, no differences were observed (Fig. 2B), and mitochondrial respiration before and after exercise training was highly similar between the 2 groups (Fig. 2C,D).
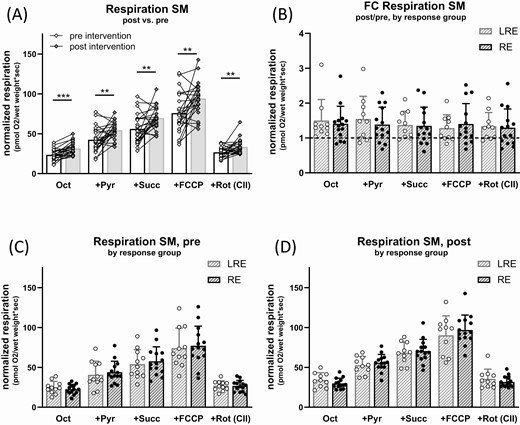
Effect of exercise intervention on respiration in skeletal muscle fibers. Muscle fibers were permeabilized and mitochondrial respiration was measured in presence of different substrates and inhibitors before and after intervention, always in presence of saturating malate and ADP. Substrates and inhibitors were added subsequently, thus “+Pyr” respiration is in presence of octanoylcarnitine (Oct), ADP, and malate. (A) Oxygen consumption per wet weight in skeletal muscle fibers (SM) pre (open diamonds) and post (filled diamonds) intervention. (B-D) Data from (A) grouped in low-responders (LRE, open circles) and responders (RE, filled circles) in ISIMats. (B) Fold change in oxygen consumption post- vs pre-intervention (dashed line: pre-intervention data set as 1), (C) oxygen consumption pre- and (D) post-intervention. Abbreviations: FCCP, carbonyl cyanide-p-trifluoromethoxyphenylhydrazone, uncoupling of respiration from ATP synthesis; Pyr, pyruvate; Rot, rotenone, inhibitor of complex I, leaving only complex II (CII) respiration active; Succ, succinate. Multiple paired t-tests, no correction for multiple comparisons. N = 24-25, mean ± SD, * P < 0.05, ** P < 0.01, *** P < 0.001. Where data were not normally distributed, unpaired 2-samples Wilcoxon test was used.
The muscle fibers were recovered after respirometry and analyzed for mitochondrial enzyme abundance by immunoblots (Fig. 3). Citrate synthase was increased by 34% (P = 0.0015). Likewise, markers of the different respiratory chain complexes were increased after training: SDHB, a marker for complex II abundance (P = 0.0014), UQCRC2, a marker for Complex III abundance (P = 0.0011), MTCO1, a marker for Complex IV (P = 0.0010), and ATP synthase, measured by the marker ATP5 (P = 0.0499). The 2 ISIMats response groups did not differ in increase or protein abundance before and after the intervention (Fig. 3B-3D). Immunoblot signals were normalized to loaded protein measured by TCE membrane staining. Normalization to protein loaded (by BCA assay) yielded essentially the same results (not shown). Together, these data indicate that the abundance of mitochondrial proteins per wet weight of muscle tissue was increased by training, which is likely a reason for the increase in mitochondrial respiration.
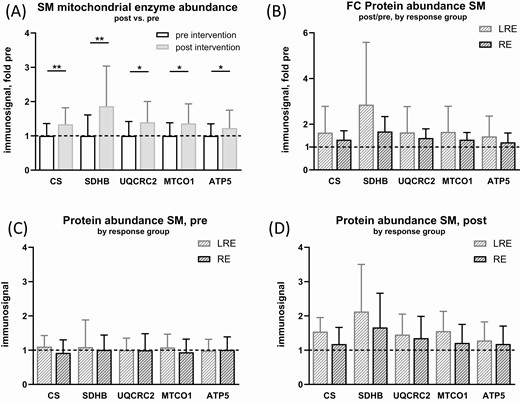
Effect of exercise intervention on mitochondrial enzyme abundance in skeletal muscle fibers. Fibers were recovered from respirometric chambers after measurement and protein extracts were generated. Immunoblot analysis was performed for mitochondrial key enzymes and signals were normalized to loaded protein measured by 2,2,2-trichloroethanol (TCE) membrane stain and standardized to the mean immunosignal of pre-intervention data (dashed lines). (A) mitochondrial enzyme immunosignal in skeletal muscle fibers (SM), comparison pre-intervention and post-intervention as fold change (FC) over pre-intervention. (B-D) Data from A) subdivided into low-responders (LRE) and responders (RE) in ISIMats. (B) Fold change post- vs pre-intervention, protein immunosignal, (C) pre- and (D) post-intervention. Multiple paired t-tests, no correction for multiple testing. N = 22-24, mean ± SD. *: P < 0.05, **: P < 0.01. Where data were not normally distributed, unpaired 2-samples Wilcoxon test was used.
No effect of exercise on adipose tissue mitochondrial respiration
Biopsies from abdominal subcutaneous adipose tissue were used to investigate ex vivo mitochondrial respiration in adipose tissue by high-resolution respirometry. Respiration in all states was approximately 50-fold lower in adipose tissue compared with muscle fibers when normalized to tissue mass (Fig. 2A and Fig. 4A). Over all subjects, no significant effect of the training intervention on respiration was detected (Fig. 4A). This was also the case when the 2 response groups were analyzed separately (Fig. 4B), and mitochondrial respiration before and after exercise training was highly comparable in responders and low-responders (Fig. 4C,D). Due to the poor recovery of the adipose tissue samples after respirometry, mitochondrial enzyme abundance was not analyzed. Histology data were available from 13 participants before and 16 participants after the intervention. We did not find a significant change in adipocyte size between pre/post intervention (60.2 ± 6.2 vs 57.7 ± 7.3µm; P = 0.3). Data for a paired analysis over time (mANOVA) were available from 10 participants, revealing also no difference upon time (P = 0.2).

Effect of exercise intervention on respiration in subcutaneous adipose tissue. Minced adipose tissue (AT) was permeabilized and mitochondrial respiration was measured in presence of different substrates and inhibitors before and after intervention. (A) Oxygen consumption per wet weight in individuals pre- (open diamonds) and post- (filled diamonds) intervention. Substrates and inhibitors were added subsequently, always in presence of ADP and malate, thus “+Pyr” respiration is in presence of Oct, ADP, and malate. (B-D) Individual data from (A) subdivided into low-responders (LRE, open circles) and responders (RE, filled circles) in ISIMats. (B) Fold change (FC) in oxygen consumption post- vs pre-intervention (dashed line: pre-intervention values set as 1), (C) oxygen consumption pre- and (D) post-intervention. Abbreviations: FCCP, carbonyl cyanide-p-trifluoromethoxyphenylhydrazone, uncoupling of respiration from ATP synthesis; Oct, octanoylcarnitine; Pyr, pyruvate; Rot, rotenone, inhibitor of complex I, leaving only complex II (CII) respiration active; Succ, succinate. N = 24-25, mean ± SD. Where data were not normally distributed, unpaired 2-samples Wilcoxon test was used.
Adipose tissue and skeletal muscle differ in substrate preference
Since subcutaneous adipose tissue and skeletal muscle differ in their metabolic function, it is plausible that their mitochondria also differ in the relative contribution of different substrates to maximal OXPHOS capacity. No differences in the relative contributions were detected between preintervention and postintervention in both tissues (Fig. 5); the numbers reported below are from the preintervention measurement. In muscle, the contribution of FAO to OXPHOS was 43% ± 9%, in adipose tissue 54% ± 7% (P < 0.001, Fig. 5A). After addition of pyruvate, contribution to OXPHOS capacity in muscle was higher than in adipose tissue (75% ± 9% vs 69% ± 7%; P = 0.003, Fig. 5B). This was due to a small increase of respiration upon pyruvate injection in adipose tissue compared to skeletal muscle (14% ± 7% vs 32% ± 11% of OXPHOS; P < 0.001, Fig. 5C). Complex II capacity was measured after blocking complex I by rotenone and was 51% ± 16% of respiration in muscle and 74% ± 16% in adipose tissue (P < 0.001, Fig. 5D). The respiration mainly stems from complex II activity. The contribution by cytochrome c, which was added after succinate to assess mitochondrial intactness, was 8.1% ± 4.6% in muscle and 3.9% ± 5.1% in adipose tissue (data not shown). Total maximal uncoupled respiration (using FCCP) was 136% ± 12% of OXPHOS in muscle and 155% ± 16% in adipose tissue (P < 0.001, Fig. 5E). In conclusion, adipose tissue respiration showed a higher contribution of FAO and complex II to OXPHOS capacity when compared with skeletal muscle. We also observed a clear trend toward higher mitochondrial respiratory capacities in adipose tissue obtained from female participants compared with male participants (Fig. 6A and 6B). In particular, total maximal uncoupled respiration (FCCP) was higher in females before and after the training intervention, and FAO showed a similar tendency. No sex-dependent differences were observed in mitochondrial respiration in skeletal muscle fibers (Fig. 6D and 6E) or in the response to exercise (Fig. 6C and 6F).
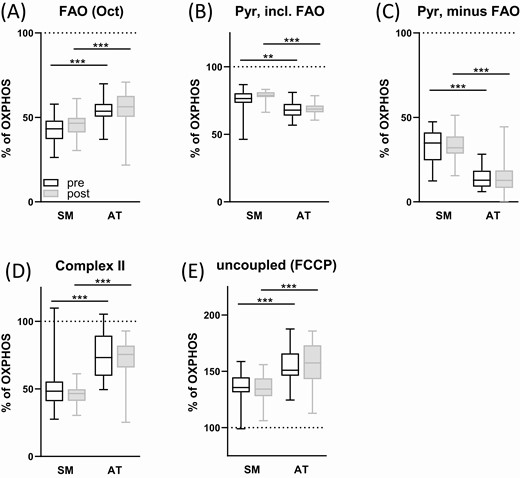
Tissue-specific substrate preferences. Skeletal muscle fibers (SM) and minced subcutaneous adipose tissue (AT) were permeabilized and mitochondrial respiration was measured in presence of different substrates and inhibitors before and after intervention. Contribution of different substrates and complexes to oxygen consumption is shown as % of maximum oxidative phosphorylation (after succinate addition, indicated by dotted line). See Figures 2 and 4 for total absolute measurement data. Abbreviations: FAO, fatty acid oxidation; FCCP, carbonyl cyanide-p-trifluoromethoxyphenylhydrazone, uncoupling of respiration from ATP synthesis; Oct, octanoylcarnitine; Pyr, pyruvate; Rot, rotenone, inhibitor of complex I, leaving only complex II (CII) respiration active; Succ, succinate. All measurements in presence of saturating malate and ADP. Mixed-effects analysis (2-way ANOVA), N = 24-25, mean ± SD. ** P < 0.01, *** P < 0.001.

Sex-specific differences in mitochondrial respiration. Skeletal muscle fibers (SM, A-C) and minced subcutaneous adipose tissue (AT, D-F) were permeabilized and mitochondrial respiration was measured in presence of different substrates and inhibitors before and after intervention. Data from Figures 2 and 4 are shown grouped by sex (female individuals: open circles, males: filled circles). A+D: pre-intervention values, B+E: post-intervention values, C+F: fold change post/pre with the dashed line indicating the mean of the pre-intervention values set as 1. Abbreviations: FCCP, carbonyl cyanide-p-trifluoromethoxyphenyl-hydrazone, uncoupling of respiration from ATP synthesis; Oct, octanoylcarnitine; Pyr, pyruvate; Rot, rotenone, inhibitor of complex I, leaving only complex II (CII) respiration active; Succ, succinate. All measurements in presence of saturating malate and ADP. Multiple paired t-tests, no correction for multiple comparisons. N = 24-25, mean ± SD, * P < 0.05. Where data were not normally distributed, unpaired 2-samples Wilcoxon test was used.
Discussion
In this study, we report 2 main results. First, subjects with no improvement in ISIMats after exercise training exhibited a similar increase in mitochondrial respiration capacities and mitochondrial enzymes in skeletal muscle fibers as responders in ISIMats. Second, exercise training did not alter mitochondrial respiration in subcutaneous adipose tissue.
The increased mitochondrial capacity in skeletal muscle fibers clearly demonstrates that our training protocol was sufficient to increase mitochondrial respiration in muscle. The higher abundance of mitochondrial enzymes of the respiratory chain detected in the fibers after training indicates an increase in mitochondrial density and content (35), which is a consistent observation in human muscle (13, 36). In our study, the higher mitochondrial protein content per se could account for the observed increase in respiration without an additional training effect on the intrinsic mitochondrial capacity. These data are well in accordance with previous studies. However, the results appear not to support the hypothesis that an increase in mitochondrial respiration capacities in skeletal muscle is a major contributor to an improvement in glycemic control and insulin sensitivity after exercise training. Several studies demonstrated the positive effect of exercise training programs on both markers of mitochondrial function and insulin sensitivity in subjects with normoglycemia, insulin resistance, or diabetes (37-41). But a causal relationship between the 2 endpoints has already been questioned since some reports did not find a correlation between the improvements in mitochondrial function and insulin sensitivity in individual subjects (42-44). One possible explanation for the dissociation between the responses in mitochondrial respiration and insulin sensitivity in our study is that the mitochondrial respiration capacity analyzed in permeabilized muscle fibers does not reflect all factors that contribute to an improvement in mitochondrial substrate oxidation in vivo. Alterations in insulin-dependent and independent substrate mobilization, delivery, and cellular uptake were not covered by our high-resolution respirometry analysis but influence actual substrate oxidation in vivo. In particular, the effects of exercise on the insulin-dependent regulation of glucose transporter GLUT4 translocation and on glucose uptake are considered relevant molecular adaptations in skeletal muscle contributing to increased insulin sensitivity (45). Notably, 2 studies measuring mitochondrial function in vivo as skeletal muscle ATP synthesis rate or phosphocreatine recovery rate by magnetic resonance spectroscopy, found an increase in these parameters to be associated with the improvement in insulin sensitivity (46, 47). Thus, our data indicate that mitochondrial respiration capacity as measured in muscle fibers is clearly increased by endurance training driven at least in part by a higher abundance of mitochondrial enzymes, but that it is possibly not a good correlate for the improvement in insulin-dependent substrate oxidation.
One limitation of our study could be that we analyzed the respiration of human muscle fibers at oxygen concentrations between 100 and 180 µM and not at hyperoxic conditions, which can result in limited oxygen diffusion in the fibers and underestimation of oxygen consumption. However, the increase in respiratory capacities was paralleled by an increase in the abundance of mitochondrial complexes, and both parameters showed comparable changes in responders and low-responders in ISIMats, supporting our conclusion. All tissue biopsies that were analyzed in this study were sampled after an acute exercise bout. Even if this would have an impact on mitochondrial respiration, the effect should be comparable between pre and post samples and not influence differences between sexes.
While the intervention induced the respiratory capacity for all analyzed substrate combinations in muscle fibers, no change was detectable in subcutaneous adipose tissue. Few studies have focused on the exercise training–induced changes in mitochondrial respiration in human subcutaneous adipose tissue. A recent study investigated subjects with obesity who performed an 8-week combined endurance and resistance training protocol (48). Respiratory capacity of adipose tissue measured by high-resolution respirometry was unchanged, albeit a higher citrate synthase activity was detected. Similarly, no increase in mitochondrial oxidative phosphorylation of subcutaneous adipose tissue was detected after a 6-week high-intensity training of subjects with obesity, also analyzed using high-resolution respirometry (29). Ex vivo measurement of palmitate oxidation in subcutaneous adipose tissue was unaffected after 60 to 90 minutes daily endurance exercise at 70% of VO2peak over 10 days (49). In that study, the participants were young and lean, and had a much better physical fitness (VO2max of approximately 40 to 50 mL VO2/min/kg) compared with our subjects. In conclusion, all studies, including the present one, differ in subject characteristics and exercise modalities, but in none of these studies was observed an increase in adipose tissue mitochondrial respiration after training. Thus, our data are well in line with other reports. Admittingly, we cannot exclude that we might have missed a small effect that would need a greater sample size.
This result is not surprising, on the one hand, since in contrast to skeletal muscle, the oxygen uptake rate of subcutaneous adipose tissue is not elevated during endurance exercise (50). This suggests no increase in ATP consumption and thus no need to adapt the mitochondrial capacity to higher physical activity. However, on the other hand, training interventions can lead to reduced adipocyte cell size (51, 52), which is confirmed by the observation of smaller adipocytes in endurance-trained compared to sedentary women (53). Since the reduction in adipocyte cell size is due to a lowering of lipid content, it can be speculated that endurance-trained subjects have a higher abundance of cellular proteins and other compartments such as mitochondria per adipose tissue mass. The absence of a reduction in adipocyte size after training is paralleled by unchanged adipose tissue content of mitochondrial proteins (30). Thus, training-induced alterations in adipose tissue morphology might be the driving factor for a detectable effect on mitochondrial respiration. In our study, we also did not find an intervention-related difference in adipocyte size, which is not surprising since the loss of adipose tissue volume was rather small. A genome-wide analysis of differentially expressed transcripts in subcutaneous adipose tissue found increased expression of several genes involved in oxidative phosphorylation after a 6-month exercise intervention (24). Mitochondrial respiration was not measured in that study, but it is possible that prolonged exercise interventions can increase mitochondrial capacity in adipose tissue of humans. On the other hand, our data suggest that adaptations in mitochondrial respiration in subcutaneous adipose tissue are dispensable for the improvement in peripheral insulin sensitivity, which is further supported by the results of an exercise training study analyzing changes in glucose homeostasis in lipectomized rodents (54).
Clear differences exist when comparing the substrate-dependent respiration of muscle and adipose tissue. Mitochondria in adipose tissue showed a higher relative respiration on octanoylcarnitine and on the complex II substrate succinate, while mitochondria in muscle fibers respired more on the glycolytic substrate pyruvate. In addition, the relative uncoupling efficiency was higher in adipose tissue, albeit not increased after training. Thus, our data do not indicate an increased presence of brown fat–like adipocytes in subcutaneous adipose tissue, which was reported to occur in rodents after exercise and led to higher mitochondrial respiration capacity and uncoupling (19).
Another difference between muscle and adipose tissue is the sex-specific difference in mitochondrial respiration which was observed only in adipose tissue. The higher mitochondrial respiration capacities we found in adipose tissue of the female participants are well in line with the higher net lipid oxidation reported in resting conditions and endurance exercise in females and the higher abundance of transcripts encoding for oxidative phosphorylation and respiratory chain proteins in subcutaneous adipose tissue of females (55, 56). Similarly, preadipocytes obtained from female individuals exhibit higher mitochondrial to glycolytic activity (57). It was not the primary aim of our study to investigate differences between sexes, and more females than males participated. Still, the data support existing reports on sex-specific metabolic differences, in particular in adipose tissue, which could influence diabetes susceptibility and the development of metabolic disorders (58).
In conclusion, an 8-week endurance training intervention was sufficient to increase mitochondrial protein content and respiration in skeletal muscle, but not in subcutaneous adipose tissue. The mitochondrial respiration capacities in muscle fibers and adipose tissue were not related to the improvement in whole-body insulin sensitivity. Even though not supported by our data, it is possible that prolonged interventions or lifelong high physical activity levels result in enhanced mitochondrial respiration in subcutaneous adipose tissue.
Abbreviations
- ADP
adenosine diphosphate
- ATP
adenosine triphosphate
- BMI
body mass index
- FAO
fatty acid oxidation
- IAT
individual anaerobic threshold
- OGTT
oral glucose tolerance test
- OXPHOS
oxidative phosphorylation
- T2D
type 2 diabetes
- TCE
2,2,2-trichloroethanol
Acknowledgments
The authors thank all study participants. The authors are grateful for the excellent technical support provided by Heike Runge, Lisa Ulmer, and Nadine Vilas, as well as the organizational support provided by Dr. Louise Fritsche from the University Hospital Tübingen, Tübingen, Germany.
Financial Support: This study was supported in part by grants from the German Federal Ministry of Education and Research (BMBF) to the German Centre for Diabetes Research (DZD e.V.; No. 01GI0925). AM is currently funded by a clinician scientist program from the medical faculty of the University of Tübingen.
Clinical Trial Information: ClinicalTrials.gov registration no. NCT03151590.
Additional Information
Disclosure Summary: The authors declare no competing interests.
Data Availability
The datasets generated during and/or analyzed during the current study are not publicly available but are available from the corresponding author on reasonable request.
References
