


Abstract
Obesity and energy expenditure (EE) are heritable and genetic variants influencing EE may contribute to the development of obesity. We sought to identify genetic variants that affect EE in American Indians, an ethnic group with high prevalence of obesity.
Whole-exome sequencing was performed in 373 healthy Pima Indians informative for 24-hour EE during energy balance. Genetic association analyses of all high-quality exonic variants (≥5 carriers) was performed, and those predicted to be damaging were prioritized.
Rs752074397 introduces a premature stop codon (Cys264Ter) in DAO and demonstrated the strongest association for 24-hour EE, where the Ter allele associated with substantially lower 24-hour EE (mean lower by 268 kcal/d) and sleeping EE (by 135 kcal/d). The Ter allele has a frequency = 0.5% in Pima Indians, whereas is extremely rare in most other ethnic groups (frequency < 0.01%). In vitro functional analysis showed reduced protein levels for the truncated form of DAO consistent with increased protein degradation. DAO encodes D-amino acid oxidase, which is involved in dopamine synthesis which might explain its role in modulating EE.
Our results indicate that a nonsense mutation in DAO may influence EE in American Indians. Identification of variants that influence energy metabolism may lead to new pathways to treat human obesity.
NCT00340132.
Human obesity is heritable, and understanding its genetic determinants requires studying the genetic basis of energy intake and energy expenditure (EE), the 2 physiological factors contributing to daily energy balance and ultimately determining body weight change (1, 2). Several studies conducted in twins (3-5) and in isolated American Indian populations (6, 7) to minimize the effect of environmental factors, have consistently demonstrated that EE is a familial trait and the interindividual variability in EE after controlling for differences in body size and composition among individuals has a substantial genetic component (8-11). We recently conducted a genome-wide association study (GWAS) of human EE, as assessed by accurate measurement over 24 hours inside a whole-room indirect calorimeter and representing a metabolic determinant of weight change (6, 12), in American Indians from different nuclear families using a custom, population-specific genotyping array (13). After controlling for known physiologic determinants of EE and accounting for pairwise relatedness of individuals using empirically observed measures of the proportion of alleles shared identical by descent (IBD), we estimated the genetic heritability of 24-hour EE (i.e., the nonenvironmental portion of heritability specifically ascribable to genetics) in 248 siblings from 98 nuclear families to be 0.52 (13). This estimate of genetic heritability for 24-hour EE obtained combining genetic and pedigree information in this isolate population is substantial and warrants further interrogation of the human genome to identify new genes and pathways that regulate energy metabolism implicated in the etiology of weight gain and obesity (14). The major disadvantage of the GWAS approach to pinpoint genes regulating EE is that common variants captured on an array are typically located in noncoding portions of the genome or may regulate genes at long distance, thus limiting the identification of causal variants/genes for such a complex trait as human EE. To overcome the limitations of GWAS and to identify novel genetic associations that contribute to the genetic architecture of human energy metabolism, we performed whole-exome sequencing to capture low frequency (minor allele frequency 1%-5%) and rare (minor allele frequency < 1%) coding variants that are associated with 24-hour EE in American Indians.
Material and Methods
American Indian volunteers from Arizona were invited to participate in a longitudinal inpatient study (clinicaltrials.gov identifier: NCT00340132), which examined risk factors for obesity and type 2 diabetes assessed on our clinical research unit at the Obesity and Diabetes Clinical Research Section of the National Institutes of Health in Phoenix, AZ. Before participation, volunteers were fully informed of the nature and purpose of the studies, and written informed consent was obtained. The protocols were approved by the Institutional Review Board of the National Institute of Diabetes and Digestive and Kidney Diseases.
Subjects were between 18 and 55 years and were determined to be healthy by physical examination, medical history, and laboratory tests. On admission, subjects were given a standard weight-maintaining diet (50% carbohydrate, 30% fat, and 20% protein) based on unit-specific equations based on gender and weight (15), and then adjusted (if needed) by the research dietitian to maintain body weight within 1% of their admission weight throughout the admission. Body fat mass (FM) and fat free mass (FFM) were estimated by underwater weighing until August 1993 and thereafter by total body dual energy X-ray absorptiometry (DPX-1; Lunar Radiation Corp., Madison, WI, USA). A conversion equation was used to make measurements of body composition comparable between the 2 methods (16). Glucose tolerance was assessed by a 3-hour 75-g oral glucose tolerance test (OGTT) and all subjects were free from diabetes according to the American Diabetes Association diagnostic criteria (17).
After at least 3 days on the weight-maintaining diet and overnight fast, subjects underwent a 24-hour assessment of energy metabolism via whole-room indirect calorimetry (described in detail in the following section), as well as other metabolic tests on different days including IV (IVGTT) and mixed meal (MMTT) glucose tolerance tests, and a hyperinsulinemic-euglycemic glucose clamp. During the IVGTT, blood samples were drawn at different time points (−10, 0, 3, 4, 5, 6, 8, and 10 minutes) to measure plasma glucose and insulin concentrations following IV administration of a 25-g glucose bolus. The acute insulin response (AIR) was calculated as the average increase in plasma insulin concentration from the third to the fifth minute over the fasting insulin concentration (18). During the MMTT, subjects consumed a standardized meal containing 35% of their calculated 24-hour energy requirements, distributed as 40% of total calories from fat, 40% from carbohydrate, and 20% from protein. Blood samples for plasma glucose and insulin measurements were drawn at −15, 0, 30, 60, 90, 120, 150, 180, 210, and 240 minutes following meal ingestion. Insulin action and endogenous glucose production rate were assessed during a 2-step hyperinsulinemic-euglycemic glucose clamp with simultaneous glucose tracers as previously described (19).
Only subjects with normal glucose tolerance (2-hour OGTT glucose < 140 mg/dL, n = 359 except MTTT, where n = 325) were included in the analyses of glucose and insulin concentrations. Glucose concentrations were determined by the glucose oxidase method (Beckman Instruments, Fullerton, CA), whereas insulin measurements using different assays over the course of the study were made comparable using conversion equations (20). Fasting nonesterified fatty acids (NEFA) were measured in a subset of 181 subjects, as previously described (21, 22).
Assessment of energy metabolism via indirect calorimetry
Twenty-four-hour EE and substrate oxidation were measured inside a whole-room indirect calorimeter, as previously described (7). Briefly, volunteers entered the calorimeter around 07:00 after overnight fasting and remained therein for 23.25 hours, during which they consumed a balanced diet (50% carbohydrate, 30% fat, and 20% protein) with 4 meals provided at 8:00, 11:00, 16:00, and 19:00 through an airlock. The total energy intake provided during the 24 hours was calculated based on unit-specific equation developed to achieve 24-hour energy balance inside the confined environment of the calorimeter that limits physical activity (23).
The 24-hour respiratory quotient (RQ) was calculated by extrapolating to 24 hours the average CO2 production and O2 consumption calculated in each 15-minute interval during the 23.25 hours in the calorimeter, and 24-hour EE was calculated using the Lusk’s equation (24). Carbohydrate (CARBOX) and fat (FATOX) oxidation rates were derived from the 24-hour RQ after accounting for protein oxidation, estimated from measurement of 24-hour urinary nitrogen excretion (23). Spontaneous physical activity (SPA) was detected by radar sensors and expressed as the percentage of time over the 15-minute interval in which activity was detected. The EE in the inactive state was calculated as the intercept of the regression line between EE and SPA between 11:00 and 01:00 (25). Sleeping metabolic rate was calculated as the average EE of all 15-minute intervals between 01:00 and 05:00 overnight, during which SPA was <1.5%. The “awake and fed” thermogenesis, as a measure of the thermic effect of food and the energy cost of being awake, was calculated as the difference between EE in the inactive state and sleeping metabolic rate (25).
Whole-exome sequencing and genotyping
Whole-exome sequencing was performed by the Regeneron Genetics Center (Tarrytown, NY) on DNA samples from 6809 subjects who were predominately of American Indian heritage (3180 full heritage Pima Indians). The 373 subjects informative for 24-hour EE analyzed in the current study were a subset of these 6809 subjects. Briefly, the exome was captured using a modified version of the xGen design available from Integrated DNA Technologies. The captured libraries were sequenced on the Illumina NovaSeq platform using paired-end 75-bp reads. At least 90% of the targeted bases were covered at 20× or greater. Raw sequence data were aligned to the human genome reference sequence (build hg38). Variant calling and joint genotyping were performed in batches of 200 samples using the Genome Analysis Toolkit (GATK 3.5) (26). A total of 1.6 M high-quality, biallelic variants passed quality control metrics including: call rate ≥90%, discrepant rate <2.5% in 111 blind duplicate samples, and lack of deviation from Hardy-Weinberg equilibrium (P > 10−4). For the heterozygous samples of rs752074397, DNA was directly sequenced using a BigDye Terminator Sequencing Kit (Applied Biosystems) on an automated DNA capillary sequencer (model 3730xl; Applied Biosystems) to confirm the genotypes obtained by exome sequencing.
Expression vector, cell line, and transfection
An expression vector containing full-length untagged DAO was obtained from Origene (Rockville, MD). Site-directed mutagenesis was used to make the 264Cys to 264Ter substitution in DAO using the QuikChange Lightning Site-directed mutagenesis kit (Agilent Technologies, Santa Clara, CA). The integrity and purity of the construct was assessed by Sanger sequencing. The Chinese Hamster Ovary cell line, obtained from American Type Culture Collection and maintained per its instructions, was used for expression studies. Transient transfections (48 hours) were done using Lipofectamine 3000 (Thermo Fisher Scientific, Waltham, MA) per the manufacturer’s instruction. Cells transfected with either the 264Cys DAO expression vector or the 264Ter DAO expression vector were washed once with PBS and harvested using trypsin-EDTA. Cells were divided into aliquots for RNA isolation and protein extraction and the experiments were repeated twice.
Real-time PCR and western blot
Total RNA was isolated from harvested cells using RNA easy plus mini kit (Qiagen, Germantown, MD) and 2 μg of total RNA was converted to cDNA using the high-capacity RNA to cDNA kit (Thermo Fisher Scientific). Real-time PCR was performed using PowerUp SYBR-Green master mix (Thermo Fisher Scientific) with DAO target and endogenous control primers. Primer pairs were validated by PCR and melt-curve analysis to ensure amplification of a single product and by threshold cycle validation to ensure similar amplification efficiency. All real-time PCR assays were done in triplicate and data normalized to the expression of Gapdh (endogenous control).
For western blot analysis, harvested cells were washed 3× with ice cold PBS and lysed by 30-minute incubation (on ice) in ice cold RIPA lysis buffer supplemented with 1X Halt Protease inhibitor cocktail (Thermo Fisher Scientific) and 5 mM EDTA with occasional vortexing. The lysates were further sonicated on ice at low amplitude to reduce viscosity, and cellular debris was removed by high-speed centrifugation at 4°C. Total protein was quantified using Pierce BCA protein assay kit (Thermo Fisher Scientific) and 15 µg was separated using SDS-PAGE and transferred to a nitrocellulose membrane for protein detection. Anti-DAO antibody (Thermo Fisher Scientific) raised in rabbit using an immunogen from the central region of DAO (amino acid 216-248) was used for protein detection. Horseradish peroxidase-conjugated secondary antibody was from Thermo Fisher Scientific. Tubulin was used as the loading control. Blots were developed by chemiluminescence using Clarity ECL western blotting substrate (BioRad, Hercules, CA) and ChemiDoc touch imaging system (BioRad).
Statistical analysis
Statistical analyses were performed using SAS 9.4 (SAS Institute, Cary, NC). Data are reported as mean with SD or 95% confidence interval (CI). The association of genotypes with 24-hour EE was assessed via a linear mixed effects analysis that was fitted with a variance components covariance structure that used the empirical genetic relatedness matrix, which was estimated as the proportion of the genome shared IBD between each pair of individuals as previously described (13). Genotype was analyzed as a numeric variable representing 0, 1, or 2 copies of a given allele. Results were adjusted for age, sex, FM, FFM, SPA, and the first 5 genetic principal components obtained from our previous GWAS that used a population-specific genotyping array (13). Similar analyses using mixed models were performed for other quantitative metabolic traits (e.g., glucoses, insulins, AIR, body fat) adjusting for known confounders.
Because of the limited statistical power for low-frequency and rare variants, the association analyses were restricted to only those 60,231 variants that map within an exon, a splice-site, or an untranslated region (UTR), and occurred in ≥5 individuals informative for 24-hour EE. Of these candidate variants, coding variants that were annotated to be damaging by prediction algorithms (CADD, SIFT, or PROVEAN) were then considered for follow-up studies.
Results
The clinical characteristics of subjects informative for 24-hour EE and genotypes from whole-exome sequencing are reported in Table 1. The results of 3139 variants with nominal association (P < 0.05, supplemental Table 1; All supplementary material and figures are located in a digital research materials repository (27) with 24-hour EE are shown in Fig. 1. Of these variants, a total of 16 coding variants predicted to be pathogenic by at least 1 algorithm (Table 2 and red circles in Fig. 1) showed a P < 0.001 for association with 24-hour EE (effect size ranged from 43 to 268 kcal/d).
Clinical Characteristics of the Study Cohort
| All Subjects (n = 373) | |
|---|---|
| Age (y) | 27.8 ± 6.5 (18, 46) |
| Sex (M/F) | 224/149 |
| Body weight (kg) | 95.4 ± 22.1 (45.1, 159.4) |
| BMI (kg/m 2) | 34.2 ± 7.5 (18.5, 57) |
| Body fat (%) | 32.9 ± 8.0 (3.7, 49.6) |
| Fat mass (kg) | 32.2 ± 12.9 (2.3, 68.1) |
| Fat free mass (kg) | 63.2 ± 12.5 (35.8, 99.1) |
| Fasting glucose concentration (mg/dL) | 88.3 ± 9.9 (55, 124) |
| 2-h OGTT glucose concentration (mg/dL) | 121.7 ± 30.5 (39, 196) |
| 24-h energy intake (kcal) | 2269.0 ± 339.7 (1505, 3209) |
| 24-h EE (kcal/day) | 2353.0 ± 394.9 (1485, 3488) |
| 24-h RQ (ratio) | 0.85 ± 0.02 (0.78, 0.92) |
| Sleeping EE (kcal/day) | 1668.3 ± 279.7 (991, 2699) |
| EE in the inactive state (kcal/15 hrs.) | 2117.1 ± 349.4 (1373.8, 3087.4) |
| AFT (kcal/15 h) | 454.6 ± 201.1 (0, 1172) |
| SPA (%) | 7.4 ± 2.5 (2.9, 17.5) |
| PROTOX (kcal/d) | 290.6 ± 122.5 (50, 1199) |
| CARBOX (kcal/d) | 1088.1 ± 226.2 (516, 1934) |
| FATOX (kcal/d) | 949.5 ± 293.3 (166, 1973) |
Data are presented as mean ± standard deviation (minimum, maximum).
Abbreviations: AFT, “awake and fed” thermogenesis; BMI, body mass index; CARBOX, carbohydrate oxidation rate; EE, energy expenditure; FATOX, fat oxidation rate; OGTT, oral glucose tolerance test; PROTOX, protein oxidation rate; RQ, respiratory quotient; SPA, spontaneous physical activity.
Coding Variants Predicted to be Pathogenic and Being Associated With 24-h EE at a P < 0.001
| Chr. | Position | Variant ID | Gene | Exonic Function | Alleles (Ref/Alt) | Frequency (Alt. Allele)a | Genotypic Groups AltAlt/AltRef/RefRef | βAlt (SE) (kcal/d) | P Value |
|---|---|---|---|---|---|---|---|---|---|
| 12 | 108898775 | rs752074397 | DAO | Stopgain | C/A | 0.9% | 0/7/366 | −267.9 (60.9) | 1.5 × 10⁻⁵ |
| 22 | 38738202 | rs2072797 | SUN2 | Missense | C/T | 5.1% | 1/36/336 | −105.3 (26.1) | 6.5 × 10⁻⁵ |
| 7 | 32298725 | rs215607 | PDE1C | Missense | G/A | 81.6% | 246/117/10 | 57.7 (14.5) | 8.2 × 10⁻⁵ |
| 1 | 109757069 | rs11102001 | EPS8L3 | Missense | G/A | 30.2% | 20/185/168 | −50.6 (13.1) | 1.4 × 10⁻⁴ |
| 2 | 140700393 | rs34694228 | LRP1B | Missense | C/T | 15.5% | 6/104/263 | −58.8 (15.3) | 1.4 × 10⁻⁴ |
| 10 | 128107632 | rs3740423 | MKI67 | Missense | T/A | 48.9% | 77/211/85 | 43.1 (11.6) | 2.4 × 10⁻⁴ |
| 10 | 128103483 | rs10764749 | MKI67 | Missense | C/T | 48.9% | 76/213/84 | 42.8 (11.7) | 2.9 × 10⁻⁴ |
| 6 | 41159805 | rs2234255 | TREM2 | Missense | G/A | 7.2% | 1/52/320 | 77 (21.3) | 3.5 × 10⁻⁴ |
| 7 | 134247616 | rs140175129 | LRGUK | Missense | C/T | 10.0% | 3/68/298 | 66 (18.5) | 4.1 × 10⁻⁴ |
| 15 | 52244399 | rs55712142 | MYO5C | Missense | C/T | 7.2% | 0/54/319 | 76.1 (21.5) | 4.5 × 10⁻⁴ |
| 14 | 95450051 | rs749054497 | SYNE3 | Missense | C/G | 1.5% | 0/11/362 | 152.8 (44) | 5.9 × 10⁻⁴ |
| 1 | 202214230 | rs74355478 | LGR6 | Frameshift deletion | G/- | 23.5% | 17/141/215 | −45 (13) | 6.2 × 10⁻⁴ |
| 6 | 52187702 | rs566045823 | IL17A | Missense | C/T | 0.9% | 0/7/366 | −192 (56.1) | 6.9 × 10⁻⁴ |
| 6 | 132538470 | rs2842899 | TAAR9 | Stopgain | A/T | 17.8% | 11/111/251 | 49.5 (14.5) | 7.1 × 10⁻⁴ |
| 12 | 56420869 | rs2291739 | TIMELESS | Missense | G/A | 17.4% | 17/96/260 | −47.4 (14) | 7.8 × 10⁻⁴ |
| 4 | 177335759 | rs7689099 | NEIL3 | Missense | C/G | 12.2% | 7/77/289 | 53.8 (15.9) | 7.9 × 10⁻⁴ |
aCalculated in 373 samples informative for 24-hour EE (Table 1).
Variant position is based on human genome Build 38. Variant identification number (rs no.) is based on dbSNP version 147. Exonic function was obtained using ANNOVAR. Estimates of β coefficient (standard error) are expressed per copy of the alternate allele and calculated after adjustment for age, sex, fat mass, free fat mass, spontaneous physical activity, and the first 5 genetic principal components via mixed model analysis accounting for genetic relationships among individuals using empirical, pairwise identical by descent estimates. Variants are sorted by their P value for the association with 24-hour EE (all P values <10−3).

Relationships between minor allele frequency and effect size for 24-h EE for variants showing association with a P < 0.05. The minor allele frequency of each variant (x-axis) was calculated in the cohort of 337 subjects informative for 24-h EE. The effect size (y-axis) refers to 24-h EE and is expressed in kcal/day per copy of the minor allele, and was obtained from a mixed model including age, sex, FM, FFM, SPA, and the first five genetic principal components as covariates and accounting for genetic relatedness between individuals using the empirical genetic relatedness matrix. A total of 3139 variants with a P < 0.05, which map within an exon, a splice-site, or a UTR, and occurred in ≥5 individuals informative for 24-h EE are shown as black circles. The coding variants (n = 16) predicted to be pathogenic by at least 1 prediction tool (CADD, SIFT, or PROVEAN) with P < 0.001 for association with 24-h EE are shown in red. EE, energy expenditure; FM, fat mass; FFM, fat free mass; SPA, spontaneous physical activity; UTR, untranslated region.
Rs752074397 (C > A, CADD = 35), for which the A allele introduces a premature stop codon (Cys264Ter) in DAO (NM_001917.5), demonstrated the strongest association for 24-hour EE (P = 10−5), where the Ter allele (7 heterozygous carriers) associated with substantially lower 24-hour EE (β = −268 kcal/d, 95% CI: −410 to −145, Fig. 2, Fig. 3A) and sleeping EE (β = −135 kcal/d, 95% CI: −31 to −240, P = 0.01, Fig. 3B). This variant also associated with lower 24-hour RQ (β = −0.03, 95% CI: −0.04 to −0.01, P = 2 × 10⁻³), reflecting markedly reduced CARBOX (β = −197 kcal/d, 95% CI: −339 to −55, P = 7 × 10⁻³) and, to a lesser extent, higher FATOX (β = 185 kcal/d, 95% CI: 35-335, P = 0.02). Further, the Ter allele was associated with overall higher glucose and reduced insulin levels during the tolerance tests (Fig. 4). Specifically, the Ter allele (5 carriers) had on average 53% lower AIR during the IVGTT (P = 0.01), 44% lower insulin at 30 minutes during the OGTT (P = 0.01), and 32% lower insulin at 30 minutes during the meal tolerance test (P = 0.11) compared with the Cys allele despite similar body mass index (BMI; P = 0.99), body fat (P = 0.62), and degree of insulin sensitivity (P = 0.51). Further, the Ter allele was associated with higher fasting NEFA (β = +89.9 mg/dL, 95% CI: 15-164, P = 0.02; supplemental Figure 1 (27)) and greater rates of glucose production in fasting condition (β = +0.20 mg/min, 95% CI: 0.04-0.36, P = 0.02; Fig. 5A) and during insulin infusion during the glucose clamp (β = +0.31 mg/min, 95% CI: 0.02-0.59. P = 0.02; Fig. 5B).
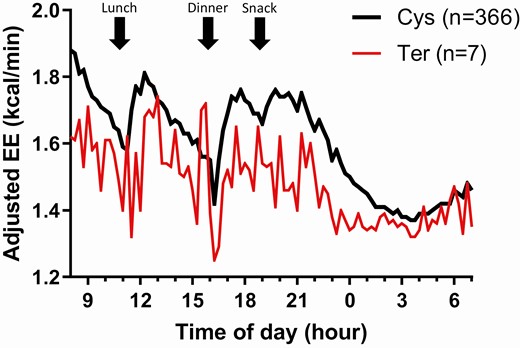
Average time courses of 24-h EE in the respiratory chamber by genotypes of rs752074397 showing reduced EE in subjects carrying the Ter allele. Average time courses of 24-h EE in the respiratory chamber for subjects carrying the Ter allele (red line) and the Cys allele (black line) at rs752074397. Values of EE measured every 15 min are adjusted for age, sex, FM, FFM, and SPA and corrected after and accounting for repeated measures using an AR(1) covariance structure by mixed-model analysis. EE, energy expenditure; FM, fat mass; FFM, fat free mass; SPA, spontaneous physical activity.
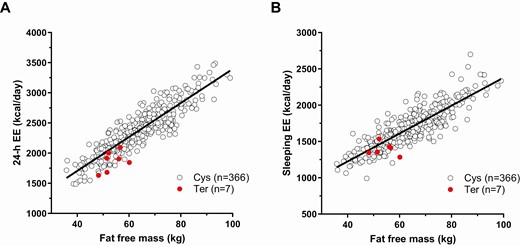
Relationships between fat free mass and (A) 24-h EE and (B) sleeping EE by genotypes of rs752074397 indicating relatively lower EE in subjects carrying the Ter allele. Relationships between fat free mass and 24-henergy expenditure (EE, panel A) and sleeping metabolic rate (B). Sleeping metabolic rate was calculated as the average EE of all 15-min intervals between 01:00 and 05:00 overnight during which spontaneous physical active was <1.5%. EE, energy expenditure.
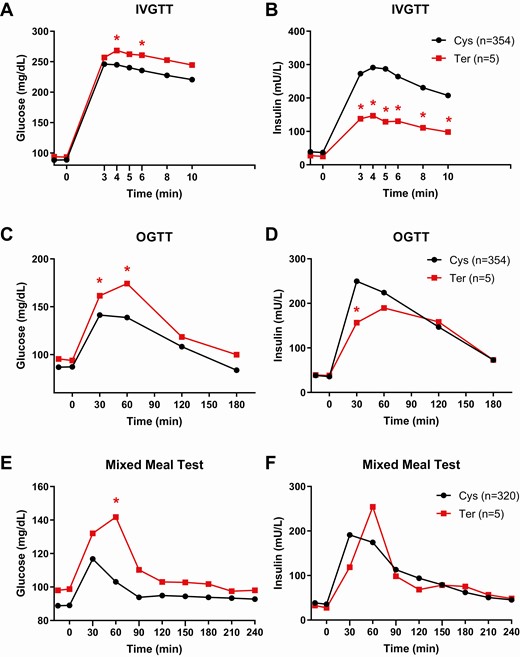
Plasma glucose and insulin concentrations during IV, oral, and mixed meal tolerance tests by genotypes of rs752074397. Average time courses of (A, C, E) plasma glucose and (B, D, F) insulin concentrations during the IV glucose tolerance test (IVGTT, A-B), oral glucose tolerance test (OGTT, C-D), and mixed meal tolerance test (E-F) for subjects with normal glucose tolerance carrying the Ter allele (red line) and the Cys allele (black line) at rs752074397. *P < 0.05 between genotypic groups by mixed model analyses after adjustment for age, sex, percentage body fat, first 5 genetic principal components and accounting for relatedness via mixed model analysis.
![Relationship between fat free mass and (A) postabsorptive endogenous glucose production and (B) low-dose insulin infusion during the glucose clamp by genotypes of rs752074397. Endogenous glucose production rates during the (A) baseline and (B) insulin-stimulated phases of the glucose clamp. After an overnight fast, a primed (30 μCi) continuous (0.3 μCi/min) 3-[3H] glucose infusion was administered for 120 min before samples being drawn for determination of (A) basal glucose output, followed by 100 min of IV insulin infusion at a constant rate of 40 mU/m2/min for estimation of endogenous glucose production rate using Steele’s equations. (Steele R. (1959). Influences of glucose loading and of injected insulin on hepatic glucose output. Annals of the New York Academy of Sciences, 82(2), 420–430).](https://oup.silverchair-cdn.com/oup/backfile/Content_public/Journal/jcem/105/11/10.1210_clinem_dgaa548/3/m_dgaa548_fig5.jpeg?Expires=1750309030&Signature=bX99CWBVGhvhiM7-rGuXJV6Xi5Yy1NtnsxnvL0weFEQwDNP4KGiihFztLyFFvsOhiEDMkS-DrDq-Nkzw2vxCpPSH1~F-uffK0LbvljLiXFHSZOpVvxZUlugFKIgy2l-wfQJtjB~VpPCD0WoYa9YrGca8cQTYtijkIjU1fEuW3q-VCIh-QWDpceOas5cRDuXDjyBBlEAawzUXw51Me0Xrxd5w5vwxHsp6U9WfDrRleuRA~dPuMJbMkR6hkC0tOKjB9azj2dZ23B5yBkTAwyyDrrhOIVXHusYv7aJ0usXc5C-aLqAlAj7jgVZAavlKQJQGmLE52JP~gYeCL23EDRGCPw__&Key-Pair-Id=APKAIE5G5CRDK6RD3PGA)
Relationship between fat free mass and (A) postabsorptive endogenous glucose production and (B) low-dose insulin infusion during the glucose clamp by genotypes of rs752074397. Endogenous glucose production rates during the (A) baseline and (B) insulin-stimulated phases of the glucose clamp. After an overnight fast, a primed (30 μCi) continuous (0.3 μCi/min) 3-[3H] glucose infusion was administered for 120 min before samples being drawn for determination of (A) basal glucose output, followed by 100 min of IV insulin infusion at a constant rate of 40 mU/m2/min for estimation of endogenous glucose production rate using Steele’s equations. (Steele R. (1959). Influences of glucose loading and of injected insulin on hepatic glucose output. Annals of the New York Academy of Sciences, 82(2), 420–430).
Rs752074397 is highly enriched in Pima Indians
Public databases show that rs752074397 is extremely rare in Latinos (ExAC frequency = 0.009% and gnomAD frequency = 0.018%) and monomorphic in other ethnic groups. Our cohort informative of 24-hour EE only includes 373 subjects; therefore, to obtain an accurate estimate of the frequency of rs752074397 in American Indians, this variant was genotyped in our entire population-based sample of 7686 American Indians from Arizona, of whom 3738 are full heritage Pima Indian and 3048 are mixed heritage Pima Indians. The frequency of the Ter allele was 0.55% in full heritage Pima Indians (41/3,738) and 0.23% in mixed heritage Pima Indians (18/3948). Similar to what found in the cohort informative for 24-hour EE (n = 373), among individuals in this population-based sample who were informative for BMI (maximum measured at age ≥15 years before the development of type 2 diabetes), there was no significant difference (P = 0.28) in BMI between Ter allele carriers (mean BMI = 35.62 kg/m2 at mean age 28.5 years; n = 43) versus noncarriers (mean BMI = 35.16 kg/m2 at mean age 29.1 years; n = 5827).
Cys264Ter in DAO encodes a truncated protein
Rs752074397 leads to the substitution of a Cys codon at the amino acid position 264 with a stop codon in DAO. We assessed the effect of the stop codon on protein expression. As expected, the mutant DAO expression vector led to the generation of a truncated DAO protein (Fig. 6A). However, the truncated protein was expressed at a much lower DAO protein level than the wild-type protein, possibly from increased degradation, despite similar mRNA expression (Fig. 6B).
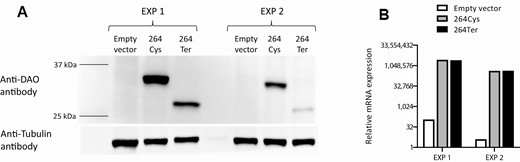
In vitro assessment of the DAO Cys264Ter variant. Chinese hamster ovary (CHO)-K1 cells (which do not express DAO) were transfected with either DAO 264Cys or DAO 264Ter expression vectors. Forty-eight hours after transfection, cells were harvested and divided into equal aliquots. (A) One aliquot was used for protein extraction and western blot to detect DAO protein expression. Tubulin was used as a loading control. (B) The other aliquot was used for RNA isolation and subsequent real-time PCR to detect DAO mRNA expression and assess transfection efficiency. Expression of Gapdh was used for data normalization. The experiments (EXP1 and EXP2) were repeated twice; results from both experiments are shown.
Discussion
We performed whole-exome sequencing in a cohort of American Indians with accurate measurements of energy metabolism over 24 hours inside a whole-room indirect calorimeter during isocaloric conditions to identify the genetic basis of human EE by taking advantage of the substantial proportion of heritability in 24-hour EE attributable to genetic variants in this ethnic population. Of the coding variants predicted to be pathogenic by prediction algorithms and showing the strongest statistical evidence for the association with 24-hour EE, the A allele at rs752074397 associated not only with markedly decreased 24-hour EE but also with decreased AIR, plasma insulin concentrations, and CARBOX while being associated with higher glucose production rates and plasma glucose concentrations, NEFA, and FATOX. Rs752074397 (c.792C > A) encodes a stop gain variant in D-amino acid oxidase (p.Cys264Ter, DAO, NM_001917.5) and leads to a truncated form of DAO protein (~29 kDa) with reduced protein levels in in vitro expression studies. The truncated DAO will lack the c-terminal 83 amino acid present in the full-length form (347 amino acid). Cys264Ter has a frequency of ~0.5% in Pima Indians living in Arizona, whereas being much rarer in Latinos (~0.01%) and not been reported in other ethnic groups.
Several studies have been conducted to identify the genetic basis of energy metabolism in humans, including candidate gene studies (28-33), linkage studies (34-38), and GWAS (13, 39, 40). Our current analysis focusing on low frequency coding variants detected in our American Indian population extends our previous study using a population-specific genotyping array capturing common variants enriched in this ethnic group (13). Importantly, the present study represents one of the few studies using whole-exome sequencing to identify the genetic regulators of human EE, a complex polygenic trait that has a moderate heritable component (10, 11, 13, 41) particularly in American Indians (h2 = 0.52) (13). Although no variants met the stringent Bonferroni statistical significance threshold (P = 8 × 10⁻⁷), among the top variants showing evidence of association with 24-hour EE that were also predicted to be functional by in silico prediction algorithms, Cys264Ter DAO was one of the strongest variants associated with reduced 24-hour EE.
We further evaluated how this predicted protein-truncating variant in DAO may affect its expression by bioinformatic analysis and in vitro experiments. Premature termination codon (PTC) containing transcripts are degraded by a translation-coupled mRNA surveillance pathway called non-sense mediated mRNA decay (NMD). The canonical model by which PTC containing transcripts trigger NMD is the exon junction complex (EJC) model. In a recent study (42), Lindeboom et al. further confirmed that the EJC model of NMD widely applies to human genes and further identified conditions that govern NMD and explain the variance in the ability of a PTC to trigger NMD using matched exome and transcriptome data from ~10,000 human tumors. The main conditions identified by Lindeboom et al. that may lead to inefficient NMD includes: (1) Presence of the PTC in the last exon or within 50 nucleotides of the last exon junction; (2) PTCs near the start codon; (3) PTCs in long exons (61% vs 98% NMD efficiency for exons >400 nucleotide); and (4) Distance of the PTC from the normal termination site. Other conditions include mRNA half-life and presence of protein-binding motifs at the PTC site. The PTC generating rs752074397 variant in DAO is located in the third (exon 9) from last exon (exon 11) of DAO (NM_001917.5) and is 120 nucleotides upstream of the last exon junction. Exon 9 of DAO is only 118 nucleotides in length and the PTC is 249 nucleotides upstream of the normal termination codon. Therefore, based on the previously defined rules, we propose that the PTC generated by rs752074397 is highly likely to trigger NMD. However, NMD efficiency can also be affected by mRNA half-life or the presence of protein binding motifs near the PTC. Moreover, exceptions to the EJC model has been reported including an alternative 3′ UTR model and dosage compensation may also play a role in masking the effect of the NMD. Our in vitro protein expression analysis using the overexpression system and western blot showed that the PTC in DAO can lead to the expression of a truncated protein, but the truncated protein is present at a significantly lower level compared with the wild-type DAO. Therefore, our observations suggest that the stop-gain variant in DAO can potentially affect DAO function by reduced expression.
DAO is a flavoenzyme expressed in human brain, liver, and kidney (GTEx Portal, https://www.gtexportal.org/home/, accessed November 2019), which acts on D-amino acids (43, 44). DAO is known to regulate the level of the neuromodulator D-serine in the brain (45) and kidney (46). DAO has also activity toward D-DOPA, and contributes to dopamine synthesis (47, 48). Previous studies provide some evidence for the role of dopamine pathways in regulating EE (49, 50). Interestingly, a Ser311Cys mutation in the dopamine receptor D2 is associated with lower 24-hour EE in American Indians (33). In addition to lower 24-hour EE (−268 kcal/d), carriers of the Ter allele at rs752074397 had lower RQ that mainly reflected markedly reduced CARBOX (−197 kcal/d). This large defect in daily CARBOX is in line with overall higher plasma glucose concentrations in three different settings (oral, IV, and meal tolerance tests) and could be partly because of impaired early-phase insulin secretion given the markedly decreased AIR (−53%) and lower OGTT 30-minute insulin concentrations in the carriers. Altogether, these results suggest that the large defect in daily EE observed in carriers of DAO stop-loss mutation is attributable in part to reduced CARBOX as a result of impaired insulin secretory response, which could be due to the involvement of dopamine (a downstream product of DAO (47, 48, 51)) and its receptors in glucose-stimulated insulin secretion (52, 53). Further, we also found that the Ter allele at rs752074397 associated with higher FATOX and greater fasting NEFA concentration, which is line with previous studies showing a positive association between NEFA and FATOX (54-56). Consistent with the findings of increased plasma glucose concentration during the 3 tolerance tests, we found that carriers of Ter allele at rs752074397 had increased glucose production rate in the post-absorptive state and during insulin infusion of glucose clamp. In kidneys and liver, 2 organs contributing to endogenous glucose production where DAO is expressed at a relative high level, DAO catalyzes the oxidation of D-serine, a highly glucogenic substrate (57). We might speculate that functional impairment of DAO in carriers of the Ter allele might lead to increased D-serine concentration (as also observed in DAO-null mice (58, 59)), which in turn may contribute to increased glucose production by the liver and elevated renal glucose reabsorption. Interestingly, 2 weeks of oral supplementation of D-serine induce hyperglycemia in mice because of impaired insulin secretion, presumably via an effect of increased sympathetic nervous activity on pancreatic islets (60). Altogether, these results provide strong evidence for the involvement of DAO and its substrate D-serine in glucose homeostasis and insulin secretion in humans.
In conclusion, by investigating the association between low-frequency genetic variants and accurate measures of 24-hour EE, we have identified a functional mutation in the human DAO gene (rs752074397), which is characterized by reduced EE, impaired insulin secretory response, and increased glucose production rate. However, the small number of carriers for this variant may provide spurious statistical associations; therefore, further analysis is warranted as additional datasets for EE in populations with this variant become available. The characterization of the genetic basis of energy metabolism will lead to the identification of biological pathways that may be involved in the development of human obesity. We speculate that pharmacological therapies targeting newly identified genes involved in energy metabolism may help prevent weight gain and obesity-related comorbidities such as diabetes in genetically predisposed individuals, thus leading in the future to novel approaches for the treatment of obesity in the context of precision medicine initiatives.
Abbreviations
- AIR
acute insulin response
- BMI
body mass index
- CARBOX
carbohydrate oxidation rate
- CI
confidence interval
- EE
energy expenditure
- EJC
exon junction complex
- FATOX
fat oxidation rate
- FM
fat mass
- FFM
fat free mass
- GWAS
genome-wide association study
- IBD
identical by descent
- IVGTT
intravenous glucose tolerance test
- MAF
minor allele frequency
- MMTT
mixed meal tolerance test
- NEFA
nonesterified fatty acids
- NMD
non-sense mediated mRNA decay
- OGTT
oral glucose tolerance test
- PTC
premature termination codon
- RQ
respiratory quotient
- SPA
spontaneous physical activity
- UTR
untranslated region
Acknowledgments
The authors thank the nursing, clinical, dietary staff, and laboratory technicians of the Phoenix Epidemiology and Clinical Research Branch for conducting this study. This study used the computational resources of the Biowulf system at the National Institutes of Health, Bethesda, MD.
Financial Support. This research was supported by the Intramural Research Program of the National Institutes of Health (NIH), The National Institute of Diabetes and Digestive and Kidney Diseases (NIDDK). P.P. was supported by the program “Rita Levi Montalcini for young researchers” from the Italian Minister of Education and Research (Ministero dell’Istruzione, dell’Università e della Ricerca).
Additional Information
Prior Presentation. This study was presented in abstract form at American Society of Human Genetics (ASHG) 2018 Annual Meeting, San Diego, CA, October 16-20, 2018.
Authors contributions. P.P. designed the study, analyzed, and interpreted data, and wrote the manuscript. C.K. analyzed the sequencing data and performed all the computational analyses. A.K.N. and J.S. performed the in vitro experiments and wrote the related procedures in the manuscript. Y.L.M., P.K., W.H., and S.K. analyzed and interpreted data and provided statistical advice. A.R.S., H.K., N.G., C.V.V., and M.J. generated the whole-sequencing data, reviewed the manuscript, and assisted with the interpretation of the data. W.C.K., J.K., R.L.H., and C.B. obtained the clinical and physiological data, reviewed the manuscript, and assisted with the interpretation of the data. L.J.B. designed the study, assisted with the interpretation of the data, and edited and reviewed the manuscript. All authors read and approved the final manuscript. P.P. is the guarantor of this work, and, as such, had full access to all the data in the study and takes responsibility for the integrity of the data and the accuracy of the data analysis.
Disclosure Summary: A.R.S., H.K., N.G., C.V.V., and M.J. are employees of and receive compensation from Regeneron Pharmaceuticals, Inc. The other authors have declared that no conflict of interest exists.
Data Availability
Restrictions apply to the availability of data generated or analyzed during this study to preserve patient confidentiality or because they were used under license. The corresponding author will on request detail the restrictions and any conditions under which access to some data may be provided.
References
