


Abstract
Most cytologically indeterminate thyroid nodules (ITNs) with benign molecular testing are not surgically removed. The data on clinical outcomes of these nodules are limited.
We retrospectively analyzed all ITNs where molecular testing was performed either with the Afirma gene expression classifier or Afirma gene sequencing classifier between 2011 and 2018 at a single institution.
Thirty-eight out of 289 molecularly benign ITNs were ultimately resected. The most common reason for surgery was compressive symptoms (39%). In multivariable modeling, patients aged <40 years, nodules ≥3 cm, presence of an Afirma suspicious nodule other than the index nodule, and compressive symptoms were associated with higher surgery rates with hazard ratios for surgery of 3.5 (P < 0.001), 3.2 (P < 0.001), 16.8 (P < 0.001), and 7.31 (P < 0.001), respectively. Of resected nodules, 5 were malignant. False-negative rate (FNR) was 1.7%, presuming all unresected nodules were truly benign and 13.2% restricting analysis to resected cases. The FNR was significantly higher in nodules with a high-risk sonographic appearance for cancer (American Thyroid Association high-risk classification and American College of Radiology Thyroid Imaging Reporting and Data Systems score of 5) compared with nodules with all other sonographic categories (11.8% vs 1.1%; P = 0.03 and 11.1% vs 1.1%; P = 0.02, respectively).
Younger age, larger nodule size, presence of an Afirma suspicious nodule other than the index nodule, and compressive symptoms were associated with a higher rate of surgery. The FNR of benign Afirma was significantly higher in nodules with high-risk sonographic features.
Thyroid nodules are extremely common and 15% to 30% of thyroid nodules are categorized as cytologically indeterminate thyroid nodules (ITNs) based on the widely implemented Bethesda criteria (1-4). Approximately 20% to 30% of these nodules are ultimately malignant on surgical pathology, although ranges of malignancy are broad (5-7). In the past, most of these patients underwent diagnostic surgery for definitive diagnosis (8). With 70% of these nodules being ultimately benign on final surgical pathology, demand rose for better diagnostic methods to lower the risk of surgical complications and, hopefully, reduce cost (9). Several molecular tests have been developed with a strategy to reduce unnecessary thyroid surgeries for benign ITNs (5, 10-14). The Afirma gene expression classifier (GEC) and its second-generation platform gene sequencing classifier (GSC), (Veracyte, South San Francisco, CA) is a commercially available molecular test (5) that was developed with a strategy to reduce diagnostic thyroid surgeries for benign ITN nodules. Multiple clinical validation studies have shown its high Negative Predictive Value (NPV) of 95% to 98%, a malignancy rate low enough to justify surveillance rather than surgical resection (5, 6, 10, 15-49). Appropriate follow-up strategies of these nodules are yet to be established. Several observational studies have assessed the clinical outcome of these nodules. However, the follow-up period was relatively short, and only a small number of nodules were surgically resected, in each study ranging from 5 to 28 nodules (6, 15, 16). Here, we report clinical outcome data of molecularly benign ITNs from a large database, with one of the highest numbers of surgical cases reported to date, in this particular population at a single institution.
Methods
Tissue samples
This is a retrospective analysis of patients who had 1 or more ITN thyroid nodules on thyroid fine-needle aspiration (FNA) biopsy at The Ohio State University Medical Center. Indeterminate cytopathology includes 2 categories: Bethesda category III comprising atypia or follicular lesion of undetermined significance (AUS/FLUS) and Bethesda category IV comprising suspicious for follicular neoplasm (SFN) or Hürthle cell neoplasm. The decision of whether to proceed with FNA for each thyroid nodule was made according to the clinical judgment of the treating physicians and patient preference. The FNA samples for cytology and molecular testing were obtained with a 23-,25- or 27-gauge needle under ultrasound guidance. The molecular specimens were stored in a –60°C freezer. Samples with cytology results reported as ITN cytology were eligible for additional testing with GEC (February 2, 2011, through July 11, 2017) or GSC (July 11, 2017, through December 19, 2018). All samples were shipped at a temperature of –17° to –4°C to Veracyte, Inc in South San Francisco for testing. Thus, all cytology readings rendered from our team of academic cytopathology specialists in head and neck cancer occurred independently of the subsequent molecular test. The determination of whether to proceed with surgery and to what extent or to monitor was made by the treating physician and the patients. In the case of surgical intervention, the histologic diagnosis was rendered by academic pathologists specializing in head and neck pathology. The type of procedure, timing, and reason for surgery were collected from the medical charts. Incidentally detected microcarcinomas that were not in the target of thyroid FNA were excluded. Clinical information was collected on patients with Bethesda III/IV cytology results and Afirma benign results. The data collection was approved by The Ohio State University institutional review board (IRB number: 2017H0464).
Follow-up information
In available cases, follow-up nodule size, surgical outcome, and repeat cytology results were collected. Size changes were considered clinically significant if the increase or decrease involved at least 2 nodule dimensions of at least 20% of the baseline diameter or nodule volume change of 50% or more. Nodule volume was calculated using the equation V = πABC/6; where V is the volume, A is the longest diameter, and B and C are the other 2 perpendicular diameters.
Sonographic features
All available ultrasound imaging and reports were reviewed by 2 endocrinologists who specialize in thyroid nodules and cancer (M.E. and F.N.). All nodules were categorized into either 4 categories (very low, low, intermediate, high) based on the American Thyroid Association (ATA) criteria (50) or category 1 to 5 based on the American College of Radiology and Thyroid Imaging Reporting and Data Systems (ACR-TIRADS) (51). Judgments were made jointly to minimize interobserver variability.
Statistical analysis
The primary outcome was time from biopsy date to surgery date. Baseline patient variables were evaluated for association with time to surgery by univariable Cox proportional hazard models. This survival analysis technique takes into account whether or not surgery was performed, the time from biopsy to surgery, and also the amount of follow-up time available for patients who did not undergo surgery. Nodules from patients not undergoing surgery were censored at the latest follow-up time point. Baseline variables with P < 0.1 in univariable analysis were considered for inclusion in a multivariable Cox proportional hazards model. Backward selection was then used to sequentially remove variables using the criterion P > 0.05 (none were removed based on this criterion). Maximum nodule size and nodule volume were highly correlated, therefore only 1 (maximum size) was selected for the final model based on having a lower P value in the initial multivariable model. Follow-up size measurements were not included in the model due to the number of missing values. The multivariable model serves to evaluate the associations between the included variables and time to surgery, while adjusting for the other variables in the model. As the relationship between the continuous variables and the log-hazard ratio was not linear, the continuous variables age at biopsy and nodule size were dichotomized in the multivariable model based on an optimal cutpoint. In secondary analysis, the association between ultrasound results and malignancy and differences in surgery rate and FNR between GEC and GSC nodules were assessed using Fisher exact tests. All analyses were performed using SAS software version 9.4 (SAS Institute, Cary, NC).
Results
Baseline variables associated with surgical intervention
There were 289 nodules from 270 unique patients with a diagnosis of Bethesda III/IV category and Afirma benign results. One hundred sixty nodules were tested with the Afirma GEC, and 129 cases were tested with the GSC. Thirty-seven unique patients with 38 nodules (13.1% of all nodules) ultimately underwent surgery.
Younger age at initial biopsy (mean age 49.5 vs 55.8 years, univariable Cox P = 0.02), larger nodule volume at baseline (median 4.5 vs 1.8 cm3, univariable Cox P < 0.001), larger maximum nodule size (2.8 vs 2.0 cm, univariable Cox P < 0.001), and larger follow-up nodule volume (6.9 vs 2.0 cm3, univariable Cox P = 0.02, n = 167) were associated with surgical intervention. A higher proportion of surgical nodules had other nodules that were Afirma suspicious (18.4% vs 1.6%) and compressive symptoms (39.5% vs 6.8%). No gender, race, Bethesda cytology (III vs IV), change in nodule size, sonographic appearance (TI-RADS classification and ATA classification), or Hürthle cell changes were associated with surgical intervention (Table 1). The median duration from initial biopsy to the surgery was 8.4 months (interquartile range 2.3-21.3; min-max 0.4-45.7 months). Thirty-nine percent of surgical patients had surgery within 3 months after the initial FNA (13-84 days). The rate of surgery was highest in the first 6 months following initial biopsy. Across all nodules, the Kaplan-Meier estimate for percentage of nodules receiving surgery was 5.9% at 6 months, 7.3% at 1 year, 11.1% at 2 years, 14.8% at 3 years, and peaked out at 16.7% across all available follow-up.
Patient and nodule characteristics by surgery status
| Characteristic | No Surgery (n = 251) | Surgery (n = 38) | P Valuea |
|---|---|---|---|
| Age at biopsy, mean (SD) | 55.8 (13.6) | 49.5 (15.0) | 0.02 |
| Gender, female (%) | 192 (76.5) | 29 (76.3) | 0.91 |
| Bethesda category (%) | 0.99 | ||
| III | 187 (74.5) | 28 (73.7) | |
| IV | 64 (25.5) | 10 (26.3) | |
| Hürthle cell changes (%) | 29 (11.6) | 5 (13.2) | 0.11 |
| Race (%) | 0.99 | ||
| Caucasian | 209 (83.3) | 33 (86.8) | |
| African American | 32 (12.7) | 5 (13.2) | |
| Asian | 8 (3.2) | 0 (0) | |
| Hispanic | 1 (0.4) | 0 (0) | |
| Unknown | 1 (0.4) | 0 (0) | |
| ATA sonographic risk (%) | 0.69 | ||
| High | 14 (5.6) | 3 (7.9) | |
| Intermediate | 95 (37.8) | 12 (31.6) | |
| Low | 122 (48.6) | 22 (57.9) | |
| Very low | 12 (4.8) | 1 (2.6) | |
| Unknown | 8 (3.2) | 0 (0) | |
| TIRAD risk (%) | 0.87 | ||
| 5 | 12 (4.8) | 3 (7.9) | |
| 4 | 99 (39.4) | 16 (42.1) | |
| 3 | 108 (43.0) | 15 (39.5) | |
| 2 | 18 (7.2) | 3 (7.9) | |
| 1 | 6 (2.4) | 1 (2.6) | |
| Unknown | 8 (3.2) | 0 (0) | |
| Multinodular (%) | 171 (68.1) | 30 (78.9) | 0.16 |
| Presence of Afirma suspicious nodule outside the index nodule (%) | 4 (1.6) | 7 (18.4) | <0.001 |
| Compressive symptoms (%) | 17 (6.8) | 15 (39.5) | <0.001 |
| Initial maximum nodule size (cm), median (IQR) | 2.0 (1.5, 2.8) | 2.8 (1.8, 3.6) | <0.001 |
| Initial nodule volume (cm3), median (IQR) | 1.8 (0.8, 4.1), n = 244 | 4.5 (1.4, 10.1) | <0.001 |
| Last follow-up maximum nodule size (cm), median (IQR) | 2.0 (1.5, 2.8), n = 149 | 3.4 (2.7, 3.7), n = 18 | 0.001 |
| Last follow-up nodule volume (cm3), median (IQR) | 2.0 (0.9, 4.6), n = 149 | 6.9 (3.7, 14.2), n = 18 | 0.02 |
| Change in nodule size at last follow-up (cm), median (IQR) | 0.0 (–0.2, 0.2), n = 149 | 0.3 (0.0, 0.5), n = 18 | 0.17 |
| Change in nodule volume at last follow-up (cm3), median (IQR) | 0.1 (–0.4, 0.9), n = 143 | 0.5 (0.0, 4.4), n = 18 | 0.06 |
Abbreviations: ATA, American Thyroid Association; IQR, interquartile range; SD, standard deviation; TIRAD, Thyroid Imaging Reporting and Data Systems.
aUnivariable Cox proportional hazards model, excludes missing/unknown values.
The most common reason for surgery was compressive symptoms (n = 15, 39%). The second most common reasons for surgery were the presence of Afirma suspicious nodules outside of the index nodule (n = 7, 18%), increase in nodule size at follow-up (n = 7, 18%), followed by clinician preference (n = 3, 8%), patient preference (n = 2, 5%), development of metastatic lymphadenopathy at follow-up (n = 1, 3%), suspicious FNA results on repeat biopsy (cytology SFN with Hürthle changes and suspicious Afirma results) (n = 1, 3%), the size of the nodule (n = 1, 3%), and contralateral Papillary Thyroid Cancer (PTC) (n = 1, 3%) (Fig. 1). Reasons for clinician preferences were 2 cases due to concern from cytology results showing Hürthle cell changes and 1 case due to history of a hoarse voice and a family history of thyroid cancer. All of these cases were benign on the final pathology. For resected cancerous cases, reasons were an Afirma suspicious nodule other than the index nodule (40%), increase in size (20%), development of metastatic lymph node (20%), and compressive symptoms (20%). For patients who had surgery within 3 months of the initial FNA, reasons for surgical intervention were compressive symptoms (40%), presence of an Afirma suspicious nodule other than the index nodule (27%), clinician preference (13%), patient preference (13%), and contralateral PTC (7%).
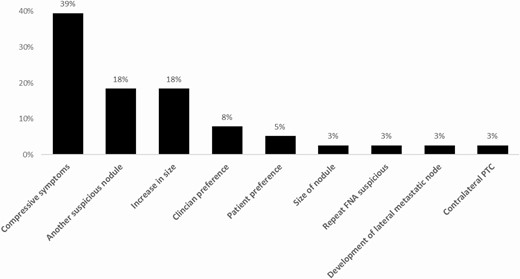
Reason for surgery on operated nodules.
Age at biopsy (cutoff at age 40 years), baseline maximum nodule size (cutoff at 3 cm), presence of other nodules that were Afirma suspicious, and compressive symptoms were included in the final multivariable Cox proportional hazards model for time to surgery. Last follow-up maximum nodule size and volume were not included due to missing values and high correlation with baseline maximum nodule size. Baseline maximum nodule size was more strongly associated with time to surgery than baseline nodule volume, so it was included. Empirically, the optimal cutpoints were at age 37 years and nodule size of 2.9 cm. However, the cutoffs of age 40 years and nodule size of 3 cm were applied in the final model as clinically reasonable round numbers and so as not to overfit the results to this particular data. The surgery rates for each of the variables in the final model are reported in Table 2. Controlling for all other variables in the model, we found the surgery rate was higher in patients younger than age 40 years compared with patients aged 40 or older (hazard ratio [HR] 3.50; 95% confidence interval [CI], 1.73-7.09; P < 0.001); patients with nodules ≥3 cm had HR of 3.19 for surgery (95% CI, 1.65-6.16; P < 0.001) compared with patients with nodules <3 cm; patients with other nodules that were Afirma suspicious had HR for surgery of 16.80 (95% CI, 6.76-41.73; P < 0.001) compared with patients without another nodule that was Afirma suspicious; and patients with compressive symptoms had HR for surgery of 7.31 (95% CI, 3.55-15.05; P < 0.001) compared with those without (Table 3).
Associations with surgical intervention
| Variable | Surgery Rate (%) |
|---|---|
| Age at biopsy | |
| <40 years | 13/42 (31.0) |
| ≥40 years | 25/247 (10.1) |
| Maximum nodule dimension | |
| <3 cm | 21/225 (9.3) |
| ≥3 cm | 17/64 (26.6) |
| Presence of Afirma suspicious nodule outside the index nodule | |
| Yes | 7/11 (63.6) |
| No | 31/278 (11.2) |
| Compressive symptoms | |
| Yes | 15/32 (46.9) |
| No | 23/257 (8.9) |
Multivariable Cox proportional hazards model for time to surgical intervention
| Parameter | Hazard Ratio (95% CI) | P Value |
|---|---|---|
| Age <40 years vs ≥40 years | 3.50 (1.73, 7.09) | <0.001 |
| Nodule size ≥3 cm vs <3 cm | 3.19 (1.65, 6.16) | <0.001 |
| Presence of Afirma suspicious nodule outside the index nodule, yes vs no | 16.80 (6.76, 41.73) | <0.001 |
| Compressive symptoms, yes vs no | 7.31 (3.55, 15.05) | <0.001 |
Abbreviation: CI, confidence interval.
Kaplan-Meier curves showing the relationship between the surgical intervention and nodule size, age, presence of another Afirma suspicious nodule, and compressive symptoms are shown (Figs 2-5).
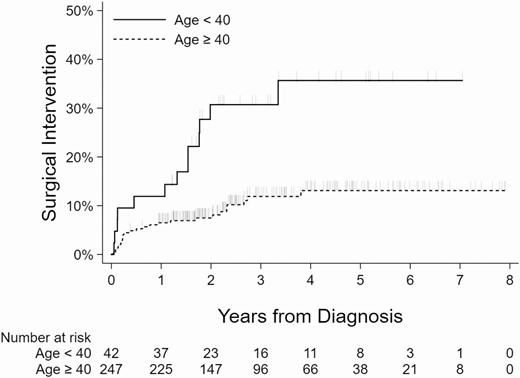
Kaplan-Meier curves showing association between age and surgical intervention. Vertical dashes indicate censored observations (last follow-up, no surgery).
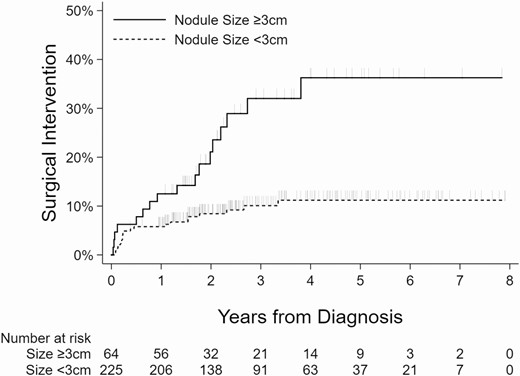
Kaplan-Meier curves showing association between nodule size and surgical intervention.
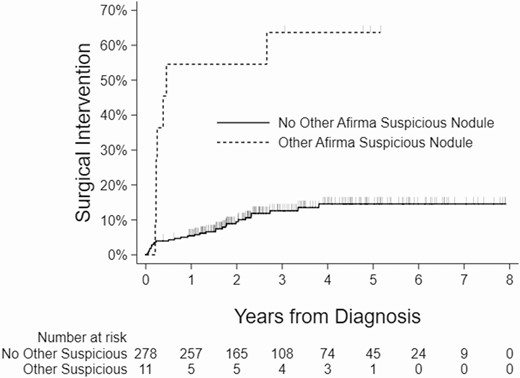
Kaplan-Meier curves showing association between the presence of Afirma suspicious nodule outside the index nodule and surgical intervention.
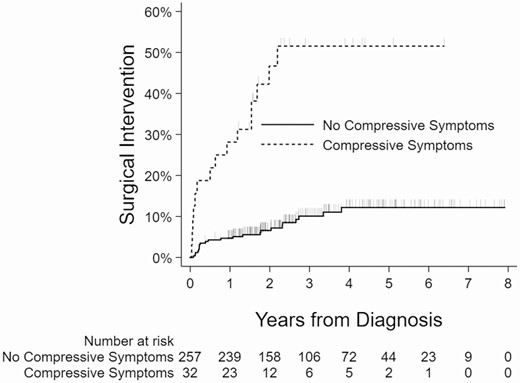
Kaplan-Meier curves showing association between compressive symptoms and surgical intervention.
False-negative cases
Among the study cohort of molecularly benign ITNs, the false-negative rate (FNR) was 1.7% with 5 cases of cancer, resulting in an NPV of 98.3%, presuming that all unresected molecularly benign nodules are truly benign. The FNR increased to 13.2% with an NPV of 86.8% when calculated based solely on surgically resected cases. The FNR was 6% (1/17) in surgically resected nodules ≥3 cm and 19% (4/21) in nodules <3 cm (P = 0.36). The FNR was 29% in nodules with other Afirma suspicious nodules and 10% in those without (P = 0.18). The FNR was 7% in patients with compressive symptoms and 17% in those without (P = 0.63).
For the 5 false-negative cases, after careful review of the ultrasound report, ultrasound images, and surgical pathologies, we were able to identify that cancer existed within the biopsied nodule. In 2 out of 5 cases, cancer occupied more than 50% of the biopsied nodule. The 4 cases with nodules <3 cm were all classified as papillary thyroid microcarcinoma (PTMC), with its size ranging from 0.3 to 0.9 cm. (Table 4). The size of index nodules in cases with PTMC were all below 2 cm, ranging from 1.1 to 1.8 cm; therefore, it is possible that the false-negative results in these cancers may have been due to sampling errors in nodules. The patient with PTMC with the nodule of 0.3 cm had a relatively suspicious sonographic appearance (TIRADS 4, ATA high) and underwent surgery after presenting with the development of metastatic level IV lymphadenopathy 20 months after the initial FNA. The ≥3 cm false-negative nodule case was a minimally invasive follicular thyroid carcinoma measuring 2.5 cm in a 3 cm nodule on final pathology. In malignant cases, the median duration between the initial FNA and surgery was 23 months (range 2-40 months). All patients with PTMC underwent total thyroidectomy, and a patient with follicular thyroid cancer (FTC) had a hemithyroidectomy. No patients underwent radioactive iodine treatment. After a median of 37 months (11-68 months) of follow-up, out of 4 patients with available follow-up data, no structural recurrence has been reported to date, and 75% of patients achieved an excellent response to therapy.
Summary of false-negative cases
| Age at Biopsy (Gender) | Bethesda Diagnosis | US Classification (ATA) (ACR-TIRADS score) | Nodule Size (cm) (maximum) | Reason for Surgery | Months Between FNA and Surgery | Surgical Pathology/Size of Tumor | AJCC |
|---|---|---|---|---|---|---|---|
| 62 (M) | FLUS | Low (3) | 1.3 | Afirma suspicious nodule other than index nodule | 2 | PTMC (0.6 cm) | T1aNxMx |
| 36 (F) | FLUS | Intermediate (5) | 3 | Compressive symptoms | 23 | FTC-MI (2.5 cm) | T2NxMx |
| 68 (M) | FLUS | High (4) | 1.1 | Development of lateral metastatic node | 27 | PTMC (0.3 cm) | T1aNx |
| 36 (F) | AUS | Low (3) | 1.8 | Increase in size | 40 | PTMC (0.5 cm) | T1aNxMx |
| 37 (M) | SFN | High (5) | 1.3 | Afirma suspicious nodule other than index nodule | 5 | PTMC (0.9 cm) | T1aNxMx |
Abbreviations: ACR, American College of Radiology; AJCC, American Joint Committee on Cancer; ATA, American Thyroid Association; AUS, atypia of undetermined significance; FNA, fine-needle aspiration; FLUS, follicular lesion of undetermined significance; FTC, follicular thyroid cancer; PTMC, micropapillary thyroid cancer; FTC-MI, minimally invasive follicular thyroid cancer, SFN, suspicious for follicular neoplasm; TIRADS, Thyroid Imaging Reporting and Data Systems.
Difference between GSC and GEC cohort
We compared the rate of surgery and FNR based on GEC testing (January 2012-July 2017) and GSC testing (July 2017-December 2018). There were 160 cases total for GEC and 129 cases total for GSC. The rate of surgery was 16.9% in GEC (27/160) and 8.5% in GSC (11/129) cohorts. The FNR was 3.1% (5/160) in the GEC group and 0% (0/129) in GSC group (P = 0.07), assuming unoperated cases were benign. If restricted to surgical cases, the FNR was 18.5% (5/27) in the GEC and 0% (0/11) in GSC cohorts (P = 0.29).
Sonographic features and risk of malignancy
When categorizing ATA sonographic classification by high-risk features versus very low, low, or indeterminate, nodules with high-risk appearance were associated with a higher rate of malignancy (11.8% vs 1.1%; P = 0.03). When stratifying TIRADS classification scores by 5 versus <5, there was an association between a score of T5 and a higher rate of malignant cases (11.1% vs 1.1%; P = 0.02) (Table 5). The same trend was seen when restricting to surgically resected cases only. (Table 6). Out of 15 patients with TIRADS 5 classification, 3 had surgery, with 2 demonstrating malignancy (PTMC and minimally invasive FTC). The remaining patient showed subacute granulomatous thyroiditis. Seven patients (47%) with TIRADS 5 classification had a repeat measurement available after 2 to 70 months from initial biopsy, and all cases were stable in size. There were 17 patients with ATA US classification of high risk. Three patients had surgery, with 2 demonstrating PTMC. The remaining patient had subacute granulomatous thyroiditis. Nine patients had a repeat measurement available after 2 to 70 months from initial biopsy. Nodules in 8 patients were stable in size, and 1 nodule showed growth based on the ultrasound conducted 23 months after the initial biopsy.
Malignancy by ultrasound riska
| Characteristic | Benign (n = 276)b | Malignant (n = 5) | P Value (Fisher Exact Tests) |
|---|---|---|---|
| ATA sonographic risk (%) | 0.03 | ||
| High | 15 (88.2) | 2 (11.8) | |
| Very low to intermediate | 261 (98.9) | 3 (1.1) | |
| TIRADS risk (%) | 0.02 | ||
| 5 | 13 (86.7) | 2 (11.1) | |
| <5 | 263 (98.9) | 3 (1.1) |
Abbreviations: ATA, American Thyroid Association; TIRADS, Thyroid Imaging Reporting and Data Systems.
a8 nodules with missing ultrasound risk were excluded.
bAfirma benign, non-operated nodules were considered as truly benign.
Malignancy by ultrasound risk, limited to surgical cases only
| Characteristic | Benign (n = 33)a | Malignant (n = 5) | P Value (Fisher Exact Tests) |
|---|---|---|---|
| ATA sonographic risk (%) | 0.04 | ||
| High | 1 (33.3) | 2 (66.7) | |
| Not high | 32 (91.4) | 3 (8.6) | |
| ACR-TIRADS risk (%) | 0.04 | ||
| 5 | 1 (33.3) | 2 (66.7) | |
| <5 | 32 (91.4) | 3 (8.6) |
Abbreviations: ACR, American College of Radiology; ATA, American Thyroid Association; TIRADS, Thyroid Imaging Reporting and Data Systems.
aOnly surgically confirmed benign cases were included.
Interval size changes/repeat cytology
Follow-up data were available in 194 patients with a mean follow-up period of 25.3 months (range 1-92 months). Of these, repeat measurements were available in 167 nodules, 57.8% of the original cohort. We calculated the nodule size change based on both dimensions (20% change in 2 dimensions) and nodule volume (50% volume change). Nodule size was stable in 66.5% of cases (n = 111) based on nodule volume and 76.0% (n = 127) based on dimensions. Size increased in 23.9% of nodules (n = 40) based on nodule volume and 15.0% (n = 25) based on dimensions. Nodule shrinkage occurred in 9.6% of nodules (n = 16) based on nodule volume and 9% (n = 15) based on dimensions. Repeat FNA was performed in 5.6% of nodule cases (n = 15). Of these, 40.0% of cases were benign (n = 6), 20.0% (n = 3) were AUS with 1 benign GEC result, 33.3% were SFN (n = 5), and 1 was an unsatisfactory result. For the patients with SFN, none underwent surgery, and 1 patient expired from a cause unrelated to their thyroid condition. Only 1 patient with second benign cytology went to surgery due to an interval increase in size, with a final benign pathology. The average follow-up period was 25.1 months (5-92 months, n = 156) in nonsurgical cases and 26.2 months (1-71 months, n = 38) in surgically resected cases.
Discussion
Although the diagnostic performance of molecular testing in ITNs is extensively studied (5, 15-18, 23, 36, 52), the data on the outcome of molecularly benign ITNs are limited (6, 15, 16, 24, 27). Angell et al (6) reported 95 ITN Afirma GEC benign nodules where surgery rate was 13.8% (13 nodules) (including 5 patients with nodules where recommendation was made immediately for surgical resection and 8 patients with nodules where surgery was performed during a median follow-up of 13 months). Deaver et al (16) reported 73 ITN Afirma benign nodules where the surgery rate was 6.8% (5 nodules) after a median follow-up of 46 months for Bethesda III nodules and a median follow-up of 62 months for Bethesda IV nodules. Our study is one of the largest in number and the longest in follow-up for these nodules with one of the highest numbers of surgically resected nodules (n = 38). Our findings demonstrate that younger age, larger nodule size, presence of another Afirma suspicious nodule outside of the index nodule, and compressive symptoms are associated with subsequent surgical intervention. This may guide initial counseling for patients presenting with thyroid nodules. For nodules with available follow-up data, approximately 66.5% of nodules stayed stable in size and 23.9% grew. The growth rate is higher than cytologically benign thyroid nodules from prior observational studies, which may indicate ITN/molecularly benign nodules are similar, but not identical, to cytologically benign nodules (4, 9, 53-57). These data, however, need to be taken with caution since they do not include Bethesda II (benign) nodules from our institution, and more data are needed to further assess differences in growth rate between cytologically benign nodules and molecularly benign ITNs. Data are limited on the rate of growth of ITN Afirma benign nodules. Angell et al (6) reported that 10/58 (17.2%) nodules grew in size during a median follow-up of 13 months when size was assessed by a >50% increase of volume of the nodule. The rate of growth was 5/58 (8.6%) if that was determined by >20% increase in 2 or more dimensions of the nodule. This present study has one of the largest number of nodules where nodule size measurements were available at follow-up, with 23.9% increased growth based on >50% volume increase in the nodule and 15% increased growth based on >20% change in 2 or more dimensions of nodules. In our cohort, 1 of 7 nodules (14.3%) that were resected due to growth was malignant. Therefore, further studies of cancer risk in growing molecularly benign ITNs are needed to determine appropriate follow-up strategies. The FNR was low at 1.7% (5 patients), assuming all unresected molecularly benign nodules are truly benign. This rate was higher at 13.2% if only surgically resected nodules were included. More studies with longer follow-up of unresected molecularly benign nodules will further inform which method of FNR calculation should be used. In these false-negative cases, no patients received radioactive iodine therapy, and out of 4 patients with available follow-up data, 75% achieved an excellent response to therapy after the surgery.
We have observed that the FNR was higher in nodules with high-risk ultrasound features according to ATA and ACR-TIRADS criteria (11.8% and 11.1%, respectively). A similar observation was demonstrated in previous studies of nodules with benign cytology (58). This observation should be further examined to determine if sonographic features may influence the decision to utilize molecular testing and the potential impact on the long-term follow-up.
The current study has several limitations. Due to its retrospective design, there is potential referral and sample bias. ITNs with either clinically or sonographically worrisome features likely had a higher probability of surgical removal without molecular testing and therefore would have been excluded from our study. We do not have data on cytologically benign (Bethesda II category) nodules for comparison. Finally, these data are limited to the Afirma GEC and GSC tests. We have not analyzed other commercially available molecular diagnostic tests (12-14, 59, 60).
There are several important strengths of our cohort: As mentioned previously, our dataset has one of the highest numbers of surgically resected cases published to date, which enables us to access histopathology results. Our cohort includes one of the highest in number and the longest duration of follow-up in molecularly benign ITNs. In addition, it includes data on sonographic features by 2 different endocrinologists who specialize in thyroid nodules and thyroid cancer using 2 different sonographic risk stratification systems. All cytology results were read by pathologists who were blinded to the results of the molecular testing since those were obtained subsequent to the cytology reading.
In summary, younger age, larger thyroid nodules, presence of an Afirma suspicious nodule outside the index nodule, and compressive symptoms are features associated with subsequent surgical intervention in molecularly benign ITNs. In addition, sonographically suspicious nodules were associated with higher rates of malignant histopathology in surgically resected cases. Molecularly benign ITNs had a higher percentage of nodule growth compared with cytologically benign nodules, which may indicate these entities are similar, but not identical. This information may guide management strategies and counseling for patients presenting with molecularly benign ITNs.
Abbreviations
- ACR-TIRADS
American College of Radiology Thyroid Imaging Reporting and Data Systems
- ATA
American Thyroid Association
- AUS
atypicia of undetermined significance
- CI
confidence interval
- FLUS
follicular lesion of undetermined significance
- FNA
fine-needle aspiration
- FNR
false-negative rate
- GEC
gene expression classifier
- GSC
gene sequencing classifier
- HR
hazard ratio
- ITN
indeterminate thyroid nodule
- PTMC
papillary thyroid microcarcinoma
- SFN
suspicious for follicular neoplasm
Acknowledgments
Financial Support: This work was in part supported by NIH funding to M.D.R.: (PO1CA124570 and P50 CA168505).
Additional Information
Disclosure Summary: The authors have nothing to disclose.
Data Availability
All data generated or analyzed during this study are included in this published article or in the data repositories listed in References.
References
