


Abstract
Hyperandrogenemia (HA) is a consistent reproductive phenotype in women with polycystic ovary syndrome (PCOS) and their relatives. Increased testosterone levels are present in premenarchal daughters of affected women (PCOS-d). Obese girls (OB-g) without a family history of PCOS also have peripubertal HA. The sources and significance of HA in these groups remains unknown.
11-oxygenated 19-carbon (C19) steroids are adrenally derived androgens that are elevated in hyperandrogenic disorders, including PCOS. We performed this study to test the hypothesis that peripheral serum 11-oxygenated steroids would differ in PCOS-d compared with OB-g suggesting distinct etiologies of HA in affected girls.
We compared peripheral serum 11-oxygenated steroid levels in 21 PCOS-d, 29 OB-g, and 17 lean control girls (LC) of comparable age at an academic medical center.
Body mass index (BMI) differed by design (P < 0.001). 11β-hydroxyandrostenedione, 11-ketoandrostenedione, and 11β-hydroxytestosterone levels did not differ between the groups. Compared with LC, PCOS-d and OB-g had similar elevations in 11-ketotestosterone (11KT) (analysis of variance [ANOVA] P = 0.03; PCOS-d vs LC, P = 0.04; OB-g vs LC, P = 0.05; PCOS-d vs OB-g, P = 0.97). In multivariate regression, 11KT levels were associated with DHEAS (P = 0.008), but not with BMI z score, breast Tanner stage, testosterone, anti-Müllerian hormone or sex hormone–binding globulin levels.
Circulating 11KT levels were similarly elevated in peripubertal PCOS-d and OB-g, suggesting an adrenal component of HA in both groups. We found that 11-oxygenated 19-carbon steroid profiles did not identify subtypes of HA girls.
Polycystic ovary syndrome (PCOS) is a complex genetic disorder affecting 7% to 15% of women of reproductive age (1). Hyperandrogenemia (HA) is the cardinal endocrine phenotype of PCOS (2). Approximately 40% of reproductive-age sisters of affected women have elevated total or bioavailable testosterone (T) levels (2). Furthermore, male (3) and female (2, 4, 5) first-degree relatives have HA. Daughters of affected women (PCOS-d) have evidence of increased global 5α-reductase activity in early childhood (6) and elevated T levels beginning in early puberty (5). Taken together, these observations suggest that there is a genetic susceptibility to HA in PCOS. This hypothesis is supported by our recent findings that rare variants in DENND1A, a key regulator of theca cell androgen biosynthesis, are present in ~50% of families of women with PCOS (7). In animal models, including nonhuman primates (8-10), androgen exposure in utero (8, 11), neonatally (12), or peripubertally (10) can result in metabolic and reproductive phenocopies of PCOS in offspring during reproductive maturity. Therefore, we propose that genetic variation resulting in HA contributes to PCOS pathogenesis through programming effects during critical developmental windows (6-8, 10-13).
Girls with obesity (OB-g) also have increased total and free T levels over the course of the pubertal transition (14). It has been hypothesized that hyperandrogenemic OB-g and PCOS-d will develop PCOS after puberty (15, 16) because of the putative role of androgens in the pathogenesis of PCOS. Thus, elevated T levels may be an early biomarker for PCOS (16), but no longitudinal studies have been performed to test this hypothesis. We have, however, found that the early reproductive changes of premenarchal PCOS-d and OB-g are distinct. While both PCOS-d and OB-g have similar degrees of HA by peripuberty, their anti-Müllerian hormone (AMH) levels differ, being increased in PCOS-d but not OB-g (13). This observation suggests that OB-g lack the changes in ovarian folliculogenesis typical of PCOS. It is also possible that the sources and mechanisms of HA in PCOS-d and OB-g differ.
11β-Hydroxyandrostenedione (11OHA4), 11-ketoandrostenedione (11KA4), 11β-hydroxytestosterone (11OHT), and 11-ketotestosterone (11KT) are adrenally derived 11-oxygenated 19-carbon (C19) steroids (Fig. 1). These steroids have recently been identified as biomarkers of hyperandrogenic disorders, including PCOS, premature adrenarche, and congenital adrenal hyperplasia (17-19). We sought to determine whether differences in these androgen levels would further discriminate PCOS-d from OB-g.
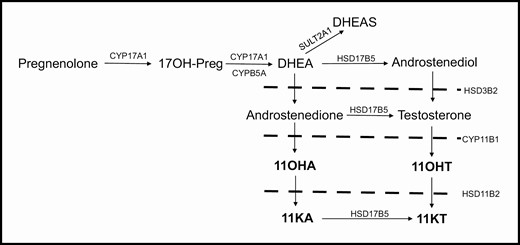
Schematic of androgen synthesis, highlighting the steroids of the 11-oxygenated pathway (bold). Abbreviations: 17OH-Preg, 17α-hydroxypregnenolone; CYP17A1, cytochrome P450 17α-hydroxylase/17,20-lyase; CYPB5A, cytochrome b5; DHEA, dehydroepiandrosterone; SULT2A1, sulfotransferase family 2A member 1; DHEAS, dehydroepiandrosterone sulfate; HSD17B5, 17β-hydroxysteroid dehydrogenase type 5; HSD3B2, 3β-hydroxysteroid dehydrogenase; CYP11B1, cytochrome P450 11β-hydroxylase; HSD11B2, 11β\ hydroxysteroid dehydrogenase type 2; 11OHA, 11β-hydroxyandrostenedione; 11OHT, 11β hydroxytestosterone; 11KA, 11ketoandrostenedione; 11KT, 11ketotestosterone.
Methods
Participants were recruited by contacting women who previously participated in our PCOS studies as well as reproductively normal control adult women through invitation letters. Potential PCOS and control women were also recruited by advertisements in local media and online. PCOS-d had a mother who fulfilled National Institutes of Health (NIH) criteria for PCOS (HA and oligo-anovulation with exclusion of other reproductive disorders (1)) as confirmed by us prior to the current study or by their personal physician. Mothers of OB-g and LC had regular menses every 27 to 35 days as well as no history of reproductive disorders and no signs or symptoms of androgen excess by validated questionnaire (2).
Premenarchal PCOS-d (n = 21), OB-g (n = 29), and LC (n = 17) aged 8 to 12 years with breast Tanner stage I-III were recruited. OB-g had the additional body mass index (BMI) inclusion criterion of BMI greater than or equal to the 95th percentile and LC had a BMI criterion of BMI less than the 85th percentile; PCOS-d of any BMI were included. All girls were in good health and not taking any medications known to alter reproductive hormone metabolism or glucose homeostasis for at least 1 month prior to the study. All OB-g, LC, and 15 PCOS-d were studied at Ann & Robert H Lurie Children’s Hospital; 6 additional PCOS-d were studied at Penn State Health Milton S. Hershey Medical Center. The Institutional Review Boards of the Feinberg School of Medicine, Northwestern University, Ann & Robert H Lurie Children’s Hospital, and Penn State University School of Medicine approved this study. Written informed consent was obtained from a parent of all girls, and written assent was obtained from each girl aged 12 years or older prior to participation. Selected clinical and biochemical phenotypes of part of this cohort have been previously reported (5, 13, 20).
A physical exam, including breast Tanner staging determined by visualization and palpation, was performed by a single pediatric endocrinologist at Ann & Robert H Lurie Children’s Hospital, and by a trained study coordinator at Hershey Medical Center-Penn State. A fasting early morning blood sample was collected for measurement of T, sex hormone–binding globulin (SHBG), estradiol, AMH, dehydroepiandrosterone sulfate (DHEAS), androstenedione, 11OHA4, 11KA4, 11OHT, and 11KT levels. Blood was allowed to clot, and serum was separated, aliquoted, and stored at −80 °C until assay.
Assays
T levels were analyzed by liquid chromatography–tandem mass spectrometry (LC-MS/MS) (Brigham Research Assay Core, Boston, MA, sensitivity 2 ng/dL, intra-assay coefficient of variation [CV] 9.0% at 16 ng/dL, interassay CV 15.8% at 12 ng/dL) (21). SHBG (22) and DHEAS (3) were measured by chemiluminescence immunoassay (University of Virginia Ligand Core, SHBG sensitivity 2 nmol/L, intra-assay CV 2.7%, interassay CV 5.2%; DHEAS sensitivity 150 ng/mL, intra-assay CV 5.4%, interassay CV 6.5%). Bioavailable T was calculated as reported (23). 11OHA4, 11KA4, 11OHT, 11KT, and androstenedione were measured by LC-MS/MS as previously described (University of Michigan, 11OHA4 sensitivity range from 0.32 ng/dL for androstenedione to 3.13 ng/dL for 11KT, intra-assay and interassay CV < 12% near the lower limit of quantification for all steroids) (24).
Statistical analysis
Data were log or square root–transformed when necessary to achieve homogeneity of variance. Categorical variables were compared by Fisher exact test. Differences in endpoint variables were analyzed by ANOVA with Tukey post hoc testing. As a secondary analysis, to determine if differences in endpoint variables were affected by subtle differences in pubertal stage, analysis of covariance (ANCOVA) adjusting for breast Tanner stage was performed with Tukey post hoc testing. Multivariable regression was performed to determine the factors most significantly associated with 11KT levels. Statistical analyses were performed with SAS 9.4 (SAS Institute, Inc., Cary, NC). Data are reported as the mean ± standard deviation with the level of alpha set at 0.05.
Results
Age was similar between PCOS-d, OB-g, and LC, but BMI differed between the groups by design, being highest in OB-g, followed by PCOS-d, who were also heavier than LC (Table 1). There was a small but statistically significant difference in breast Tanner stage between the groups, with PCOS-d having a slightly less mature breast Tanner stage compared with OB-g and LC. However, estradiol levels did not differ significantly between the groups, suggesting that pubertal development was similar (Table 1). Indeed, pubic hair Tanner Stage was also similar between the groups (Table 1).
Baseline Clinical and Biochemical Characteristics
| PCOS-d | OB-g | LC | P | PCOS-d vs OB-g | PCOS-d vs LC | OB-g vs LC | |
|---|---|---|---|---|---|---|---|
| Age (years) | 10 ± 1 (n = 21) | 10 ± 1 (n = 29) | 10 ± 1 (n = 17) | 0.77 | |||
| Breast Tanner Stage a | 52% I | 38% I | 24% I | 0.005 b | |||
| 48% II | 17% II | 35% II | |||||
| 45% III | 41% III | ||||||
| Pubic Hair Tanner Stage a | 65% I | 38% I | 24% I | 0.11b | |||
| 25% II | 41% II | 59% II | |||||
| 5% III | 21% III | 12% III | |||||
| 5% IV | 6% IV | ||||||
| BMI Percentile | 86.2 ± 15.8 | 97.7 ± 2.4 | 48.0 ± 20.1 | ||||
| BMI z score | 1.4 ± 0.7 | 2.2 ± 0.4 | 0.0 ± 0.6 | <0.0001 | <0.0001 | <0.0001 | <0.0001 |
| Total T (ng/dL) | 10 ± 5 (n = 21) | 10 ± 6 (n = 29) | 9 ± 9 (n = 17) | 0.29 | |||
| SHBG (nmol/L) | 46 ± 24 (n = 21) | 28 ± 17 (n = 29) | 72 ± 23 (n = 17) | <0.0001 | 0.002 | 0.004 | <0.0001 |
| Bioavailable T (ng/dL) | 4 ± 3 (n = 21) | 5 ± 4 (n = 29) | 2 ± 3 (n = 17) | 0.001 | 0.76 | 0.01 | 0.001 |
| DHEAS (ng/mL) | 625 ± 391 (n = 21) | 639 ± 403 (n = 29) | 515 ± 389 (n = 15) | 0.39 | |||
| Androstenedione (ng/dL) | 22 ± 15 (n = 21) | 32 ± 27 (n = 29) | 22 ± 15 (n = 17) | 0.18 | |||
| Estradiol (pg/mL) | 13 ± 7 (n = 17) | 21 ± 16 (n = 18) | 13 ± 7 (n = 14) | 0.07 | |||
| AMH (ng/mL) | 2.2 ± 1.0 (n = 17) | 1.2 ± 0.8 (n = 29) | 3.6 ± 3.2 (n = 14) | 0.007 | 0.007 | 0.68 | 0.08 |
Data are mean ± standard deviation. P values listed from ANOVA unless otherwise noted. Statistical assessment for differences between the groups performed only on BMI z score. The bold values just indicate the P values below the significance threshold of 0.05.
Abbreviations: AMH, anti-Müllerian hormone; BMI, body mass index; DHEAS, dehydroepiandrosterone sulfate; LC, lean control; OB-g, girls with obesity; PCOS-d, daughters of mothers with polycystic ovary syndrome; SHBG, sex hormone–binding globulin; T, testosterone.
aPercentage of subjects included in each group are noted. bFisher exact test. BMI percentiles reported for descriptive purposes only.
Total T levels did not differ between the groups, while bioavailable T levels were similarly increased in PCOS-d and OB-g compared with LC (Table 1). SHBG levels were lowest in OB-g, and also lower in PCOS-d compared to LC (Table 1). There were no significant differences between the groups in DHEAS or androstenedione levels (Table 1).
11OHA4, 11KA4, and 11OHT levels did not differ between the groups (Fig. 2). 11KT was comparable between PCOS-d and OB-g, and it was significantly higher than in LC (Fig. 2). All analyses were repeated adjusting for differences in breast Tanner Stage, with no differences in significant findings (data not shown).
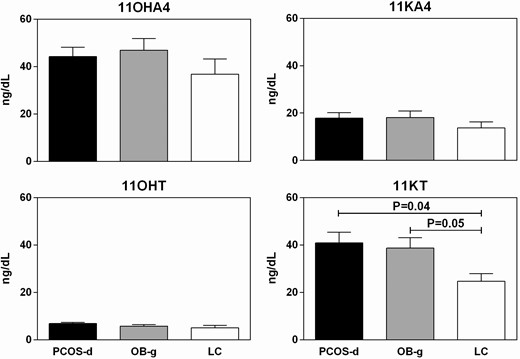
11OHA (upper left panel, ANOVA P = 0.25), 11KA (upper right panel, ANOVA P = 0.39), and 11OHT (lower left panel, ANOVA P = 0.11) levels did not differ between the groups. 11KT levels differed between the groups, with PCOS-d and OB-g having similarly increased levels compared with LC (lower right panel, ANOVA P = 0.03, LC vs OB-g P = 0.05, PCOS-d vs OB-g P = 0.97, PCOS-d vs LC P = 0.04). Unadjusted means and SEM pictured.
Multivariable regression was performed to determine the factors most significantly associated with 11KT levels using the following variables: BMI z score, breast Tanner stage, T, DHEAS, AMH, and SHBG. Of these, the only variable that was significantly associated with 11KT levels was DHEAS (P = 0.008).
Discussion
In this premenarchal cohort, 11-oxygenated androgen levels did not distinguish HA in PCOS-d compared with OB-g. 11KT levels were similarly increased in PCOS-d and OB-g compared with LC. 11KT levels were significantly associated with the adrenal androgen, DHEAS, but not with T, SHBG, or AMH levels. These findings suggest that 11KT levels reflected an adrenal component of HA in both groups. The 11-oxygenated 19-carbon steroid profiles did not identify subtypes of HA girls.
11OHA4, 11KA4, 11OHT, and 11KT are adrenally derived 11-oxygenated androgens (Fig. 1) (25). While the existence of these androgens has been recognized for some time, they were previously thought to be adrenal metabolites without significant biologic function (25). However, in recent years, development of LC-MS/MS platforms for more accurate measurement of these steroids has renewed interest in studies of their biologic relevance to hyperandrogenic disorders (25). 11KA4 and 11OHA4 have minimal androgenic activity (19) but these steroids are precursors of 11OHT and 11KT, which are more potent androgens (19). Functional studies suggest that 11KT has androgenic activity comparable to that of T, while the androgenic activity of 11OHT is about 50% less (19). Previous studies in reproductively normal adult women suggest that these steroids represent a significant portion of the total androgen pool and do not fluctuate over the course of the menstrual cycle (26). Unlike DHEAS, circulating levels of the 11-oxygenated steroids remain stable with increasing age into the postmenopausal years (24, 27). Despite the in vitro evidence of potent androgenic activity of ketotestosterone, a recent study in a large community-based cohort of adult women found that 11KA and 11KT were not associated with self-assessed modified Ferriman-Gallwey scores (28). Additional studies are needed to assess the clinical significance of circulating 11-oxygenated C19 steroid levels in the general population.
11-oxygenated androgens have been implicated in hyperandrogenic disorders, including congenital adrenal hyperplasia, premature adrenarche, and PCOS. A previous study (18) in males and females with classic 21-hydroxylase deficiency found that 11-oxygenated androgens levels were 3- to 4-fold higher than those in a control group of subjects of similar age and sex. Further, 11KT was the predominant circulating bioactive androgen in women and children with 21-hydroxylase deficiency, with levels approximately 2-fold higher than T levels (18). There is evidence that 11-oxygenated C19 steroid levels are also increased in PCOS. One study (29) reported increased circulating levels of 11OHT and another study (17) found increased levels of 11OHA4, 11KA4, 11OHT, and 11KT in women with PCOS. These studies also suggest that the proportionate contribution of the 11-oxgenated steroids to the total circulating androgen pool was higher in women with PCOS compared with control women, suggesting that these steroids are important contributors to hyperandrogenemia in PCOS (17).
A previous study (19) in premenarchal girls investigated the contribution of 11-oxgenated C19 steroids to hyperandrogenemia in premature adrenarche. While DHEAS has been the conventional biomarker for premature adrenarche, DHEAS in an inactive androgen precursor, and it is unlikely to mediate the clinical phenotype of premature pubarche (19). Conversely, 11KT is the dominant bioactive androgen in children with normal and premature adrenarche, with circulating levels exceeding those of T by 2- to 3-fold (19). These findings suggest that 11KT is an important mediator of the premature adrenarche clinical phenotype (19).
There are limited data on the impact of obesity on circulating 11-oxygenated C19 steroid levels. Studies in reproductively normal adult women (26, 27) suggest that BMI is negatively associated with 11KA4, positively associated with 11OHT, and not significantly associated with 11OHA4 or 11KT. These findings suggest 17β-hydroxysteroid dehydrogenase activity may be increased in adipose tissue in obese women (27). In children with premature adrenarche, 11KT levels were higher in girls with BMI over the 85th percentile compared with normal weight girls (19). However, this difference was not observed in age-matched controls without premature adrenarche (19). Therefore, additional studies are needed to clarify the impact of body weight on circulating 11-oxygenated C19 steroid levels.
In our study, 11KT was significantly associated with DHEAS levels, but not with BMI z score, breast Tanner stage, T, AMH, or SHBG levels in multivariate analysis. 11KT levels were associated with DHEAS levels, suggesting that 11KT levels are a general marker of adrenal HA. However, we were unable to identify additional hormones relevant to PCOS that were associated with increased 11KT levels.
Our study had several limitations. Despite their nearly identical age, breast Tanner stage differed slightly but significantly between the groups, being less mature in PCOS-d compared with OB-g and LC. However, estradiol levels and pubic hair Tanner stage were similar, suggesting pubertal stage was comparable. The accuracy of our assessment of breast Tanner stage may have been limited by the high prevalence of obesity in our cohort (30). However, our significant results did not differ after statistical adjustment for breast Tanner stage in our secondary analysis, suggesting that our findings were not accounted for by subtle differences in pubertal stage in our cohort. We also did not assess 5α-reduced androgens, including flux through the backdoor pathway and 5α-reduced 11-oxygenated androgens, which might derive from a 11KT or from 11-oxygenated C21-precursors (31). Further studies are needed to investigate the significance of these alternative pathways of androgen metabolism in hyperandrogenic PCOS-d and OB-g.
In summary, we found that 11KT levels were similarly elevated in premenarchal PCOS-d and OB-g compared with LC. These findings suggest that adrenal androgen production is a contributor to the androgenic phenotype in both groups of HA girls. Furthermore, 11-oxygenated androgens profiles did not differentiate OB-g from PCOS-d. Accordingly, other biomarkers, such as AMH (13), will be investigated in longitudinal studies seeking to identify biomarkers for PCOS risk.
Abbreviations
- 11KA4
11-ketoandrostenedione
- 11KT
11-ketotestosterone
- 11OHA4
11β-hydroxyandrostenedione
- 11OHT
11β-hydroxytestosterone
- AMH
anti-Müllerian hormone
- ANOVA
analysis of variance
- BMI
body mass index
- CV
coefficient of variation
- DHEAS
dehydroepiandrosterone sulfate
- HA
hyperandrogenemia
- LC
lean control
- LC-MS/MS
liquid chromatography–tandem mass spectrometry
- OB-g
girls with obesity
- PCOS
polycystic ovary syndrome
- PCOS-d
daughters of mothers with polycystic ovary syndrome
- SHBG
sex hormone–binding globulin
- T
testosterone
Acknowledgments
Financial Support: This research was supported by P50 HD044405 (AD), R01 HD085227 (AD), K08 DK109116 (AFT), K12 HD055884 (LT) and K23 HD090274 (LT) from the National Institutes of Health (NIH). Some hormone assays were performed at the University of Virginia Center for Research in Reproduction Ligand Assay and Analysis Core that is supported by U54 HD28934 from the Eunice Kennedy Shriver National Institute of Child Health and Human Development. Research reported in this publication was also supported, in part, by the National Institutes of Health’s National Center for Advancing Translational Sciences, Grant Number UL1TR000150 and National Institute of Diabetes and Digestive and Kidney Diseases.
Additional Information
Disclosure Summary: The authors report no potential conflicts of interest relevant to this article.
Data Availability
The datasets generated during and/or analyzed during the current study are not publicly available but are available from the corresponding author on reasonable request.
References
