


Abstract
The etiology of central diabetes insipidus (CDI) in children is often unknown. Clinical and radiological features at disease onset do not allow discrimination between idiopathic forms and other conditions or to predict anterior pituitary dysfunction.
To evaluate the evolution of pituitary stalk (PS) thickening and the pattern of contrast-enhancement in relation with etiological diagnosis and pituitary function.
We enrolled 39 children with CDI, 29 idiopathic and 10 with Langerhans cell histiocytosis (LCH). Brain magnetic resonance images taken at admission and during follow-up (332 studies) were examined, focusing on PS thickness, contrast-enhancement pattern, and pituitary gland size; T2-DRIVE and postcontrast T1-weighted images were analyzed.
Seventeen of 29 patients (58.6%) with idiopathic CDI displayed “mismatch pattern,” consisting in a discrepancy between PS thickness in T2-DRIVE and postcontrast T1-weighted images; neuroimaging findings became stable after its appearance, while “mismatch” appeared in LCH patients after chemotherapy. Patients with larger PS displayed mismatch more frequently (P = 0.003); in these patients, reduction of proximal and middle PS size was documented over time (P = 0.045 and P = 0.006). The pituitary gland was smaller in patients with mismatch (P < 0.0001). Patients with mismatch presented more frequently with at least one pituitary hormone defect, more often growth hormone deficiency (P = 0.033).
The PS mismatch pattern characterizes patients with CDI, reduced pituitary gland size, and anterior pituitary dysfunction. The association of mismatch pattern with specific underlying conditions needs further investigation. As patients with mismatch show stabilization of PS size, we assume a prognostic role of this peculiar pattern, which could be used to lead follow-up.
Central diabetes insipidus (CDI) is generally due to a deficiency of arginine vasopressin caused by the destruction or degeneration of neurons originating in the hypothalamic supraoptic and paraventricular nuclei (1, 2). The underlying etiologies of these lesions include germ cell tumors, inflammatory/autoimmune conditions, vascular diseases, trauma, metastases, midline cerebral malformations and Langerhans cell histiocytosis (LCH) (2-5). CDI is the most frequent central nervous system manifestation of LCH, occurring in 10% to 50% of all patients (6, 7). Genetic defects in arginine vasopressin synthesis—inherited as autosomal dominant, autosomal recessive, or X-linked recessive traits—are rare (8). Recent advances in imaging techniques have shed new light on CDI, thus making the idiopathic form less common, by showing that the majority of patients with idiopathic CDI have pituitary stalk (PS) involvement (9). The process underlying PS thickening in “idiopathic” CDI is not understood. The identification of arginine vasopressin antibodies (AVPc-Abs) in children with idiopathic CDI, LCH, or central nervous system tumors—particularly germinoma—cannot be considered a reliable marker of autoimmune CDI in children (10, 11); thus, to ensure a definitive diagnosis, close clinical, biochemical, and magnetic resonance imaging (MRI) follow-up is needed in patients who have CDI without an identifiable cause (10-14).
The PS size at CDI presentation is variable and can change over time (2, 9, 15, 16). In 2 large pediatric series of idiopathic CDI patients, PS thickening was found in approximately 50% to 60% (9, 17). Spontaneous evolution of thick PS was similar in reports from unchanged (30%) to reduction (30%-50%) or further enlargement (10%-20%). Attention should be paid to LCH, since long-term outcomes of bone or lung involvement are highly suggestive of primary PS-related LCH leading to CDI (9), while pituitary biopsy should be reserved for selected cases.
MRI follow-up is recommended for all patients with an enlarged PS every 6 months for the first 2 years after the diagnosis of CDI. The administration of contrast medium should always be performed in the evaluation of CDI. The inclusion of high-resolution heavily T2-weighted sagittal images (ie, driven equilibrium [DRIVE], constructive interference in steady-state [CISS] or fast imaging employing steady-state acquisition [FIESTA] sequences) in the routine MRI protocol is highly recommended, since they provide more detailed information on the suprasellar compartment (18, 19); in particular T2-DRIVE sequence is extremely precise and reliable for the evaluation of PS size (18). Additional and important diagnostic information can be obtained by fast-framing MRI, which provides information on the blood supply of the hypothalamic-pituitary area through measurement of enhancement times (20); abnormal vascularization in the hypophyseal arteries and portal system and pituitary vasculopathy were hypothesized in a subset of patients with CDI, who appear to be at risk for development of multiple hormone deficiency.
Based on these considerations, sagittal T2-DRIVE sequences and conventional SE T1- and TSE T2-weighted imaging were used to evaluate the progression of PS thickening and its association with postcontrast pattern and with the risk of deterioration of anterior pituitary function. The aim of our study was to evaluate the relationship between the appearance of “mismatch pattern,” a novel MRI feature, and clinical and endocrine findings in children and adolescents with CDI and pituitary stalk involvement, with or without anterior pituitary gland dysfunction.
For this purpose, we analyzed the size of the proximal, middle, and distal tract of the PS, at onset and during follow-up, in both T2-DRIVE and T1 postcontrast sequences.
Materials and Methods
Subjects and study design
We retrospectively evaluated all consecutive pediatric patients (younger than 18 years at diagnosis) referred to our Institution from 2001 to 2017 for CDI, who underwent biochemical and neuroradiological follow-up equal to or greater than 2 years, with pre- and postcontrast MRI including T2-DRIVE sequences, available at least every 6 months. Patients with CDI caused by mass lesions such as germinomas or craniopharyngiomas, posttraumatic events, and genetic forms were excluded (Fig. 1).
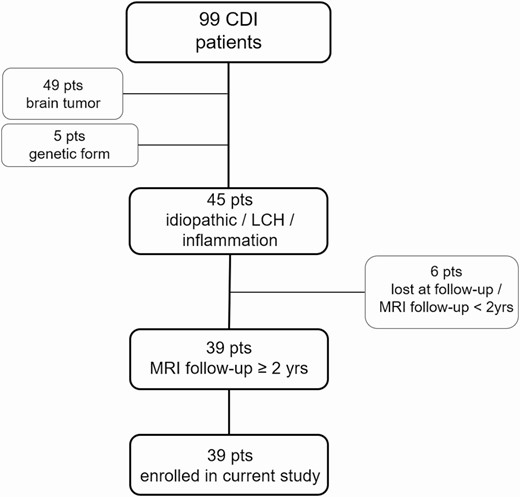
Patient selection and enrollment flow chart.
This study was approved by the local ethics committee and consent was obtained from caregivers at the time of diagnosis. In addition, informed consent was obtained as part of current procedures and regulations before gadolinium administration.
We examined data from 39 patients (18 females and 21 males) with CDI (29 with idiopathic form, 10 with specific etiological diagnosis of LCH), who were followed at the Endocrinology Unit, Giannina Gaslini Institute, University of Genova, from February 2001 to April 2019.
The diagnosis of CDI was obtained through a water deprivation test and all patients were treated with desmopressin acetate (synthetic analogue of vasopressin) and, in case of multiple pituitary hormone defects, with hormone replacement therapy; 9 patients with LCH (90.0%) underwent chemotherapy.
The diagnosis of hormonal defects was carried out according to methods previously reported (9).
Growth hormone (GH) deficiency (GHD) was diagnosed when growth parameters were met and GH response was lower than 8 μg/L after 2 different stimulation tests (21). Only the defects of GH, thyrotropin (thyroid-stimulating hormone; TSH), and adrenocorticotropic hormone (ACTH) were considered, because, due to the age of the subjects, the number of reliable data was not sufficient to evaluate luteinizing hormone (LH) and follicle-stimulating hormone (FSH) deficiency. Patients with severe ACTH deficiency (peak cortisol lower than 16 µg/dL after low-dose ACTH or lower than 20 µg/dL after insulin tolerance test) (22), and not those with partial deficiency (peak cortisol from 16 to 22 after low-dose ACTH test), were considered for analysis.
Neuroradiological protocol and analysis
MRI studies were performed on a 1.5-T superconductive system (Intera Achieva; Philips, Best, the Netherlands) using an 8-channel parallel imaging head coil; all patients received routine clinical MRI scans including 3-mm-thick sagittal spin echo (SE) T1-weighted images, 3-mm-thick coronal TSE T2-weighted images and 0.6-mm-thick sagittal heavily T2-weighted DRIVE images of the sellar region.
Following gadolinium compound bolus administration (0.1 mmol/kg, macrocyclic ionic agent), 3-mm-thick sagittal and coronal SE T1-weighted images were acquired in all patients. MRI data were blindly analyzed by the same neuroradiologist (G.M.) and independently validated by a second operator (A.R.).
In all MRI studies (baseline and follow-up) we measured the PS size in the sagittal plane, drawing a line perpendicular to the axis of the major stem at 3 levels: proximal PS (just below the median eminence), midpoint, and distal (near its insertion on the pituitary gland). Measurements were achieved on our Picture Archiving and Communicating System (Vue PACS workstation, Carestream Health, Rochester, NY, USA) on the sagittal T2-DRIVE and postcontrast T1-weighted sequences. Postcontrast T1-weighted sequence measurements were considered for this analysis. The workstation’s electronic calipers were used to measure the size of the PS; thickness was defined as normal when its size was between 1.0 and 3.0 mm (reference values up to 2.0 mm at distal portion and up to 3.0 mm at the level of median eminence) (18, 23, 24).
In all neuroimaging studies, we also compared the thickness of the PS on sagittal T2-DRIVE sequences and the corresponding degree of contrast-enhancement on postcontrast sagittal T1-weighted images. We defined as “mismatch pattern” a novel finding that was detected during our analysis of follow-up MRI studies. Mismatch pattern consists in a discrepancy between the PS size measures at T2-DRIVE (without contrast) and after contrast-enhancement (PS diameter on T2-DRIVE greater than contrast-enhancement thickness on postcontrast T1). According to our extensive experience, the mismatch pattern does not appear in control subjects with normal pituitary stalk size and without CDI.
In addition, the length, height, width, and volume (length × height × width/2) of the anterior pituitary (AP) were evaluated. The height and length of the pituitary gland were measured on sagittal precontrast T1-weighted images, whereas width was measured on T2-weighted coronal images. Presence or absence of the physiological posterior pituitary T1 hyperintensity was evaluated in all studies.
Statistical methods
Descriptive statistics of the enrolled patients were calculated; qualitative data were reported in terms of absolute frequencies and percentages; quantitative data were reported in terms of medians and first and third quartiles. Normality of distributions was evaluated by means of the Shapiro-Wilk test.
Comparison of frequencies was performed by the chi-square test or Fisher exact test (in case of expected frequencies less than 5). The diagnostic accuracy of the presence of mismatch with respect to the occurrence of GHD was measured; sensitivity, ie, the number of mismatch positives divided by the number of all patients with GH deficiency (probability of being true positive), and specificity, ie, the number of mismatch negatives divided by the number of all patients without GHD (probability of being true negative), were calculated and reported.
Comparison of quantitative variables between 2 groups of patients (eg, mismatch yes/no) was done by means of the nonparametric Mann-Whitney U test. Quantitative data during follow-up were analyzed by means of the nonparametric repeated measurements Analysis of Variance (Friedman test).
Correlation between 2 quantitative variables was evaluated by means of the nonparametric Spearman’s Rank correlation coefficient (RSpearman). A correlation coefficient ranging from 0.80 to 1.00 was considered “very strong,” while between 0.60 and 0.79 was considered “strong,” between 0.40 and 0.59 “moderate,” and <0.40 “absent,” according to Swinscow (25).
All statistical tests were 2-sided and a P value less than 0.05 was considered as statistically significant. The statistical software “Statistica” (version 9, StatSoft Corporation, Tulsa, OK, USA) was used for all the bivariate analysis and the software “Stata” (version 11, Stata Corporation, College Station, TX, USA) was used to calculate the Shapiro-Wilk and the Fisher exact test (in the case of 2 by n crosstabulations).
Results
Patients
Patients’ clinical and demographic features are reported in Table 1. The median duration of clinical, biochemical, and neuroimaging follow-up was 5.28 years (first-third quartile, 3.48-7.77).
Description of Study Patients
| N=39 | |
|---|---|
| Male, n (%) | 21 (53.8%) |
| Female, n (%) | 18 (46.2%) |
| Age at diagnosis, median years (1st-3rd quartile) | 7.2 (4.7-10.5) |
| Age at first MRI, median years (1st-3rd quartile) | 8.3 (4.7-10.5) |
| Idiopathic CDI, n (%) | 29 (74.4%) |
| LCH, n (%) | 10 (25.6%) |
| Mismatch: yes, n (%) | 21 (53.8%) |
| Mismatch: no, n (%) | 18 (46.2%) |
Abbreviations: CDI, central diabetes insipidus; LCH, Langerhans cell histiocytosis; MRI, magnetic resonance imaging.
Neuroimaging
MRI data were available for the first 4 examinations in 39 patients (100%); of them, 33 subjects performed the first brain MRI within the first 6 months after disease onset.
At first MRI study, median disease duration was 0.09 years (first-third quartile, 0.06-0.61); at second MRI, median disease duration was 0.64 years (first-third quartile, 0.50-1.60); median disease duration at third MRI was 3.16 years (first-third quartile, 2.42-4.62). Physiological posterior pituitary hyperintensity was absent in all patients.
At CDI onset, the PS was normal in 12 patients (30.8%) and thickened in 27 (69.2%), while anterior pituitary volume was normal in 14 patients (35.9%), increased in 17 patients (43.6%), and reduced in 8 patients (20.5%).
During follow-up, a number of patients displayed greater PS diameter on T2-DRIVE than contrast-enhancement thickness on postcontrast T1 (Figs 2 and 3). This pattern, defined “mismatch,” was present in 17 patients (58.6%) with idiopathic CDI and in 4 patients (40.0%) with LCH; in LCH patients, mismatch was always found following chemotherapy treatment. At the appearance of mismatch, in 21 patients (100%) the PS was thickened and in 20 patients (95.2%) the anterior pituitary showed abnormal dimensions. The median age at mismatch appearance was 8.14 years (first-third quartile 6.52-11.02); the median disease duration was 2.77 years (first-third quartile 1.06-3.77), while the median thickness of the mismatch was 1.30 mm (first-third quartile 1.10-1.50). The mismatch pattern has never been observed in more than 100 children with central precocious puberty, with pineal gland cysts, or with tumors involving midline structures (ie, hypothalamic gliomas, hamartomas, pinealoblastomas, and isolated pineal gland germ cell tumors) (G.M., personal experience).
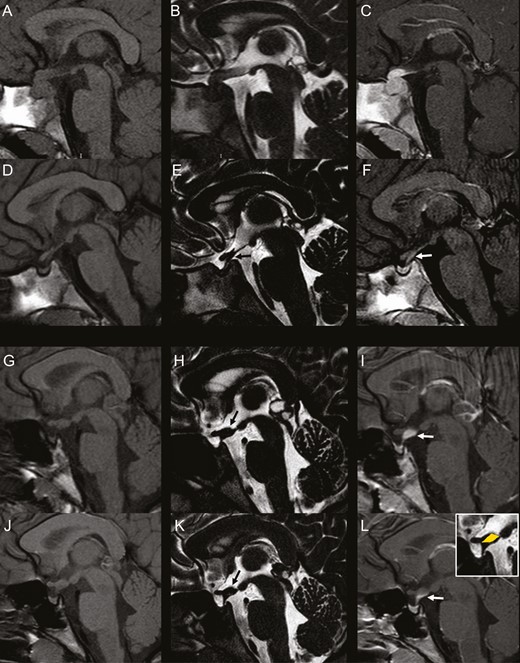
Presence and absence of the “mismatch pattern” in idiopathic central diabetes insipidus. Left column: sagittal 3-mm-thick pre-contrast T1-weighted images; Middle column: sagittal 0.6-mm-thick T2-DRIVE sequence; Right column: sagittal 3-mm-thick postcontrast T1-weighted images. A-F: 6-year-old girl. Baseline MRI (A-C) shows enlargement of the pituitary gland with absent bright spot and thickened pituitary stalk with homogeneous contrast-enhancement. Follow-up MRI at 1 month (D-F) demonstrates marked spontaneous reduction in size of the gland and thinning of the stalk with linear contrast-enhancement matching the thickness of the stalk on T2-DRIVE. There is concomitant marked reduction in size of the pituitary gland. G-L: 10-year-old girl. Baseline MRI (G-I) shows pathologic thickening of the median eminence with amputation of the infundibular recess (black arrow, H) and concomitant thickening of the proximal pituitary stalk with homogeneous contrast-enhancement. There is lack of visibility of the bright spot. Incidentally noted is a cystic pineal gland. Follow-up MRI (J-L) at 1 year shows stable thickening of the median eminence and proximal pituitary stalk on T2-DRIVE (black arrow, K) with a pattern of mismatch on postcontrast imaging. postcontrast T1-weighted image reveals only a linear contrast-enhancement along the posterior margin of the proximal pituitary stalk without enhancement of the median eminence thickening. Stable dimensions of the pituitary gland. There is reduction in size of the pineal gland cyst.
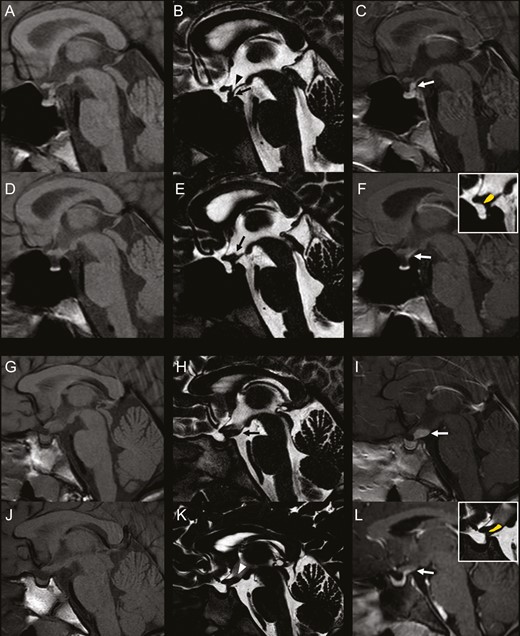
“Mismatch pattern” in idiopathic central diabetes insipidus and Langerhans cell histiocytosis. Left column: sagittal 3-mm-thick precontrast T1-weighted images; Middle column: sagittal 0.6-mm-thick T2-DRIVE sequence; Right column: sagittal 3-mm-thick postcontrast T1-weighted images. A-F: 13-year-old boy with idiopathic central diabetes insipidus. Baseline MRI (A-C) shows absent bright spot and pathologic thickening at the midportion of the stalk with homogeneous contrast-enhancement. The infundibular recess is clearly visible. Follow-up MRI at 4 years demonstrates thinning of the stalk midportion with thickening of the median eminence and lack of visibility of the infundibular recess (black arrow, E). postcontrast T1-weighted image shows a mismatch pattern at this level. There concomitant reduction in size of the gland. G-L: 9-year-old girl with Langerhans cell histiocytosis. Baseline MRI (G-I) shows pathologic thickening of the median eminence and of the proximal pituitary stalk with homogeneous contrast-enhancement. There is lack of visibility of the bright spot. Follow-up MRI (J-L) performed at 1 year since the end of chemotherapy shows evident reduction of the median eminence and proximal pituitary thickening, with lack of visibility of the infundibular recess on T2-DRIVE (white arrowhead, K). Postcontrast T1-weighted image shows a mismatch pattern at this level. There is reduction in size of pituitary gland with persistent lack of visibility of the bright spot.
Associated hormonal deficiencies and comorbidities
During follow-up, 18 patients (46.2%) developed GH deficiency, 9 patients (23.1%) TSH deficiency, and 3 patients (7.7%) ACTH deficiency. Twenty-one patients (53.8%) had no pituitary defects, 9 patients (23.1%) had only 1 defect, 6 patients (15.4%) had 2 defects, and 3 patients (7.7%) had 3 associated anterior pituitary defects.
Of the 21 patients who developed mismatch, 8 patients (38.1%) were never diagnosed with anterior pituitary defects, while 8 patients (38.1%) developed 1 defect, 4 (19%) patients had 2 defects, and 1 patient (4.8%) had 3 hormonal defects (Table 2). In the 13 patients with mismatch that developed anterior pituitary hormone defects, at least 1 defect was diagnosed before mismatch appearance in 10 patients (76.9%).
Sociodemographic and Clinical Characteristics of the 2 Groups of Study Patients (with/without mismatch)
| Mismatch: Yes N = 21 | Mismatch: No N = 18 | P | OR | 95% CI | |
|---|---|---|---|---|---|
| Male, n (%) | 12/21 (57.1%) | 9/21 (42.9%) | 0.66# | 1.3 | 0.4-4.7 |
| Female, n (%) | 9/18 (50.0%) | 9/18 (50.0%) | |||
| Idiopathic CDI, n (%) | 17/29 (58.6%) | 12/29 (41.4%) | 0.46§ | 2.1 | 0.5-9.2 |
| LCH, n (%) | 4/10 (40.0%) | 6/10 (60.0%) | |||
| GHD, n (%) | |||||
| yes | 13/18 (72.2%) | 5/18 (27.8%) | 0.033# | 4.2 | 1.1-16.4 |
| no | 8/21 (38.1%) | 13/21 (61.9%) | |||
| TSHD, n (%) | |||||
| yes | 5/9 (55.6%) | 4/9 (44.4%) | 1.00§ | 1.1 | 0.2-4.9 |
| no | 16/30 (53.3%) | 14/30 (46.7%) | |||
| ACTHD, n (%) | |||||
| yes | 1/3 (33.3%) | 2/3 (66.7%) | 0.59§ | 0.4 | 0.0-4.8 |
| no | 20/36 (55.6%) | 16/36 (44.4%) | |||
| No. of anterior pituitary defects: | |||||
| at least 1 | 13/18 (72.2%) | 5/18 (27.8%) | 0.033# | 4.2 | 1.1-16.4 |
| none | 8/21 (38.1%) | 13/21 (61.9%) | |||
| Pathological anterior pituitary size: | |||||
| yes | 20/32 (62.5%) | 12/32 (37.5%) | 0.035§ | 10.0 | 1.1-93.4 |
| no | 1/7 (14.3%) | 6/7 (85.7%) |
Abbreviations: ACTHD, adrenocorticotropic hormone deficiency; CDI, central diabetes insipidus; GHD, growth hormone deficiency; LCH, Langerhans cell histiocytosis; TSHD, thyrotropin (thyroid-stimulating hormone) deficiency.
# P: Chi-square test; §P: Fisher exact test.
Specifically, among patients with idiopathic CDI, 12 patients (41.4%) had GH deficiency, 4 patients (13.8%) TSH deficiency, 1 patient (3.5%) ACTH deficiency. Among patients with LCH, 6 patients (60.0%) had GH deficiency, 5 patients (50.0%) TSH deficiency, and 2 patients (20.0%) ACTH deficiency. (Table 3)
Anterior Pituitary Defects in Patients with Idiopathic CDI and LCH
| Anterior pituitary hormone defect | P | ||
|---|---|---|---|
| Yes | No | ||
| GHD | |||
| Idiopathic CDI | 12/29 (41.4%) | 17/29 (58.6%) | 0.46§ |
| LCH | 6/10 (60.0%) | 4/10 (40.0%) | |
| TSHD | |||
| Idiopathic CDI | 4/29 (13.8%) | 25/29 (86.2%) | 0.032§ |
| LCH | 5/10 (50.0%) | 5/10 (50.0%) | |
| ACTHD | |||
| Idiopathic CDI | 1/29 (3.4%) | 28/29 (96.6%) | 0.16§ |
| LCH | 2/10 (20.0%) | 8/10 (80.0%) | |
| No. of anterior pituitary defects | |||
| None | At least 1 | ||
| Idiopathic CDI | 17/29 (58.6%) | 12/29 (41.4%) | 0.46§ |
| LCH | 4/10 (40.0%) | 6/10 (60.0%) | |
Abbreviations: ACTHD, adrenocorticotropic hormone deficiency; CDI, central diabetes insipidus; GHD, growth hormone deficiency; LCH, Langerhans cell histiocytosis; TSHD, thyrotropin (thyroid-stimulating hormone) deficiency.
§ P: Fisher’s exact test.
Gonadal axis defects or early activation were not analyzed in this study due to the low number of patients who had reached suitable age for evaluation, as stated in “Methods”—Tanner stage was I in 30/39 patients (76.9%) at disease onset, II in 2 patients (5.1%), III in 1 patient (2.6%), IV in 3 patients (7.7%), and V in 3 patients (7.7%). Two patients developed central hypogonadism over time, while 1 female patient (2.6%) was treated for precocious puberty.
Findings in patients with or without the “mismatch pattern”
Statistical analysis did not reveal a significant relationship between gender and presence/absence of mismatch: 57.1% of males and 50.0% of females presented the mismatch pattern (Table 2).
The presence/absence of mismatch was not significantly associated with a specific etiological diagnosis, either. A statistically significant association was found between the presence/absence of mismatch and the diagnosis of GH deficiency (P = 0.033) (Table 2), in particular GH deficiency was present in 72.2% of patients with mismatch. Sensitivity and specificity of mismatch for GHD prediction were 0.72 and 0.62, respectively. However, no significant relationship was found between the presence/absence of mismatch and the development of TSH or ACTH deficiency.
There was a significant association between the number of anterior pituitary defects and the presence/absence of mismatch (P = 0.033): 72.2% of patients with mismatch had at least one anterior pituitary defect. There was also a significant association between the alteration of the anterior pituitary volume and the presence of mismatch: pituitary gland presented abnormal dimensions in 62.5% of patients with mismatch (P = 0.035) (Table 2).
In idiopathic CDI, there was no significant difference in age at disease onset and age during follow-up in subjects with or without the mismatch pattern. Even in the LCH group, we found no difference in age at disease onset in subjects with or without the mismatch pattern.
In patients with the mismatch pattern, a significant decrease in the thickness of the proximal and medium PS was observed during follow-up (P = 0.045 and P = 0.006, respectively); on the other hand, patients without mismatch did not show a significant variation in proximal and medium PS thickness over time (P = 0.28 and P = 0.42, respectively) (Fig. 4). A significant decrease in the thickness of distal PS was observed, over time, in both groups of patients with and without mismatch (P < 0.0001 and P = 0.011, respectively) (Fig. 4).
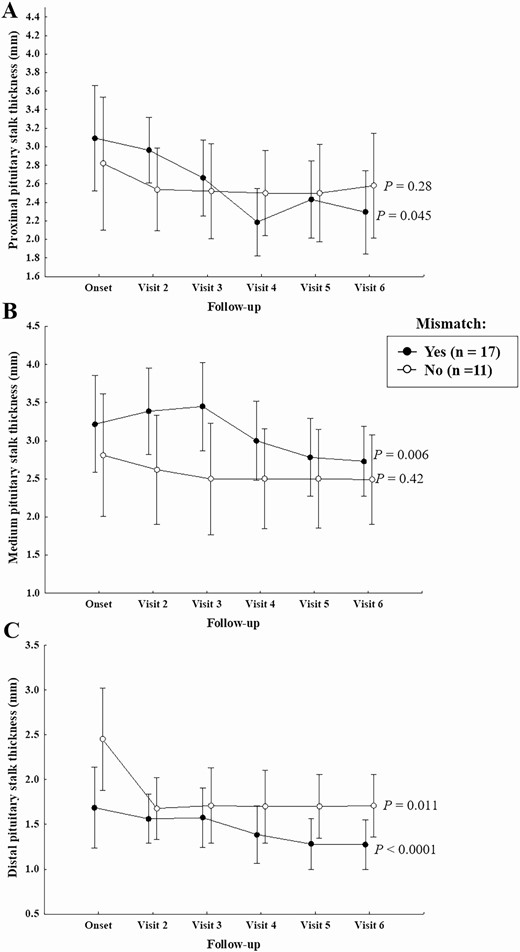
Proximal, medium, and distal (on postcontrast T1 images) PS thickness during follow-up in patients with and without mismatch.
A significant interaction effect between the 2 factors under study (effect of mismatch and time) on the thickness of distal PS was observed; in other words, distal PS thickness shows a different trend over time in patients with mismatch pattern if compared with patients without this finding. For this reason, charts were studied separately in patients with and without mismatch.
In patients who developed mismatch, the maximum PS thickness was, in general, significantly greater than that of patients without mismatch (P = 0.003) (Fig. 5). Analyzing the 2 diagnostic categories separately, this significance was maintained only in the group with idiopathic CDI (P = 0.028), while statistical significance was not achieved in patients with LCH (P = 0.07), probably because of the low number of subjects with LCH that were included in this study. The percentage of subjects with PS thickening was significantly different in the 2 groups (mismatch yes/no) only at the 18-month follow-up (P = 0.03) (Table 4).
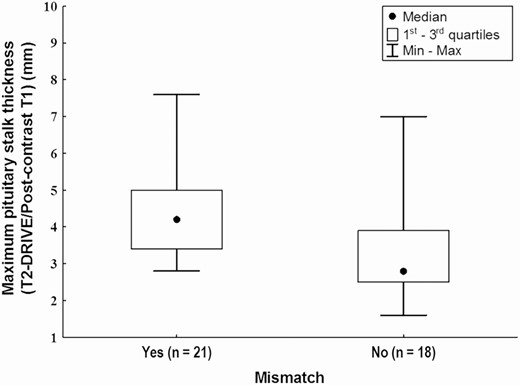
Maximum pituitary stalk thickness (on postcontrast T1 images) in patients with and without mismatch (Mann-Whitney U test, P = 0.003).
Percentage of Patients with Pituitary Stalk Thickening in Patients With or Without Mismatch at Disease Onset and During Follow-Up
| Mismatch | P | ||
|---|---|---|---|
| Yes | No | ||
| Pituitary stalk thickening | |||
| At onset: yes | 17/21 (81.0%) | 10/18 (55.6%) | 0.09# |
| no | 4/21 (19.0%) | 8/18 (44.4%) | |
| At 6 months: progressed | 7/21 (33.3%) | 2/18 (11.1%) | 0.30§ |
| unchanged | 10/21 (47.6%) | 11/18 (61.1%) | |
| decreased | 4/21 (19.0%) | 5/18 (27.8%) | |
| At 12 months: progressed | 5/21 (23.8%) | 2/18 (11.1%) | 0.30§ |
| unchanged | 14/21 (66.7%) | 16/18 (88.9%) | |
| decreased | 2/21 (9.5%) | 0/18 (0.0%) | |
| At 18 months: progressed | 1/21 (4.8%) | 0/18 (0.0%) | 0.03§ |
| unchanged | 13/21 (61.9%) | 17/18 (94.4%) | |
| decreased | 7/21 (33.3%) | 1/18 (5.6%) | |
# P: Chi-square test; §P: Fisher exact test.
Regarding the PS size at disease onset, although there was a greater percentage of patients with PS thickening in the mismatch group, compared to the no-mismatch group, statistical significance was not reached (P = 0.09).
In patients who developed mismatch, the anterior pituitary showed significantly smaller cranio-caudal and antero-posterior diameters than those of patients without mismatch (both with P < 0.0001) (Fig. 6). Only for the cranio-caudal diameter, a significant decrease was observed over time, in particular, between disease onset and subsequent follow-up visits (P = 0.026) (Fig. 6).
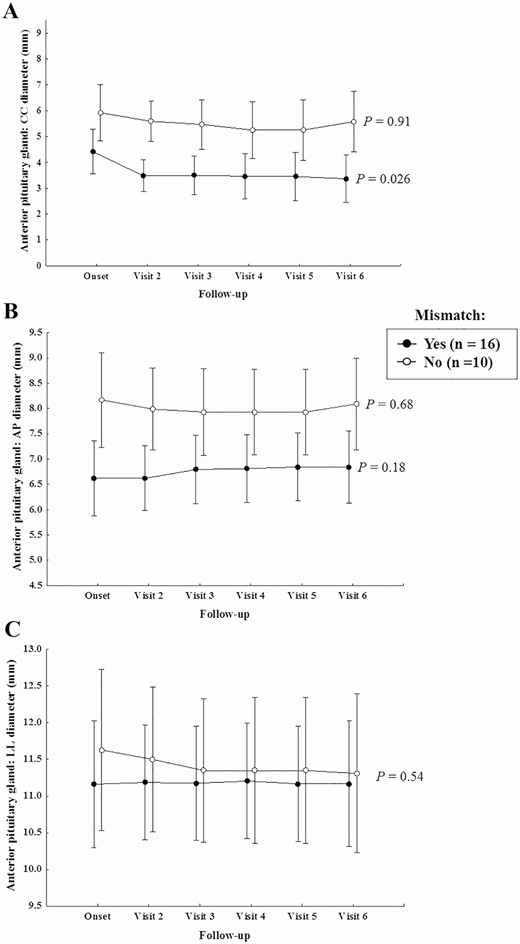
Anterior pituitary CC, AP and LL diameters during follow-up in patients with and without mismatch.
In patients with idiopathic CDI without mismatch, the cranio-caudal diameter of the anterior pituitary was strongly correlated with age (rSpearman = 0.71); this correlation was absent in patients with mismatch (rSpearman = 0.25) (Fig. 7).
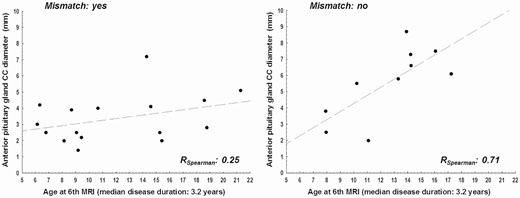
Correlation between age and anterior pituitary CC diameter at 3 years follow-up in patients with and without mismatch.
Discussion
The aim of this study was to evaluate the relationship between the appearance of the “mismatch pattern,” an MRI feature that has never been described before, and the clinical and endocrine outcomes in children and adolescents with CDI and pituitary stalk involvement with subsequent anterior pituitary gland dysfunction. This peculiar neuroimaging finding was recognized by our neuroradiologists in a subgroup of patients with CDI and PS thickening, but its interpretation was largely uncertain. Thus, the questions of why some patients displayed this unusual pattern and whether it could have any role in determining anterior pituitary size reduction and dysfunction was raised.
The MRI of the hypothalamic-pituitary region was well-characterized and the size of proximal, middle, and distal tract of the PS and the diameters of the anterior pituitary were evaluated both on T2-DRIVE and T1 postcontrast sequences in serial MRIs performed at disease onset and during the first 3-year follow-up. In a previous study, more than 80% of our patients with CDI and pituitary stalk involvement showed at least 1 anterior pituitary defect within the first 2 years after the diagnosis, suggesting that the time period of 3 years is reliable for anterior pituitary function investigation (9).
The results of the present study showed that the morphology of the PS, and especially its proximal tract, changed over time by reducing its size; and this fact was more evident and significant in patients who developed the mismatch pattern. In particular, all patients with idiopathic CDI and those with LCH and mismatch underwent a stabilization of PS size after the appearance of such pattern; in the latter patients, the mismatch appeared only after treatment.
Patients with the mismatch pattern showed a significantly greater pituitary stalk thickness than patients without mismatch, while the thickness of the PS remained rather constant over time in those who did not present mismatch. In particular, patients with mismatch showed a greater PS thickness at the first MRI and the following 2 visits at 6 and 12 months, with a clear reduction in PS thickness at 18 months; such reduction was maintained, without significant variations, even in the 2 subsequent visits at 24 and 30 months.
The relationship between the mismatch pattern and anterior pituitary size and function deserves consideration. Our study showed a significant reduction in the cranio-caudal and antero-posterior diameters of anterior pituitary gland in patients with the mismatch pattern, a finding that was present both at disease onset and during subsequent follow-up visits. In a previous study, we reported a significant association between PS thickening and GH deficiency (2), while similarly in this study, we also found a significant association between the mismatch pattern and the development of GH deficiency or the presence of at least one anterior pituitary defect, a finding that was independent of age. More than 70% of our patients presenting mismatch displayed GH deficiency, although we did not find any association between mismatch and TSH or ACTH deficiency. In our opinion, this result could be explained by the short-term follow-up, as TSH and ACTH function may develop over longer follow-up (9), while a significant association between PS thickening and GH deficiency was reported in our previous longitudinal studies mainly within the first 2 years after the diagnosis of CDI (2, 9). Sensitivity and specificity values for mismatch to predict GHD, although not optimal (0.72 and 0.62), enable us to confirm the association between the 2 conditions. The significant association between mismatch and GHD—if confirmed by further studies—could imply that GH–IGF-I axis investigations should be considered earlier and/or more often in patients with CDI, mismatch, and reduction of height velocity.
There was no significant relationship between the presence of the mismatch pattern and gender: mismatch was fairly evenly distributed in male (57.1%) and female patients (50.0%). The change in morphology of the PS and its subsequent stabilization during follow-up, in patients presenting the mismatch pattern, suggest that this novel neuroimaging feature may be an expression of a scarring—nonenhancing—lesion, a sort of “fibrotic post-inflammatory reaction,” which becomes more evident over time and which may firstly affect anterior pituitary anatomy and function and secondly lead to a stabilization of neuroimaging—and of underlying disease.
In patients who did not develop the mismatch pattern, we observed a strong correlation between age and cranio-caudal diameter of the anterior pituitary. This correlation was not evident in patients with mismatch, as though the physiological effect of age on the growth of the gland—ie, progressive increase of pituitary volume as the child approaches puberty—was lost in these subjects.
The long latency time between CDI onset and diagnosis of LCH or other specific conditions (in particular oncological diseases) requires a close clinical, biochemical, and neuroradiological follow-up of all patients with CDI, even if it has been classified as idiopathic at onset. Since patients and their families undergo considerable medicalization, with relative costs for patients, families, and society, and they experience psychological implications related to the uncertainty of the diagnosis, the identification of novel prognostic neuroimaging markers are essential. Therefore, it would be crucial to have imaging biomarkers that could identify which patients with “idiopathic” CDI may develop a pathology and therefore require closer follow-up, and/or markers that identify patients who are at lower risk for life-threatening, treatable conditions such as LCH. The mismatch pattern could represent such a marker, if our data are confirmed by larger studies.
This novel finding and the homogeneous clinical, endocrine, and neuroimaging work-up in a single academic center in the absence of major methodological issues represent the strengths of the study. The absence of prior research reports, the retrospective observational nature of the study, and the duration of the disease follow-up are, in our opinion, limitations that cannot impact our conclusions.
In summary, serial MRIs provide new information by identifying the “mismatch pattern” affecting the pituitary stalk and anterior pituitary anatomy and function in patients with CDI of different etiology. The mismatch pattern is very likely generated as the result of chronic local inflammation of the proximal pituitary stalk and represents a marker of anatomical stabilization of pituitary stalk lesion, which is significantly associated with anterior pituitary defects. This could be an advance toward discrimination between patients with different prognoses. It remains to be confirmed, by extending the study over time and by increasing the number of patients, if the mismatch pattern in patients with CDI may allow to identify patients with idiopathic forms, thus excluding the presence of LCH—or other specific conditions—a priori.
Abbreviations
- ACTH
adrenocorticotropic hormone
- CDI
central diabetes insipidus
- FSH
follicle-stimulating hormone
- GH
growth hormone
- GHD
growth hormone deficiency
- LCH
Langerhans cell histiocytosis
- LH
luteinizing hormone
- MRI
magnetic resonance imaging
- PS
pituitary stalk
- TSH
thyroid-stimulating hormone
Acknowledgments
We are grateful for the Department of Neuroscience, Rehabilitation, Ophthalmology, Genetics, Maternal and Child Health (DINOGMI), University of Genova—a Department of Excellence—for the support in the several steps leading to the approval and publishing the study.
Financial Support: Nothing to disclose.
Author Contributions: D.B. collected clinical and neuroradiological data, drafted and revised the manuscript. F.N. designed the study, examined the clinical phenotypes of the patients, took care of patients, drafted and revised the manuscript.G.M. designed the study, performed neuroradiological studies, collected neuroradiological data, performed data analysis and revised the manuscript. D.T., M.S., A.R. performed neuroradiological studies, collected neuroradiological data, and revised the manuscript. A.P. performed the statistical analyses. A.E.M.A., D.F., M.S., M.C., H.T., T.C., M.L., A.C. followed the patients and revised the manuscript. N.D.I., G.P., A.I. followed the patients, reviewed and revised the manuscript. M.M. designed the study, drafted and revised the manuscript. All authors approved the final manuscript as submitted and agree to be accountable for all aspects of the work.
Additional Information
Disclosure Summary: The authors report no competing interests.
Data Availability
The authors confirm that the data supporting the findings of this study are available within the article. Data were generated at Giannina Gaslini Institute. Additional individual patient data will be made available on request to accord with data privacy statement signed by all patients.
References
Author notes
These authors have equally contributed to this study.
