


Abstract
An important clinical feature of Cushing’s syndrome (CS) is proximal muscle myopathy caused by glucocorticoid induced protein metabolism. However, interindividual differences cannot be explained solely by the pure extent of hypercortisolemia.
To evaluate the effects of glucocorticoid receptor (GR) polymorphisms (BclI, N363S, ER22/23EK and A3669G), which influence peripheral glucocorticoid sensitivity on muscular function in endogenous CS.
205 patients with proven endogenous CS (128 central, 77 adrenal) from 3 centers of the German Cushing’s Registry and 125 subjects, in whom CS was ruled out, were included. All subjects were assessed for grip strength (via hand grip dynamometer) and performed a chair-rising test (CRT). DNA samples were obtained from peripheral blood leukocytes for GR genotyping.
In patients with active CS, normalized handgrip strength of the dominant and nondominant hand was higher in A3669G minor allele than in wildtype carriers (P = .006 and P = .021, respectively). CS patients in remission and ruled-out CS showed no differences in handgrip strength regarding A3669G minor allele and wildtype carriers. Male CS patients harboring the ER22/23EK wildtype presented lower hand grip strength than minor allele carriers (P = .049 dominant hand; P = .027 nondominant hand). The other polymorphisms did not influence handgrip strength. CRT showed no differences regarding GR polymorphisms carrier status.
Handgrip strength seems to be more susceptible to hypercortisolism in A3669G wildtype than in A3669G minor allele carriers. This might partially explain the inter-individual differences of glucocorticoid-induced myopathy in patients with endogenous CS. ER22/23EK polymorphism seems to exert sex-specific differences.
Endogenous Cushing’s syndrome (CS) is a rare disease characterized by autonomous and inappropriate cortisol secretion due to pituitary/ectopic tumors (leading to adrenocorticotropic hormone (ACTH)-dependent CS) or adrenal adenomas (leading to ACTH-independent CS) (1). Irrespective of the underlying disorder, the concomitant glucocorticoid excess leads to characteristic clinical symptoms including severe proximal myopathy (2–4) predominantly in the lower limbs (5). While 42% to 83% of patients with CS are pertinently affected (6, 7), others do not experience any impairment at all. Of note, myopathy is associated with increased mortality and reduced quality of life (8–11). Nevertheless, previous studies have shown that interindividual differences cannot be explained solely by the extent of hypercortisolemia (12).
Glucocorticoids induce myopathy by affecting protein metabolism via different signaling pathways. Their main effect seems to be by induction of type 2 muscle fiber atrophy and upregulation of protein catabolism by activating cellular proteolysis, for example, via the ubiquitine-proteasome, the lysosomal, and the calcium-dependent system (5, 13–16). Glucocorticoids further hinder muscle growth by inhibiting protein synthesis (14, 15). In addition, other pathways are already known or currently under investigation (5).
Glucocorticoids bind to the intracellular glucocorticoid receptor (GR) that is coded by the GR gene NR3C1 on chromosome 5q31-32 (17). After glucocorticoid binding the GR enters the nucleus where it binds to the DNA and regulates transcription or transrepression of specific target genes (18). The GR response to glucocorticoids is modified by GR gene polymorphisms (19). The two polymorphisms N363S (rs56149945) and BclI (rs41423247) have been shown to increase glucocorticoid sensitivity, leading to an increased prevalence of abdominal obesity, a higher body mass index, dyslipidemia, and increased levels of morning serum cortisol (12, 20–24). On the contrary, the ER22/23EK (rs 6189/rs6190) and A3669G (rs6198) polymorphisms are associated with decreased glucocorticoid sensitivity and relative glucocorticoid resistance resulting in a more favorable metabolic profile with a lower body mass, waist-to-hip ratio, and low-density lipoprotein (LDL) cholesterol levels despite higher serum cortisol concentrations (25, 26).
With the knowledge that glucocorticoids induce myopathy, it is intriguing that GR polymorphisms might lead to differences in muscle strength. Consequently, our study aimed to investigate the influence of GR polymorphisms on muscle strength in patients with endogenous CS.
Methods
Study population
We performed a multicenter cross-sectional study, including 205 patients with endogenous CS as part of the German Cushing Registry at three study centers (Munich, n = 141; Berlin, n = 37; Würzburg, n = 27). For establishing the diagnosis of CS or determining the successful biochemical remission of the disease after surgery, we performed biochemical testing according to recent guidelines (ie, midnight salivary cortisol, 24-hour urinary free cortisol, and serum cortisol after 1 mg dexamethasone) (27, 28). In addition, 125 control subjects, who presented in Munich with the suspicion for CS but in whom the disorder was excluded by three negative screening tests according to the Endocrine Society Clinical Practice Guidelines (28), were enrolled and labeled as “ruled-out CS.” Patients with ectopic or exogenous CS were excluded from analysis.
All patients and controls gave written informed consent. The protocol was approved by the ethics committee of the participating centers.
Measurement of muscle strength
For quantifying muscle strength, we performed two tests that also have been shown to be related to mortality and quality of life (10, 29, 30). Patients had to undergo a chair-rising test (CRT) as an indicator for fitness of the proximal muscles of the lower extremities. For this test, they had to rise from a chair with a height of 45 cm and to sit down again five times in a row without supportive help of the arms. The time needed for this procedure was recorded. The upper extremities were evaluated via grip strength measurement of both hands, using a JAMAR® dynamometer (Patterson Medical, Nottinghamshire, UK) (31). This test was performed three times on each side, and the mean value was calculated. The stronger performing side was defined as the dominant hand. Subsequently, we calculated the “normative grip strength” by standardizing the values to age and gender according to the JAMAR® dynamometer’s manual (31).
Laboratory measurements
Laboratory testing was performed as described previously by Berr et al. (32). In brief, measurement of serum cortisol and plasma ACTH was performed with solid phase antigen-linked technique (cortisol: Liaison®, DiaSorin, Saluggia, Italy) and chemiluminescence immunoassay (ACTH: Liaison®, DiaSorin). Within- and between-assay coefficients of variation were below 5% and 7% (cortisol) and below 13% (ACTH), respectively. Urinary-free cortisol measurement was performed with chemiluminescence immunoassay (ADVIA Centaur®, Siemens) or radioimmunoassay with within- and between-assay coefficients variations below 7%. Salivary cortisol was measured by a luminescence immunoassay (IBL, Hamburg, Germany) with within- and between-assay coefficients variations below 9% and 6%, respectively.
Blood samples and genotyping
For genetic analyses, DNA was extracted using a QIAamp® DNA Mini Kit (QIAGEN GmbH, Hilden, Germany) from 200 µl whole blood of each patient. Purified DNA was analyzed by gel electrophoresis to check integrity, quantified using a NanoDrop Microvolume Spectrophotometer (ThermoFisher Scientific, Waltham, MA, US), which provides the 280:260 ratio, and adjusted to a concentration of 30 ng/µl.
For detection of the single nucleotide polymorphisms for BclI, N363S and ER22/23EK of the GR a conventional polymerase chain reaction (PCR) followed by a restriction fragment length polymorphism was carried out according to a slightly modified protocol recently described by Trementino et al. (24). Briefly, 90 ng of genomic DNA was amplified using an Eppendorf Mastercycler (Eppendorf, Hamburg, Germany) according to the following PCR regime: initial denaturation at 94°C for 4 minutes, 35 cycles of denaturation at 94°C for 30 seconds, annealing at 55°C for BclI, 58°C for N363S, 56°C for ER22/23EK for 30 seconds, extension at 72°C for 30 seconds, and a final extension at 72°C for 7 minutes. DNA was subsequently hydrolyzed using restriction enzymes BclI (for BclI), MnlI (for ER22/23EK), and MluCI (for N363S) by New England Biolabs (Ipswich, MA, US). For the detection of BclI, the forward primer (5’-TGCTGCCTTATTTGTAAATTCGT-3’) and reverse primer (5’-AAGCTTAACAATTTTGGCCATC-3’) were used, resulting in a PCR fragment with a length of 335 bases, and for the detection of single nucleotide polymorphism (SNP) ER22/23EK, the forward primer (5’-CGGAGTTAACTAAAAGGTTC-3’) and reverse primer (5’-GGGTTTTATAGAAGTCCATC-3’) were used, resulting in a PCR fragment of 225 bases length. To determine the N363S polymorphism DNA was amplified with the forward primer (5’-AGTACCTCTGGAGGACAGAT-3’) and the reverse primer (5’-TACCATTCTTAAGAAACAGA-3’), resulting in a PCR fragment with a length of 248 bases.
For SNP A3669G genotyping a real-time PCR using the predesigned SNP genotyping assay (C___8951023_10) was used. Fifty nanograms of genomic DNA were amplified using a BioRad iCycler (Hercules, California, US) according following conditions: initial denaturation at 95°C for 10 minutes, 40 cycles of denaturation at 95°C for 15 seconds, annealing at 60°C for 1 minute. Post PCR-read allelic discrimination plot revealed allele specificity. All samples were analyzed twice.
Due to the low prevalence of mutant alleles heterozygous and homozygous mutant alleles were grouped as “minor allele carriers” for further analyses. Wildtype alleles are further specified as “wildtype.” All SNPs were investigated for a possible correlation to muscle strength in CS patients and “ruled-out CS” subjects.
Statistical analysis
Statistical analysis was carried out using IBM SPSS Statistics 25. Normal distribution was tested by the Shapiro–Wilks test, P > .05. Nonnormally distributed values are presented as median and range; normally distributed values are presented as mean ± standard deviation. For comparison of nonnormally distributed values, we performed a Mann–Whitney U test; normally distributed values were compared by using a t-test for independent samples. For testing of nominally scaled variables, the χ2 test and the Kruskal–Wallis test were applied. Differences were considered statistically significant when P < .05.
Results
Clinical and biochemical characteristics of CS patients and ruled-out CS subjects are presented in Table 1. Ruled-out CS subjects were younger and more obese but had a lower waist-to-hip and waist-to-arm ratio than CS patients, whereas the latter presented a more unfavorable metabolic profile than controls (as indicated by higher levels of hemoglobin A1C [HbA1c] and lipids).
Clinical characteristics and laboratory parameters of patients with CS and of patients with ruled-out CS
| Patients with CS (n = 205) | Rule-out CS (n = 125) | P-value | |
|---|---|---|---|
| Female sex (%) | 75.6 | 68.0 | .132 |
| Age (years) at examination | 51 (16–80) | 36 (16–74) | .001 |
| BMI (kg/m2) | 27.2 (18.1–54.9) | 34.2 ± 9.1 | .001 |
| Hip circumference (cm) | 103 (81–192) | 116 (83–174) | .001 |
| Waist circumference (cm) | 98.0 (66–159) | 108 ± 21.1 | .001 |
| Waist-to-hip-ratio | 0.94 (0.51–2.36) | 0.91 ± 0.11 | .048 |
| Upper arm circumference (cm) | 29.1 (21–43) | 33.5 ± 5.3 | <.001 |
| Waist-to-arm-ratio | 3.28 (2.03–5.46) | 3.22 ± 0.44 | .040 |
| Systolic BP (mmHg) | 136 (92–214) | 135 (91–212) | .609 |
| Diastolic BP (mmHg) | 85.3 (60–127) | 86.9 ± 11.5 | .602 |
| Hypertension (%) | 62 | 53.7 | .140 |
| Diabetes mellitus (%) | 22 | 13.2 | .051 |
| Grip strength (%) of dominant hand | 90.6 (23.1–140) | 89.4 ± 25.3 | .479 |
| Grip strength (%) of non-dominant hand | 93.8 ± 28.5 | 90.2 ± 28.0 | .253 |
| Chair-rising test (sec) | 8 (3–42) | 7 (3–21) | <.001 |
| Potassium (mmol/L) | 4.2 (2.6–5.3) | 4.1 (3.4–5.2) | .032 |
| Calcium (mmol/L) | 2.43 ± 0.10 | 2.42 ± 0.09 | .354 |
| HbA1c (%) | 5.6 (4.6–10.4) | 5.3 (4.5–13.9) | <.001 |
| Total Cholesterol (mg/dL) | 209 (95–378) | 198 (125–311) | <.001 |
| Triglycerides (mg/dL) | 120 (28–790) | 121 (26–565) | .723 |
| HDL (mg/dL) | 60.4 ± 16.8 | 50.0 (23–167) | <.001 |
| LDL (mg/dL) | 123 (41–293) | 119 ± 34.6 | .042 |
Normally distributed values are presented as mean ± standard deviation. Non-normally distributed values are presented as median with range. P < 0.05 was considered statistically significant
Abbreviations: BMI, body mass index; BP, blood pressure; CS, Cushing’s syndrome; HDL, high-density lipoprotein; LDL, low-density lipoprotein.
The frequency of GR SNPs (BclI, N363S, ER22/23EK, and A3669G) showed no difference between patients with CS and ruled-out CS (Table 2) and no difference between overt CS and CS in remission (Table 2).
Distribution of GR SNP in patients with CS and in patients with CS ruled out as well as in the subgroups overt CS and CS in remission
| GR polymorphism (distribution in %) | Patients with CS (n = 205) | Rule-out CS (n = 125) | p-value | overt CS (n = 99) | CS in remission (n = 106) | P-value |
|---|---|---|---|---|---|---|
| BclI | ||||||
| wildtype | 43.9 | 35.2 | .287 | 40.4 | 47.2 | .413 |
| heterozygous mutant | 47.8 | 56.0 | 52.5 | 43.4 | ||
| homozygous mutant | 8.3 | 8.8 | 7.1 | 9.4 | ||
| ER22/23EK | ||||||
| wildtype | 95.1 | 92.8 | .380 | 96.0 | 94.3 | .591 |
| heterozygous mutant | 4.9 | 7.2 | 4.0 | 5.7 | ||
| homozygous mutant | 0 | 0 | 0 | 0 | ||
| N363S | ||||||
| wildtype | 94.1 | 91.2 | .358 | 94.9 | 93.4 | .612 |
| heterozygous mutant | 5.4 | 8.8 | 5.1 | 5.7 | ||
| homozygous mutant | 0.5 | 0 | 0 | 0.9 | ||
| A3669G | ||||||
| wildtype | 72.2 | 67.2 | .518 | 73.7 | 70.8 | .870 |
| heterozygous mutant | 24.9 | 28.0 | 23.2 | 26.4 | ||
| homozygous mutant | 2.9 | 4.8 | 3.0 | 2.8 |
Abbreviations: CS, Cushing’s syndrome; GR, glucocorticoid receptor; SNP, single nucleotide polymorphism.
In the whole CS patient cohort A3669G minor allele carriers showed rather normal handgrip strength of the dominant and nondominant hand compared to relevantly affected wildtype carriers (dominant hand: 99.4% [31%–135%; median+range] vs. 89.0% ± 23.4% [mean ± SD], P = .013; nondominant hand: 105% [11% ± 148%; median+range] vs. 91.8 ± 27.5% [mean ± SD], P = .032] (Fig. 1A). This effect was not observed in ruled-out CS subjects (93% vs. 90% for dominant hand, P = .487; 92% vs. 87%, P = .432, Fig. 1B). Regarding CS etiology, patients with pituitary CS (n = 128) and carrying the A3669G minor allele showed a higher handgrip strength of the dominant hand compared to wildtype carriers (99% vs. 89%, P = .039). The nondominant hand and the CRT showed no differences (98% vs. 89%, P = .076; 7 seconds vs. 8 seconds, P = .107). There was no significant difference in muscle strength performance in respect to carrier status in patients with adrenal CS (n = 77; dominant hand: 107% vs. 89% P = .169; nondominant hand: 101% vs. 98%, P = .689; CRT: 8 seconds vs. 9 seconds, P = .712).
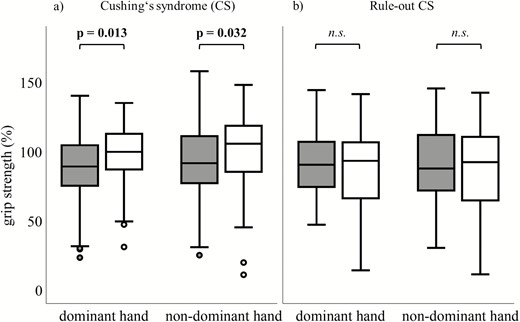
Standardized (to age and gender) grip strength (%) of dominant and nondominant hand between A3669G wildtype (grey) and minor allele carriers (white) in (A) patients with Cushing’s syndrome (CS; n = 148 wildtype; n = 57 minor allele) and (B) patients with ruled-out CS (n = 84 wildtype; n = 41 minor allele). Higher percentage indicates greater muscle strength.
With respect to the whole cohort of CS patients, the performance during the CRT was similar between A3669G wildtype and minor allele carriers (8 seconds vs. 8 seconds, P = .216). In ruled-out CS subjects, however, A3669G wildtype carriers performed significantly worse than A3669G minor allele carriers (7 seconds vs. 6 seconds; P = .046), however the latter tended to be younger than the wildtype carriers (32 years vs. 39 years, P = .057).
Clinical parameters of overt CS patients and CS patients in remission are shown in Table 3. Patients with overt CS presented with, as expected a lower age, a higher waist-to-hip and waist-to-arm ratio, higher blood pressure and a worse HbA1c than CS in remission (Table 3). No differences in handgrip strength or CRT were detected between these two groups. Analyzing handgrip strength of the dominant and nondominant hand of active CS patients, A3669G minor allele carriers performed normal, and only A3669G wildtype carriers had a reduced grip strength (dominant hand: 101% vs. 86%, P = .006; nondominant hand: 104% vs. 89%, P = .021; Fig. 2A and B). In contrast, no differences were found in handgrip strength in patients with CS in remission (Fig. 2A and B). There was no significant difference in hand grip strength between patients with wildtype/minor allele carrier A3669G in short-term remission (<2 years) and patients in long-term remission (>2 years). Furthermore, no differences in CRT performance could be found between A3669G minor allele and wildtype carriers in overt CS patients or CS patients in remission (data not shown).
Clinical characteristics and laboratory parameters of patients with overt CS and CS in remission
| Overt CS (n = 99) | CS in remission (n = 106) | P-value | |
|---|---|---|---|
| Age at examination (years) | 51 (16–75) | 51 (22–80) | .723 |
| Age at diagnosis (years) | 47.6 ± 14.2 | 37.2 ± 12.5 | <.001 |
| CS subtype: | |||
| Adrenal (%) | 43.4 | 32.1 | .093 |
| Pituitary (%) | 56.6 | 67.9 | |
| Sex (% Female) | 65.7 | 84.9 | .001 |
| BMI (kg/m2) | 27.7 (19.9–54.9) | 26.7 (18.1–40.4) | .092 |
| Time since successful treatment (years) | - | 8.71 (0.19–50.4) | |
| Waist-to-arm-ratio | 3.37 (2.03–5.46) | 3.15 (2.57–4.44) | <.001 |
| Waist-to-hip-ratio | 0.98 ± 0.10 | 0.91 (0.51–2.36) | <.001 |
| Systolic BP (mmHg) | 141 (100–214) | 132.3 ± 18.7 | <.001 |
| Diastolic BP (mmHg) | 89.8 ± 13.6 | 82.7 ± 10.6 | <.001 |
| Hypertension (%) | 77.8 | 47.2 | <.001 |
| Diabetes mellitus (%) | 24.2 | 19.8 | .444 |
| Insufficiency of corticotropic axis (%) | - | 66 | |
| Daily dose hydrocortisone equivalent (mg) | - | 20 (5–40) | |
| Adrenostatic therapy (%) # | 10.1 | - | |
| Grip strength (%) of dominant hand | 90.4 ± 23.9 | 93.7 (23.1–139) | .507 |
| grip strength (%) of non-dominant hand | 92.9 ± 28.4 | 94.8 ± 28.7 | .636 |
| Chair raising test (sec) | 8 (4–26) | 8 (3–42) | .354 |
| Potassium (mmol/L) | 4.20 (2.6–5.3) | 4.20 (3.4–5.1) | .893 |
| Calcium (mmol/L) | 2.44 ± 0.10 | 2.41 ± 0.10 | .026 |
| HbA1c (%) | 5.7 (4.7–10.4) | 5.5 (4.6–8.9) | .046 |
| Total cholesterol (mg/dL) | 211 ± 52.3 | 216 (141–346) | .088 |
| Triglycerides (mg/dL) | 120 (33–462) | 119 (28–790) | .624 |
| HDL (mg/dL) | 58.0 ± 15.8 | 62.5 ± 17.4 | .054 |
| LDL (mg/dL) | 117 (41–293) | 130 ± 36.2 | .659 |
Normally distributed values are presented as mean ± standard deviation. Nonnormally distributed values are presented as median with range. P < 0.05 was considered statistically significant. # = the average duration of adrenostatic therapy in this group was 1.3 years (range 0.1 to 31 years), adrenostatic therapy in 10 patients.
Abbreviations: BMI, body mass index; BP, blood pressure; CS, Cushing syndrome; HDL, high-density lipoprotein; LDL, low-density lipoprotein.
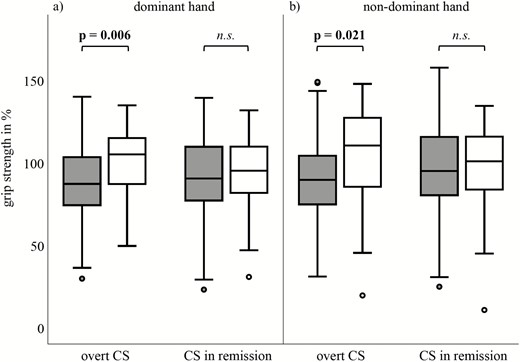
Standardized (to age and gender) grip strength (%) of (A) dominant and (B) nondominant hand between A3669G wildtype (grey) and minor allele carriers (white) in patients with overt Cushing’s syndrome (CS; n = 99) and CS in remission (n = 106). Higher percentage indicates higher muscle strength.
We further investigated sex differences in the overall CS cohort. Male A3669G minor allele carriers showed a better handgrip strength of the dominant hand compared to male wildtype carriers (98 % vs. 84 %, P = .04), whereas in females no statistically significant discrepancy was observed (100% vs. 89 %, P = .087). Furthermore, in male CS patients (n = 50), ER22/23EK wildtype carriers independent of status of therapy showed a weaker handgrip strength of the dominant and nondominant hand compared to ER22/23EK minor allele carriers (87% vs. 108%, P = .049; 87% vs. 116%, P = .027, respectively; Fig. 3).
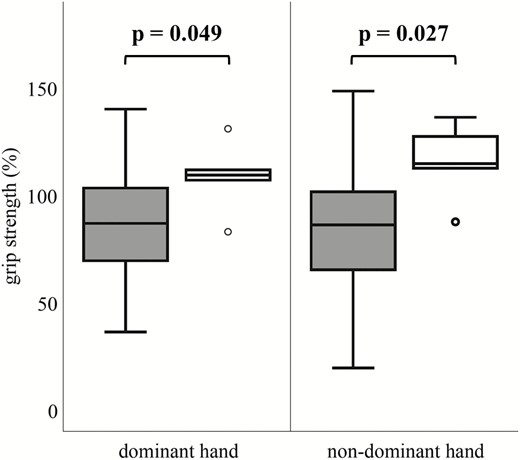
Standardized (to age and gender) grip strength (%) of dominant and nondominant hand between ER22/23EK wildtype (gray; n = 45) and minor allele carriers (white; n = 5) in male patients with Cushing’s syndrome). Higher percentage indicates higher muscle strength.
The other investigated GR polymorphisms (BclI and N363S) showed no significant differences in muscular function (CRT and hand grip strength) between mutants and wildtype in both CS patients and ruled-out CS subjects.
Discussion
Impaired muscle performance is a prevalent long-term feature of CS (32). So far, observed inter-individual differences regarding CS myopathy cannot be explained solely by the extent of hypercortisolemia. In this study we investigated the possible influence of the GR SNPs BclI, N363S, ER22/23EK and A3669G on muscle strength in patients with endogenous hypercortisolism and in subjects in whom CS was ruled-out.
As we expected, the frequency of all SNPs showed the same distribution in subjects with and without CS, and also in patients with overt CS and CS in remission. This is in contrast to a previous study by Trementino et al. who showed that a BclI mutant allele seems to be more common in patients with CS than in healthy controls (24). Therefore, from our point of view, the incidence of CS doesn’t seem to be related to the occurrence of one of the polymorphisms. Other studies (33) showed no differences in the allelic frequencies of GR SNPs between patients with CS and healthy controls.
Our study is the first to show that handgrip strength in patients with CS is related to the A3669G polymorphism. A difference of handgrip strength was especially seen in patients with overt CS. Here A3669G carriers are protected against an initial deterioration of muscle strength via a reduced GR sensitivity and causing a state of “glucocorticoid resistance”, which protects muscle metabolism from to high endogenous cortisol levels. This emphasizes that A3669G minor allele carriers seem to be less susceptible to GC excess, and thus to the risk of developing myopathy. This is even more interesting when considering the fact that low muscle strength is correlated with a higher morbidity and mortality (34, 35).
Interestingly, a benefit of carrier status was only seen in subjects with active CS (101% for minor allele carrier vs. 87% for wild type for dominant hand) but not in patients with CS in remission (94 % for dominant hand) with both having reduced grip strength. Therefore, other factors independent of the polymorphism, such as the degree of hypokalemia, the inhibition of cortisol on gonadotropin/sex-steroids or growth hormone (GH)/IGF-I, seem to reduce muscle performance over time.
Furthermore, patients with adrenal CS are not influenced by their carrier status. As previously shown (32) patients with adrenal CS were per se only marginally affected on grip strength performance and so carrier status seems to be irrelevant for them. It is therefore tempting to speculate that differences in muscle strength due to GR SNPs might be only uncovered in states when cortisol levels are generally able to affect muscle groups. Why patients with adrenal CS are generally only affected on CRT performance but not in grip strength remains still unclear.
In pharmacological glucocorticoid treatment synthetic glucocorticoids are used which have a different molecular structure than cortisol and have different effects, probably also regarding their negative effect on muscle strength. Our finding raises the possibility that also patients who receive pharmacological glucocorticoid treatment with supraphysiological doses might be differently affected when developing myopathy as a side effect, being triggered by their A3669G SNP status.
It is intriguing that myopathy in CS should be addressed aggressively by physiotherapy to minimize the long-term effect of cortisol on the muscle. It has to be assumed that this would be even more necessary for CS patients harboring the A3669G wildtype. Consequently, a screening for this polymorphism may be relevant for future treatment. Before, however, the response to physiotherapy of these two subgroups has to be clarified. However, some patients with CS are very catabolic and sick and therefore often unable to actively participate in physiotherapy.
With respect to the CRT, we were not able to find the same difference in patients with CS, although A3669G minor allele carriers of ruled-out CS subjects performed significantly better than wildtype carriers. However, the minor allele carriers were significantly younger than the wildtype carriers, which could lead to a better performance in CRT. It is important to note that the CRT reveals muscle strength of the gluteal and the quadriceps muscles, which are typically first affected in CS patients (4). However, in our study, no protective effect of the A3669G on these muscles in patients with CS could be shown. Another explanation for that finding might be that the CRT was not strenuous enough to show differences in our cohort.
Investigations of sex differences in GR polymorphisms in CS were often limited by the small number of male CS patients. However, a previous study, van Rossum et al. (26) showed that muscle strength, using arm pull and standing high jump, correlated to the ER22/23EK polymorphism in male patients with CS . In accordance to the study by van Rossum et al, (26), we found that male CS patients harboring the ER22/23EK minor allele showed stronger handgrip strength of the dominant and nondominant hand compared to ER22/23EK wildtype carriers. Similar to the SNP A3669G, the ER22/23EK polymorphism reduces GR sensitivity and thus seems to be protective for glucocorticoid-induced myopathy. This underscores our assumption that different GR sensitivity influences muscle strength.
The reason why this is observed only in male and not female CS patients is still in debate (26). One reason might be the larger muscle mass in men, where changes might be more prominent. Also subtle anabolic effects may by possible: higher androgen levels and estrogenic effects on the pituitary axis in females may explain the gender dimorphism (26).
We and other groups (24, 25, 36, 37) have shown that the GR polymorphisms lead to a modulation of the GR sensitivity to glucocorticoids, and this, in turn, can influence the deterioration of muscle under glucocorticoid influence. Understanding the mechanisms could lead to potentially GR modulating substances that could prevent muscle weakness under exogenous glucocorticoid treatment.
Interestingly, the polymorphisms that increase GR signaling do not worsen myopathy in our study. This suggests that CS myopathy might depend on a threshold effect: if excessive GR signaling is already existing, having even more GR signaling by certain polymorphisms might not further stimulate GR effects and might not make a significant difference. Such a conclusion, although speculative, should be tested in future studies.
Our study has several limitations. Relatively low frequencies of mutant alleles were found for the SNPs ER22/23EK and N363S. In general, a larger study population would have increased the number of minor allele carriers and thus increased the chance of significant findings. However, endogenous CS is a rare disease, and our numbers are rather large for this entity. Furthermore, the performed tests for evaluating muscle strength are both prone for interindividual differences in performance. This might have had an influence on the test results. Furthermore, muscle strength is a highly influenceable parameter itself and can easily be modified by performing sports, especially weight training. In our study, we did not ask for the level of physical activity, so interpersonal variabilities in physical fitness are not included.
Our study had a cross-sectional design, and we did not look at long-term morbidity and mortality. However, we included patients with overt CS and CS in remission. This made it possible to investigate the possible influence of the SNPs on muscle strength according to the current endogenous cortisol exposure.
In summary, we detected that muscle strength of GR A3669G minor allele carriers is protected against glucocorticoid excess. Furthermore, in male CS patients, the GR SNP ER22/23EK influences handgrip strength. Therefore, GR SNPs might explain interindividual differences in glucocorticoid-induced myopathy in states of high endogenous cortisol levels.
Acknowledgments
We are indebted to Britta Bauer, Endocrinology in Charlottenburg, and Stephanie Zopp, LMU Munich, for help with the Cushing patients. Lisa Marie Müller received the “Young Investigator” prize 2019 of the Section “Angewandte Endokrinologie” of the German Endocrine Society (DGE, Deutsche Gesellschaft für Endokrinologie) for this work. The German Cushing’s Registry is supported by the Section “Nebenniere, Steroide, Hypertonie” of the German Endocrine Society (DGE, Deutsche Gesellschaft für Endokrinologie).
Financial Support: This work is part of the German Cushing’s Registry CUSTODES and has been supported by a grant from the Else Kröner-Fresenius Stiftung to MR (2012_A103 and 2015_A228). AR and MR are supported by the DFG in the context of the CRC/TRR 205. Additionally, TD received a grant from the Interdisciplinary Center for Clinical Research (IZKF) of the University of Würzburg (grant number Z-2/57).
Additional Information
Disclosure Summary: The authors declare that there is no conflict of interest that could be perceived as prejudicing the impartiality of the research reported.
Data availability: The datasets generated during and/or analyzed during the current study are not publicly available but are available from the corresponding author on reasonable request.
References
