


Abstract
Metabolic reprogramming is a common feature of tumorigenesis. It remains unknown concerning the expression pattern of metabolism-associated genes in dedifferentiated thyroid cancer (DDTC).
This study aimed to identify a useful signature to indicate dedifferentiation of papillary thyroid cancer (PTC).
We used one discovery and two validation cohorts to screen out aberrant metabolic genes in DDTC, and further used The Cancer Genome Atlas (TCGA) cohort to search for independent risk factors for the low-differentiated phenotype of PTC as a signature of dedifferentiation. The prediction of the signature for DDTC was validated in the TCGA cohort and the combined Gene Expression Omnibus cohort. We also analyzed the correlations of the signature risk score with clinicopathological features of PTC. Gene set enrichment analyses were performed in the TCGA cohort.
Significant enrichment of metabolic pathways correlated with differentiation status of PTC. A signature of metabolic genes including LPCAT2, ACOT7, HSD17B8, PDE8B, and ST3GAL1 was discovered and validated across three cohorts. The signature was not only predictive of DDTC but also significantly associated with BRAFV600E mutation (P < 0.001), T3/T4 stage (P < 0.001), extrathyroidal extension (P < 0.001), lymph node metastasis (P < 0.001), and tumor/lymph node/metastasis III/IV stage (P < 0.001) in PTC. Downregulations of LPCAT2 expression (P = 0.009) and ST3GAL1 expression (P = 0.005) increased risks of decreased disease-free survival for patients. Furthermore, the signature was implicated in a number of oncogenic biological pathways.
Our findings suggest that metabolic deregulations mediate dedifferentiation of PTC, and that the metabolic gene signature can be used as a biomarker for DDTC.
Of differentiated thyroid cancers (DTCs), papillary thyroid cancer (PTC) is the most common histological type (1). Most PTCs are indolent and curable; however, ∼5% to 20% of patients can suffer disease recurrence (2), and occasionally some progress to aggressive and lethal outcomes. Dedifferentiation of PTC into poorly DTC (PDTC) is responsible for poor clinical outcomes of patients as reported in our previous study (3).
Although several genomic studies on PDTC and anaplastic thyroid cancer (ATC) have recently supported a stepwise tumoral progression from well-differentiated thyroid cancer to PDTC and finally to ATC through accumulation of key genetic alterations such as TERT and TP53 mutations (4–6), the molecular mechanism of PTC dedifferentiation remains unclarified. Metabolic reprogramming is a common feature of tumorigenesis, exerting profound effects on gene expression, cellular differentiation, and the tumor microenvironment in cancer (7). Metabolomic alterations have been partially observed in thyroid cancer (8–12), and some mediators of oxidative stress, aberrant lipid metabolism, and glutamine metabolism are found to be involved in thyroid carcinoma growth and progression (12–17). Several recent studies (8–11) have reported that metabolomics profiling can be potentially useful for accurate diagnosis of malignant thyroid nodules and predication of distant metastasis and cancer stem-like cells of PTC, which revealed regulators of altered metabolites as novel tumor-specific targets for therapy in thyroid cancer patients. However, it remains unknown concerning expression pattern of metabolism-associated genes mediating metabolic reprogramming in dedifferentiated thyroid cancer (DDTC).
The current study aimed to investigate correlations of alteration of metabolic genes with differentiation status of PTC, and to identify a useful signature of metabolic genes to indicate dedifferentiation and poor clinical outcomes of PTC that may assist us in evaluating disease status, therapeutic decisions, and prognosis for patients. In this study, we found that significant deregulations of metabolic pathways were related to the differentiation status of PTC. A signature of five metabolic genes was discovered and validated across the Fudan University Shanghai Cancer Center (FUSCC) cohort, the Gene Expression Omnibus (GEO) cohort, and The Cancer Genome Atlas (TCGA) cohort. The metabolic signature was not only predictive of DDTC but was also significantly associated with aggressive clinical outcomes of PTC. Furthermore, a number of biological pathways indicative of malignant transformation were enriched in the high-risk score phenotype of the metabolic gene signature.
Materials and Methods
Normal and cancerous thyroid samples
We retrospectively searched for fresh frozen tissues of DDTC patients who received surgical therapy at the FUSCC, and six normal thyroid (NT) tissues, five PTC tissues, and five PDTC tissues were obtained from eight patients undergoing dedifferentiation from PTC into PDTC. The information of the eight patients and 16 samples is described in an online repository (18). The 16 samples, as a discovery cohort, were used for high-through RNA sequencing (RNA-seq) to identify deregulated metabolic genes. Each patient provided written informed consent for his/her specimens and information to be used for research and stored in the hospital database, and this study was approved by the Medical Ethics Committee of the FUSCC. All procedures performed in our study were in accordance with the ethical standards of our institutional research committee and with the 1964 Declaration of Helsinki and its later amendments or comparable ethical standards.
RNA-seq analysis
We extracted total RNA from the normal and cancerous thyroid samples using TRIzol reagent (Life Technologies, Carlsbad, CA). The RiboMinus eukaryote kit (Qiagen, Valencia, CA) was used to remove ribosomal RNA of total RNA (∼3 μg) from each sample before construction of the RNA-seq libraries. Strand-specific RNA-seq libraries were prepared using the NEBNext Ultra directional RNA library prep kit for Illumina (New England BioLabs, Beverly, MA) following the manufacturer’s instructions. Approximately 50-ng RNA samples without ribosome were fragmented and then used for first- and second-strand cDNA synthesis with random hexamer primers. A deoxyuridine triphosphate mix was used for second-strand cDNA synthesis. The cDNA fragments were subjected to the End-It DNA End-repair kit to repair the ends, followed by modification with the Klenow fragment to add an A at the 3′ end of the DNA fragments, and the products were finally ligated to adaptors. The ligated cDNA products were purified and treated with uracil DNA glycosylase to remove the second-strand cDNA. Purified first-strand cDNA was subjected to 13 to 16 cycles of PCR amplification. Then, the libraries were analyzed for quality controlled with an Agilent 2100 bioanalyzer (Agilent Technologies, Santa Clara, CA) and sequenced by a HiSeq 2000 sequencing system (Illumina, San Diego, CA) on a 100-bp paired-end run.
TCGA cohort and GEO cohort
TCGA cohort data were available at the Web site of data sets of the University of California Santa Cruz Xena (THCA_22 datasets: https://xenabrowser.net/datapages/; https://www.biorxiv.org/content/early/2018/08/28/326470) and the cBioPortal for Cancer Genomics (19, 20) (http://www.cbioportal.org/). We obtained raw microarray cell intensity files of DDTC, including GSE29265, GSE33630 (21, 22), GSE53157 (23), GSE65144 (12), and GSE76039 (4) from the Gene Expression Omnibus (GEO) database (24, 25) (http://www.ncbi.nlm.nih.gov/geo/). The files were background adjusted and normalized using robust multichip average (26). The same chip platform (Affymetrix Human Genome U133 Plus 2.0 Array) was used by the files of the GEO cohort. The ComBat method was used to remove the batch effects. All probes were mapped to the latest version of the NetAffx annotation file. When a gene symbol was recorded with multiple probes, the average value was used as its expression level. The combined GEO cohort included the GSE29265 cohort (20 NTs, 20 PTCs, and 9 ATCs), the GSE33630 cohort (45 NTs, 49 PTCs, and 11 ATCs), the GSE53157 cohort (3 NTs, 15 PTCs, and 5 PDTCs), the GSE65144 cohort (13 NTs and 12 ATCs), and the GSE76039 cohort (17 PDTCs and 20 ATCs). We performed correlation matrix analyses of all mRNA transcripts in PDTC and ATC samples from the combined GEO cohort, and a significant high correlation was found between PDTC and ATC (18). Therefore, we used the GSE29265 cohort and the GSE33630 cohort as validation cohorts to verify deregulated metabolic genes. All patients were staged using the 8th edition of tumor/lymph node/metastasis (TNM) thyroid cancer staging system published by the American Joint Committee on Cancer (27).
Gene set enrichment analysis and metabolism-associated gene sets
Gene set enrichment analysis (GSEA) was performed using GSEA software, version 3.0, which was obtained from the Broad Institute (http://www.broad.mit.edu/gsea), as previously described (28–30). Enrichment Map was used for visualization of the GSEA results. Normalized enrichment score (NES) and P value were used to sort the pathways enriched in each phenotype after gene set permutations were performed 1000 times for each analysis. Seventy metabolism-associated gene sets were obtained from the gene sets database of Kyoto Encyclopedia of Genes and Genomes (KEGG) pathways (31–33), which included 186 gene sets totally, at the GSEA Web site (http://software.broadinstitute.org/gsea/downloads.jsp#msigdb).
Statistical analysis
Continuous variables were expressed as the mean value ± SD, and categorical data were summarized with frequencies and percentages. An independent t test was used to compare continuous variables between two groups. Associations between continuous variables and categorical variables were evaluated using Mann-Whitney U tests for two groups and Kruskal–Wallis tests for more than two groups. The χ2 and Fisher’s exact tests were used for categorical variables. Based on the median value of thyroid differentiation score (TDS), we divided the PTC patients from the TCGA cohort into a low-differentiated group and a high-differentiated group. Expression levels of the five metabolic genes as a signature in each patient were integrated into a risk score for dedifferentiation [risk score = (−0.448 × LPCAT2) + (1.665 × ACOT7) + (−1.430 × HSD17B8) + (−0.340 × PDE8B) + (−0.790 × ST3GAL1)]. To analyze the association between the metabolic gene signature and clinicopathological parameters, patients were divided into two subgroups (low-risk score and high-risk score) according to the median value of the risk score. Nonparametric receiver operating characteristic (ROC) analyses were performed to calculate area under the curve (AUC) for the signature that would be predictive of dedifferentiation. Univariate and multivariate logistic regression analyses were performed to determine risk factors for low-differentiation phenotype and high-risk score of the signature in PTC. Furthermore, the metabolic genes were tested for disease-free survival (DFS) analyses and overall survival analyses in thyroid cancer patients on the Web site of gene expression profiling and interactive analyses (http://gepia.cancer-pku.cn/index.html) (34). The Kaplan–Meier method was used to construct DFS curves, and the univariate survival difference was determined by the log-rank test. A P value <0.05 was considered significant. Data preparation and statistical analyses were performed using SPSS for Windows (version 22.0; IBM Corporation, Armonk, NY), R software (version 3.5.1; R Foundation for Statistical Computing, Vienna, Austria), and GraphPad Prism (version 6.01; GraphPad Software, La Jolla, CA).
Results
Identification and validation of deregulated metabolic genes in DDTC
Figure 1 summarizes the flow graph of identification and validation of deregulated metabolic genes in DDTC and further correlation analyses of clinicopathological features, genetic alterations, and oncogenic signaling pathways. To investigate potential roles of metabolic genes in DDTC, a total of 1466 metabolic genes were obtained from 70 KEGG metabolic gene sets (18), and we initially analyzed expression alteration of the metabolic genes based on high-throughput transcriptome data of five PDTCs, five PTCs, and six NTs from the FUSCC. Of the 1466 genes, 121 genes (81 downregulated genes and 40 upregulated genes, fold change ≥1.5, P < 0.05) were consistently found deregulated in PDTCs compared with both PTCs and NTs in the discovery cohort [Fig. 2(a) and 2(b)]. Two gene expression profiles were searched for from GSE29265 and GSE33630 to further validate the 121 deregulated genes. As shown in the Venn diagram and heat maps [Fig. 2(c)–2(f)], a sum of 65 genes were confirmed to exhibit differential expression, and we screened out recurrent downregulation of 38 genes and upregulation of 27 genes in DDTC from the three cohorts.
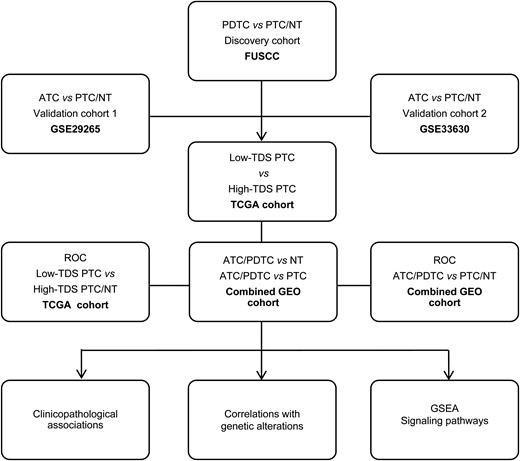
Flow graph of the current study. This study included the FUSCC cohort, the TCGA cohort, and the GEO cohorts (GSE29265, GSE33630, GSE53157, GSE65144 and GSE76039).
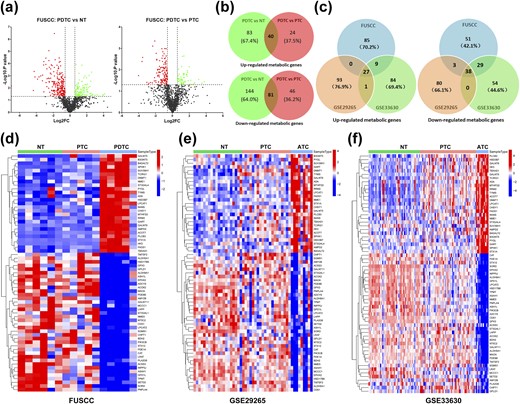
Identification of recurrent deregulation of metabolic genes in DDTC. (a) Volcano maps: left map, 144 downregulated genes (red dots) and 83 upregulated genes (green dots) in PDTCs compared with NT tissues; right map, 46 downregulated genes (red dots) and 24 upregulated genes (green dots) in PDTCs compared with PTCs; fold change (FC) ≥1.5, P < 0.05. (b) Overlapped analyses of deregulated genes in PDTCs in comparison with both PTCs and NTs. (c) Venn diagrams showed that validation and overlapped analyses of the deregulated 121 genes in the FUSCC cohort were performed in GSE29265 and GSE33630, and recurrent downregulation of 38 genes and upregulation of 27 genes were screened out. (d–f) Expression data of 65 recurrently deregulated genes are shown in heat maps of the FUSCC cohort, the GSE29265 cohort, and the GSE33630 cohort, respectively.
Significant enrichment of metabolic pathways correlated with differentiation status of PTC
A total of 502 PTC patients (mean age, 47.18 ± 15.85 years) with transcriptome data from the TCGA cohort were enrolled in this study. Clinicopathological and genetic alterations, including age, sex, multifocality, coexistence of Hashimoto thyroiditis, extrathyroidal extension (ETE), TNM stage, BRAFV600E mutation, RAS mutation, EIF1AX mutation, TERT mutation, ETV6_NTRK3, PAX8_PPARG, CCDC6_RET, and TDS, are summarized in Table 1. To identify differentiation-associated KEGG biological signaling pathways on an unbiased basis, we performed GSEAs using transcriptome data of high-differentiated and low-differentiated groups from the TCGA cohort. As shown in an online repository (18), the gene sets of metabolic pathways, including butanoate metabolism (NES = −1.80, P = 0.003), glycine serine and threonine metabolism (NES = −1.69, P = 0.002), propanoate metabolism (NES = −1.54, P = 0.020), starch and sucrose metabolism (NES = −1.54, P = 0.015), and oxidative phosphorylation (NES = −1.52, P < 0.001), were significantly correlated with differentiation status of PTC.
Clinicopathological Characteristics and Genetic Alterations of PTC Patients in the TCGA Cohort
| Variables | TCGA (N = 502) | |
|---|---|---|
| N | % | |
| Age, y, mean ± SD (range) | 47.18 ± 15.85 (15–89) | |
| Sex | ||
| Male | 135 | 26.90 |
| Female | 366 | 72.90 |
| NA | 1 | 0.20 |
| Multifocality | ||
| Unifocal | 265 | 52.80 |
| Multifocal | 226 | 45.00 |
| NA | 11 | 2.20 |
| Coexistent HT | ||
| Yes | 65 | 12.90 |
| No | 397 | 79.10 |
| NA | 40 | 8.00 |
| ETE | ||
| Yes | 331 | 65.90 |
| No | 152 | 30.30 |
| NA | 19 | 3.80 |
| T stage | ||
| T1/T2 | 308 | 61.40 |
| T3/T4 | 191 | 38.00 |
| NA | 3 | 0.60 |
| LNM | ||
| N0 | 227 | 45.20 |
| N1 | 224 | 44.60 |
| NA | 51 | 10.20 |
| TNM stage | ||
| I/II | 480 | 95.60 |
| III/IV | 21 | 4.20 |
| NA | 1 | 0.20 |
| BRAFV600E | ||
| Mutation | 239 | 47.60 |
| Wild-type | 254 | 50.60 |
| NA | 9 | 1.80 |
| RAS | ||
| KRAS mutation | 3 | 0.59 |
| NRAS mutation | 34 | 6.78 |
| HRAS mutation | 14 | 2.79 |
| Wild-type | 442 | 88.00 |
| NA | 9 | 1.80 |
| EIF1AX | ||
| Mutation | 6 | 1.20 |
| Wild-type | 487 | 97.00 |
| NA | 9 | 1.80 |
| TERT | ||
| Mutation | 2 | 0.40 |
| Wild-type | 491 | 97.80 |
| NA | 9 | 1.80 |
| ETV6_NTRK3 | ||
| Fusion | 5 | 1.00 |
| Wild-type | 488 | 97.20 |
| NA | 9 | 1.80 |
| PAX8_PPARG | ||
| Fusion | 4 | 0.80 |
| Wild-type | 489 | 97.40 |
| NA | 9 | 1.80 |
| CCDC6_RET | ||
| Fusion | 21 | 4.20 |
| Wild-type | 472 | 94.0 |
| NA | 9 | 1.80 |
| TDS | ||
| Low | 196 | 39.00 |
| High | 195 | 38.80 |
| NA | 111 | 22.10 |
Abbreviation: HT, Hashimoto thyroiditis; NA, not available.
A signature of metabolic genes indicative of dedifferentiation and poor clinical outcome of PTC
Considering the significant association of metabolic gene deregulation with differentiation of PTC, the 65 differential genes were further analyzed in the TCGA cohort to indicate their potential roles and clinical significance in the low-differentiated PTC phenotype. In univariate logistic regression analysis, T3/T4 stage, lymph node metastasis (LNM), BRAFV600E mutation, and deregulation of 49 genes significantly increased risk of the low-differentiated phenotype of PTC (18). After adjusting T stage, LNM, and BRAFV600E mutation, a metabolic gene panel composed of lysophosphatidylcholine acyltransferase 2 (LPCAT2), acyl–coenzyme A (CoA) thioesterase 7 (ACOT7), hydroxysteroid 17β-dehydrogenase 8 (HSD17B8), phosphodiesterase 8B (PDE8B), and ST3 β-galactoside α-2,3-sialyltransferase 1 (ST3GAL1) showed independent risk factors for the low-differentiated phenotype in multivariate logistic regression analyses (Table 2). As shown in Fig. 3(a), in the combined GEO cohort including 81 NTs, 84 PTCs, 22 PDTCs, and 52 ATCs, decreased expression levels of LPCAT2, HSD17B8, PDE8B, and ST3GAL1 were firmly confirmed in the DDTCs (PDTC/ATC) compared with both PTCs and NTs, and ACOT7 expression increased significantly in the DDTCs.
Independent Risk Factors for Low-Differentiated Phenotype of Papillary Thyroid Cancer in the TCGA Cohort
| Variables | Univariate Analysis | Multivariate Analysisa | ||||
|---|---|---|---|---|---|---|
| P Value | OR | 95.0% CI for OR | P Value | OR | 95.0% CI for OR | |
| LPCAT2 | <0.001 | 0.213 | 0.141–0.311 | 0.036 | 0.424 | 0.190–0.944 |
| ACOT7 | <0.001 | 12.276 | 7.407–21.677 | <0.001 | 11.175 | 3.403–36.690 |
| HSD17B8 | <0.001 | 0.226 | 0.140–0.352 | <0.001 | 0.049 | 0.014–0.170 |
| PDE8B | <0.001 | 0.365 | 0.288–0.453 | <0.001 | 0.357 | 0.202–0.629 |
| ST3GAL1 | <0.001 | 0.222 | 0.148–0.324 | <0.001 | 0.190 | 0.079–0.460 |
Bold type indicates statistical significance.
Multivariate analyses adjusted by T stage, LNM, and BRAFV600E mutation.
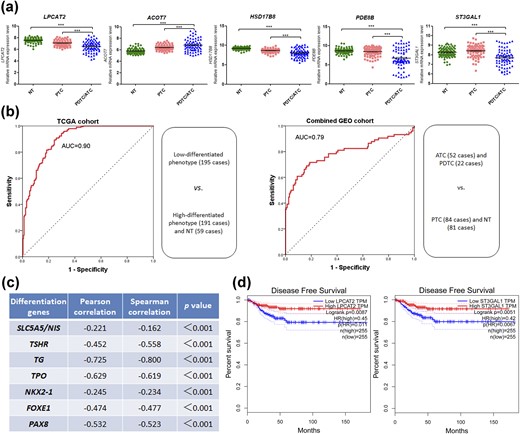
A signature of five metabolic genes indicative of dedifferentiation and poor clinical outcome of PTC. (a) Expression levels of LPCAT2, ACOT7, HSD17B8, PDE8B, and ST3GAL1 were compared among NT tissues, PTCs, and PDTCs/ATCs in the combined GEO cohort. ***P < 0.001. (b) ROC curve analyses for the predictive values of five-gene signature risk score for dedifferentiation in the TCGA cohort and the combined GEO cohort. (c) Linear correlation analyses of the metabolic signature with thyroid differentiation genes. NIS, sodium iodide symporter; TG, thyroid globulin; TPO, thyroid peroxidase; TSHR, TSH receptor. (d) LPCAT2 and ST3GAL1 were tested for DFS analyses in patients with thyroid cancer on the Web site of gene expression profiling and interactive analyses.
To evaluate the predictive value of the five-gene signature for dedifferentiation, the risk score system based on the five gene expression levels was used to calculate the AUC value for prediction of the low-differentiated phenotype in the TCGA cohort and DDTC in the combined GEO cohort, respectively. The two ROCs showed high predictive scores in both the TCGA cohort (AUC = 0.90) and the combined GEO cohort (AUC = 0.79) [Fig. 3(b)]. The linear correlations of the metabolic signature with thyroid differentiation genes indicate that the risk score was negatively related to expression levels of SLC5A5, TSHR, TG, TPO, NKX2-1, FOXE1, and PAX8 [Fig. 3(c)].
In Fig. 4, the patients of the TCGA cohort were ranked by the signature risk score together with clinicopathological factors, common genetic mutations, genetic fusions, TDS, and the heat map of five metabolic gene expression data, which exhibited remarkably differential distribution of T stage, lymph node status, ETE, TNM stage, BRAFV600E mutation, and RAS mutation between the low-risk score group and the high-risk score group. As consistently shown in Table 3, in the TCGA cohort, the high-risk score of the signature was significantly associated with T3/T4 (P < 0.001), ETE (P < 0.001), LNM (P < 0.001), TNM III/IV stage (P = 0.004), and BRAFV600E mutation (P < 0.001), and the low-risk score was correlated with RAS mutation (P < 0.001). Additionally, low LPCAT2 expression (P = 0.009) and low ST3GAL1 expression (P = 0.005) were found to increase the risk of decreased DFS in the survival analyses of the five genes for thyroid cancer patients [Fig. 3(d)].

Roles of the signature risk score in the TCGA cohort. Patients of the TCGA cohort were ranked by clinicopathological factors (a), common genetic mutations (b), genetic fusions (c), TDS and the signature risk score (d), and the heat map of five metabolic gene expression data (e).
Clinicopathological Correlations of the Metabolic Gene Signature in the TCGA Cohort
| Variables | N | Metabolic Gene Signature | P Value | |
|---|---|---|---|---|
| Low-Risk Score | High-Risk Score | |||
| Age, y | 0.899 | |||
| <55 | 336 | 167 (49.7%) | 169 (50.3%) | |
| ≥55 | 165 | 83 (50.3%) | 82 (49.7%) | |
| Sex | 0.379 | |||
| Male | 135 | 63 (46.7%) | 72 (53.3%) | |
| Female | 366 | 187 (51.1%) | 179 (48.9%) | |
| Multifocality | 0.568 | |||
| Unifocal | 265 | 128 (48.3%) | 137 (51.7%) | |
| Multifocal | 226 | 115 (50.9%) | 111 (49.1%) | |
| Coexistent HT | 0.412 | |||
| Yes | 65 | 30 (46.2%) | 35 (53.8%) | |
| No | 397 | 205 (51.6%) | 192 (48.4%) | |
| T stage | <0.001 | |||
| T1/T2 | 308 | 177 (57.5%) | 131 (42.5%) | |
| T3/T4 | 191 | 73 (38.2%) | 118 (61.8%) | |
| ETE | <0.001 | |||
| Yes | 152 | 47 (30.9%) | 105 (69.1%) | |
| No | 331 | 192 (58.0%) | 139 (42.0%) | |
| LNM | <0.001 | |||
| N0 | 227 | 140 (61.7%) | 87 (38.3%) | |
| N1 | 224 | 77 (34.4%) | 147 (65.6%) | |
| TNM stage | 0.004 | |||
| I/II | 480 | 246 (51.2%) | 234 (48.8%) | |
| III/IV | 21 | 4 (19.0%) | 17 (81.0%) | |
| BRAFV600E | <0.001 | |||
| Mutation | 239 | 74 (31.0%) | 165 (69.0%) | |
| Wild-type | 254 | 172 (67.7%) | 82 (32.3%) | |
| TERT | 0.499 | |||
| Mutation | 2 | 0 (0.0%) | 2 (100.0%) | |
| Wild-type | 491 | 246 (50.1%) | 245 (49.9%) | |
| RAS | <0.001 | |||
| Mutation | 51 | 48 (94.1%) | 3 (5.9%) | |
| Wild-type | 442 | 198 (44.8%) | 244 (55.2%) | |
| EIF1AX | 0.122 | |||
| Mutation | 6 | 5 (83.3%) | 1 (16.7%) | |
| Wild-type | 487 | 241 (49.5%) | 246 (50.5%) | |
| ETV6_NTRK3 | 0.216 | |||
| Fusion | 5 | 4 (80.0%) | 1 (20.0%) | |
| Wild-type | 488 | 242 (49.6%) | 246 (50.4%) | |
| CCDC6_RET | 0.510 | |||
| Fusion | 21 | 9 (42.9%) | 12 (57.1%) | |
| Wild-type | 472 | 237 (50.2%) | 235 (49.8%) | |
| PAX8_PPARG | 0.123 | |||
| Fusion | 4 | 4 (100.0%) | 0 (0.0%) | |
| Wild-type | 489 | 243 (49.6%) | 247 (50.4%) | |
Bold type indicates statistical significance.
Abbreviation: HT, Hashimoto thyroiditis.
Molecular biological basis of the metabolic gene signature indicative of PTC dedifferentiation
To investigate the molecular basis of the metabolic gene signature, we performed GSEA using RNA-seq data of the TCGA cohort. The high-risk score of the metabolic gene signature was used as the phenotype label. Among all of the predefined KEGG pathway gene sets, these biological pathways indicative of malignant transformation, including TNF-α signaling via nuclear factor κB (NES = 2.15, P < 0.001), epithelial–mesenchymal transition (NES = 2.14, P < 0.001), the IL-6/JAK/STAT3 signaling pathway (NES = 1.95, P < 0.001), the IL-2/STAT5 signaling pathway (NES = 1.94, P < 0.001), apoptosis (NES = 1.85, P < 0.001), and the P53 signaling pathway (NES = 1.74, P < 0.001), were found to be significantly enriched in the high-risk score phenotype [Fig. 5(a)]. Furthermore, in the analyses of factors affecting the signature risk score, a multivariate logistic regression analysis showed that BRAFV600E mutation (P < 0.001), T3/T4 (P = 0.026), and LNM (P < 0.001) were independent risk factors for the high-risk score of the metabolic signature in PTC, whereas RAS mutation was an independent protective factor (P = 0.001) (Table 4). As shown in an online repository (18), a significant association of BRAFV600E mutation with the metabolic gene signature was also observed in DDTC from the combined GEO cohort (P = 0.003), whereas other genetic alterations failed to correlate with the signature. When we then analyzed the biological signaling pathways enriched by the BRAFV600E mutation in PTC and DDTC, the BRAFV600E mutation was implicated in remarkable changes of some metabolic pathways (18). Interestingly, it was found that three genes of the signature, that is, LPCAT2, ACOT7, and HSD17B8, were involved in lipid metabolism, and their mediated metabolic pathways are shown in Fig. 5(b)–5(d).
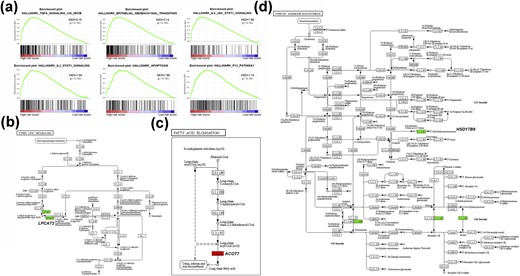
Molecular biological basis of the metabolic gene signature. (a) Metabolic gene signature associated biological signaling pathways based on the GSEA of the TCGA cohort. (b–d) Mediated metabolic pathways of LPCAT2, ACOT7, and HSD17B8 in lipid metabolism.
Multivariate Analysis of Factors Affecting Risk Score of the Signature in the TCGA Cohort
| Variables | Univariate Analysis | Multivariate Analysis | ||||
|---|---|---|---|---|---|---|
| P Value | OR | 95.0% CI for OR | P Value | OR | 95.0% CI for OR | |
| BRAFV600E mutation | ||||||
| No | 1 | 1 | ||||
| Yes | <0.001 | 4.677 | 3.199-6.839 | <0.001 | 3.213 | 2.089–4.942 |
| RAS mutation | ||||||
| No | 1 | 1 | ||||
| Yes | <0.001 | 0.051 | 0.016–0.165 | 0.001 | 0.124 | 0.037–0.421 |
| T stage | ||||||
| T1/T2 | 1 | 1 | ||||
| T3/T4 | <0.001 | 2.184 | 1.510–3.159 | 0.026 | 1.651 | 1.063–2.564 |
| LNM | ||||||
| N0 | 1 | 1 | ||||
| N1 | <0.001 | 3.072 | 2.092–4.511 | <0.001 | 2.495 | 1.623–3.835 |
Bold type indicates statistical significance.
Discussion
Metabolic reprogramming is widely observed in cancer cells (7). It is already known that oncogenes and tumor suppressors can drive the altered cellular metabolism in cancer (35, 36), and emerging evidence (36–41) supports that many metabolic deregulations, such as aerobic glycolysis, fatty acid synthase, and serine and glutamine metabolism, are responsible for maintaining and enhancing cancer cell proliferation, survival, and metastasis. Regulators of metabolism in cancer have been identified as oncogenes or tumor suppressors (39, 42–48), which are revealed as potential therapeutic targets. Recently, proteins of some metabolic genes have been reported to be involved in proliferation, invasion, and progression of thyroid cancer, such as stearoyl-CoA desaturase 1 (12) in aberrant lipid metabolism, alteration of mitochondrial superoxide dismutase (encoded by SOD2) in oxidative stress (13), and glutaminase-mediated glutamine dependence (17). This study investigated the differential metabolic genes among NTs, PTCs, and DDTCs from three cohorts to identify a useful signature of metabolic genes indicative of dedifferentiation of thyroid cancer.
In our study, we used one discovery cohort and two validation cohorts to screen out aberrant metabolic genes in DDTC, and we further used the TCGA cohort to search for independent risk factors for the low-differentiated phenotype of PTC as a signature indicative of PTC dedifferentiation. As a consequence, a signature of five metabolic genes was identified, including LPCAT2, ACOT7, HSD17B8, PDE8B, and ST3GAL1. The signature was then confirmed to harbor high predictive value of DDTC both in the TCGA cohort and in the combined GEO cohort. Additionally, the high-risk score of the signature was significantly associated with aggressive features such as T3/T4, ETE, LNM, III/IV stage, and BRAFV600E mutation in PTC patients, and downregulations of LPCAT2 and ST3GAL1 correlated with decreased DFS of patients with thyroid cancer. These findings suggest that the signature not only serves as an indicator of DDTC independent of genetic mutations and clinicopathological factors, but it also predicts poor clinical outcomes of patients with PTC. A metabolic gene signature indicative of PTC dedifferentiation, which may assist in recurrence risk stratification, evaluation of the therapeutic response of radioiodine, and in prediction of long-term clinical outcomes of patients with PTC, and serve as potential targets for treating DDTC, has been proposed.
In further analyses, we found that the signature was related to activation of biological signaling pathways capable of driving tumor development and progression, implying that metabolic genes of the signature may be involved in functional regulation of thyroid cancer by their mediated metabolic pathways. LPCAT2 is recognized as lyso–platelet-activating factor acetyltransferase involved in platelet-activating factor biosynthesis, and altered expression of LPCAT2 has been found to be associated with several types of cancer. As shown in our study that LPCAT2 mRNA is a biomarker for the aggressiveness of PTC, Agarwal and Garg (49) found that LPCAT2 expression is significantly correlated with breast and cervical cancers, which is consistent with the findings of Williams et al. (50) that LPCAT2 is a novel aggressive prostate cancer susceptibility gene. Cotte et al.’s (48) recent findings reveal that LPCAT2-mediated lipid droplet production supports colorectal cancer chemoresistance. ACOT7 is a major isoform of the ACOT family that catalyzes hydrolysis of fatty acyl-CoAs to free fatty acids and CoA-SH. Our findings indicated that ACOT7 at mRNA levels significantly increased in DDTC. Jung et al. (51) observed that low ACOT7 levels prolonged overall survival periods in patients with breast and lung cancer and suggested that ACOT7 is involved in cell cycle progression via regulation of the PKCζ–p53–p21 signaling pathway. Liu et al. (52) also found that high expression of ACOT7 is associated with poor clinical outcomes in patients with lung cancer. HSD17B8 was observed to decrease in tumor tissues compared with surrounding healthy tissue in squamous cell carcinoma in a study by Reinders et al. (53), which is consistent with our result that HSD17B8 was downregulated in DDTC in comparison with NTs and PTCs. PDE8B is a gene encoding a high-affinity cAMP-specific phosphodiesterase, which alters thyroid hormone levels in the serum and affects TSH release from the pituitary by affecting cAMP concentrations in the thyroid, as mentioned in previous studies (54, 55). We observed that PDE8B expression decreased remarkably in DDTC, which has been previously identified in ATC (56). ST3GAL1 encodes a key sialyltransferase that adds α2,3-linked sialic acid to substrates and generates core 1 O-glycan structure. ST3GAL1 sialylation has been implicated in several cancer types of the breast, colorectum, bladder, ovary, and glioblast (57–60). In our study, ST3GAL1 was identified as a dedifferentiation-associated indicator in patients with thyroid cancer. Therefore, the five metabolic genes included in the signature may act as oncogenes or tumor suppressors in the malignant transformation of thyrocytes and adjust the metabolic reprogramming to aggressive progression of thyroid cancer correspondingly, which provides more deep insights into possible molecular mechanisms of dedifferentiation from PTC to PDTC from the perspective of metabolic pathways. BRAFV600E mutation, as an oncogene mutation, exerts extensive effects on oncogenic signaling pathways in thyroid cancer. In this study, although BRAFV600E mutation was associated with low differentiation in univariate analyses, it failed to be significant compared with the metabolic gene signature in multivariate analyses. According to our results, BRAFV600E mutation was a risk factor for the high-risk score signature, and it was associated with changes in some metabolic pathways in both PTC and DDTC. We speculate that BRAFV600E may be an effective upstream activator of metabolic reprogramming in BRAFV600E-mutant thyroid cancer. There was no significant correlation of other genetic alterations such as TERT, EIF1AX, and ETV6_NTRK3 with differentiated phenotype or the metabolic gene signature in this study, which requires further investigations to verify the outcomes.
Finally, there are some limitations to the current study. PDTC sample 5 (case 4) is different from the other four PDTC samples in the FUSCC cohort in Fig. 2(d), and two samples of ATC samples in the GSE29265 cohort are not clustered in Fig. 2(e). The correlation analyses of all mRNA transcripts between nonclustering samples and the other samples showed no significant difference in RNA-seq. The sample 5 harbored BRAFV600E mutation combined with TP53 mutation and PIK3CA mutation in comparison with somatic mutations of other four samples, which may cause expression alterations in metabolic genes. Because the genomic data of two samples were not available in the GEO database, it limited our further analyses. Owing to the limited number of patients with thyroid cancer enrolled in the study, the predictive effect and clinicopathological correlations of the signature in the FUSCC cohort are not available. Although the signature of the five metabolic genes was observed to be a potent biomarker for DDTC, the mediated mechanisms of the five genes in dedifferentiation have not yet been clarified. Therefore, on one aspect, our work in the next step is to fulfill validating the signature in a large cohort of patients with PTC and DDTC with therapeutic outcomes of radioiodine and long-term follow-up; on the other aspect, it is necessary to perform experimental research in PTC and ATC cells in vivo and vitro to investigate the biological roles of aberrant metabolic pathways caused by the five genes in loss of differentiation.
In summary, we found that significant deregulations of metabolic pathways were correlated with the differentiation status of PTC. A signature of five metabolic genes was not only predictive of DDTC but also significantly associated with poor clinical outcomes of patients with PTC. Our findings suggest that metabolic deregulations mediate dedifferentiation of PTC, and the metabolic gene signature can be used as a biomarker for DDTC.
Acknowledgments
We thank Zhendong Gao for his help in the current study. We thank the University of California Santa Cruz Xena Platform for cancer genomics data sets, the cBioPortal for Cancer Genomics, and the GEO platform of the National Center for Biotechnology Information.
Financial Support: This work was supported by the National Natural Science Foundation of China (Grants 81572622 and 81772854 to Q.J., 81502317 to W.W., and 81472498 and 81772851 to Yulong Wang) and the Science and Technology Commission of Shanghai Municipality (Grant 16411966700 to Yu Wang).
Disclosure Summary: The authors have nothing to disclose.
Abbreviations:
- ACOT7
acyl–CoA thioesterase 7
- ATC
anaplastic thyroid cancer
- AUC
area under the curve
- CoA
coenzyme A
- DDTC
dedifferentiated thyroid cancer
- DFS
disease-free survival
- DTC
differentiated thyroid cancer
- ETE
extrathyroidal extension
- FUSCC
Fudan University Shanghai Cancer Center
- GEO
Gene Expression Omnibus
- GSEA
gene set enrichment analysis
- HSD17B8
hydroxysteroid 17β-dehydrogenase 8
- KEGG
Kyoto Encyclopedia of Genes and Genomes
- LNM
lymph node metastasis
- LPCAT2
lysophosphatidylcholine acyltransferase 2
- NES
normalized enrichment score
- NT
normal thyroid
- PDE8B
phosphodiesterase 8B
- PDTC
poorly DTC
- PTC
papillary thyroid cancer
- RNA-seq
RNA sequencing
- ROC
receiver operating characteristic
- ST3GAL1
ST3 β-galactoside α-2,3-sialyltransferase 1
- TCGA
The Cancer Genome Atlas
- TDS
thyroid differentiation score
- TNM
tumor/lymph node/metastasis
References
Author notes
B.M. and H.J. contributed equally to this study.
