


Abstract
Enteroendocrine L cells release satiety inducing hormones in response to stimulation by luminal macronutrients. We sought to profile the differential effect of macronutrient type and site of release on circulating concentrations of the L cell-derived enteroendocrine hormone peptide tyrosine tyrosine (amino acids 1 to 36) (PYY).
Eight healthy volunteers were recruited to a randomized, double-blinded, six-way crossover study. At each visit, the participants consumed a 500-kcal drink containing carbohydrate, protein, or fat in either gastric or small intestinal release formulations. Plasma PYY concentrations and hunger ratings were assessed for 3 hours after consumption of the test drink. The food intake was recorded thereafter at an ad libitum lunch.
Microcapsular formulations targeting the distal small intestinal delivery of fat, but not carbohydrate or protein, markedly enhance PYY release relative to macronutrient delivery in gastric release formulations. Food intake at an ad libitum meal was lowest after consumption of the formulation releasing fat at the distal small intestine.
Targeting of fat to the distal small intestine in delayed release microcapsules enhanced PYY release and was associated with reductions in food intake.
Ingestion of food instigates the release of a battery of enteroendocrine peptide hormones that help control gut motility and digestive secretion. Together, these gut responses also coordinate postabsorptive events such as endocrine pancreatic function and short-term energy balance. The evolved function of this enteroendocrine response is, therefore, to ensure adequate nutrient assimilation and good metabolic control (1). Peptide hormone products of the enteroendocrine L cell play multiple roles in this milieu in relation to the regulation of pancreatic islet function and gastric emptying and the induction of satiety pathways in the central nervous system. L-cell density increases aborally along the longitudinal axis of the small intestine and is maximal in the proximal colon (2, 3).
Peptide YY or peptide tyrosine tyrosine (PYY) is a key L-cell–derived hormone that has been implicated in satiety signaling. PYY transmits a satiety inducing signal to the hypothalamus, stimulating the pro-opiomelanocortin neurons of the arcuate nucleus, resulting in downstream melanocortin 4 receptor-dependent inhibition of orexigenic pathways (4). PYY also reduces gastric emptying and promotes fullness (5). Thus, through multiple mechanisms, PYY represents an important postprandial check on food intake.
We have previously shown that PYY responses can be increased incrementally during mixed meal tests by step-wise elevation of caloric content (6). The administration of exogenous PYY resulted in reductions in ad libitum food intake (6, 7). The dynamic regulation of endogenous PYY release in response to caloric load is disrupted in obesity (6).
In both normal-weight subjects and patients with obesity, the intake of protein-enriched mixed-meals in excess of 1000 kcal (4184 kJ) induced a greater PYY response and increased satiety compared with fat- or carbohydrate-enriched equicaloric test meals (8). However, dietary fat is also recognized as a potent stimulus for the release of PYY (9). To the best of our knowledge, the relative effect of equicaloric loads of individual macronutrients on PYY release has not previously been assessed.
We, and others, have previously demonstrated that Roux-en-Y gastric bypass surgery, which delivers food rapidly to the distal small intestine, also results in reductions in ad libitum food intake (10). These occur in tandem with exaggerated plasma PYY responses. Recently, gastric acid-resistant microcapsular formulations have been developed that could be useful vehicles for targeting the release of macronutrients to the distal small intestine (11). This could partly recapitulate the dynamics of food delivery to the small intestine seen after Roux-en-Y gastric bypass surgery. Pilot studies loading these microcapsules with a sucrose/casein mix confirmed their capacity to target macronutrients to the distal small intestine; however, the sucrose/casein formulation only reduced subsequent ad libitum food intake by ∼7% (12).
In the present study, we used the described microcapsule technology in a randomized double-blinded crossover study designed to systematically examine the effects of individual macronutrients on plasma PYY responses and how this varied according to the release site. We hypothesized that given the proximal to distal gradient in L-cell distribution, the distal release of macronutrients would enhance the integrated 3-hour PYY response. By sequentially administering individual macronutrients across multiple study visits, we tested the hierarchy of PYY responses to individual macronutrients. Specifically, we examined whether the potency of individual macronutrients to stimulate PYY secretion varied as a function of macronutrient type and/or site of release (stomach vs distal small intestine). We furthermore explored the effect of macronutrient type and site of release on the subjects’ ratings of hunger and ad libitum food intake.
Materials and Methods
Microcapsule design
Microcapsules were produced in accordance with Good Manufacturing Process standards (AnaBio Technologies, Ltd., Carrigtwohill, Ireland). Proteinaceous microcapsular material was denatured and subsequently used to separately microencapsulate specific macronutrients. Microencapsulation was achieved by mixing the denatured proteinaceous capsular material and the active ingredient, followed by coextrusion through a 1 µm-pore-size nozzle. The finished material to be used in the subsequent trial was in a dry, flow-able powder format. The recommended microcapsule production process temperature was 20° to 25°C, because higher temperatures, especially in combination with turbulence, can lead to reduced microencapsulation efficiency and losses of active material. Zeta potential was used to determine both attractive and repulsive features between the active agent and (matrix) proteinaceous material within the microcapsules generated. The magnitude of interactions was optimized at ±25 mV to ensure the generation of microcapsules with electrostatic potential most suitable for storage in a dry format without oxidative, moisture, or acid stress.
Study design
The St. Vincent’s University Hospital ethics and medical research committee approved the present randomized, double-blind, six-way crossover study. All the patients provided written informed consent. The exclusion criteria included metabolic dysfunction or any other condition or comorbidity that could have compromised the compliance rates and ability to participate, such as diabetes, obesity, smoking, substance abuse, pregnancy, use of medications, and chronic medical or psychiatric illness.
In our pilot study, eight healthy volunteers (three women) aged 18 to 50 years with normal fasting glucose levels, stable body weight for at least the previous 3 months, and a body mass index <30 kg/m2 were recruited. Participants attended six study visits at which they received each of the microcapsule drinks (formulation listed in Table 1) in random order. These included carbohydrate released in the stomach (C-S), carbohydrate released in the distal small intestine (C-DSI), protein released in the stomach (P-S), protein released in the distal small intestine (P-DSI), fat released in the stomach (F-S), and fat released in the distal small intestine (F-DSI). Washout between visits was achieved by scheduling sequential visits at a minimum interval of 7 days. The participants completed the study over 2 months. Randomization and concealed allocation was conducted using Internet-based software (www.randomizer.org). Before each study visit, compliance was assessed, and the participants were asked to confirm that they had refrained from strenuous exercise and alcohol for 24 hours and had fasted from 10 pm the previous night. On the morning of each study day, anthropometric measurement were taken. The participants then had a cannula placed in the forearm, and a baseline blood sample was taken, in addition to a baseline visual analog scale (VAS) of the participant’s hunger. One plasma sample [EDTA-containing Vacutainer® (Becton Dickinson, Dun Laoghaire, Ireland)] and one serum sample were taken at each time point, with a total volume of 10 mL of blood drawn per time point.
Macronutrient Composition of Drinks
| Drink | Release Location | Source | Dry Weight (g) | Total Calories (kJ) |
|---|---|---|---|---|
| Carbohydrate | C-S | Sucrose | 125 | 2092 |
| Carbohydrate | C-DSI | Sucrose | 125 | 2092 |
| Protein | P-S | Caseinate | 125 | 2092 |
| Protein | P-DSI | Caseinate | 125 | 2092 |
| Fat | F-S | Oleic acid | 55.5 | 2092 |
| Fat | F-DSI | Oleic acid | 55.5 | 2092 |
The subjects then received a 2092 kJ drink consisting of one of the microcapsule preparations. The composition of each drink is presented in Table 1. All the microcapsules had a comparable taste, because the microcapsular formulation prevented interaction of the carbohydrate, protein, or fat content with the taste buds. To standardize palatability, the microcapsules were diluted in 500 mL water and a cordial flavoring was added (zero calories MiWadi squash; MiWadi, Dublin, Ireland). The microcapsules were formulated to release the contents in either the stomach or the distal small intestine (P12552EP00; patent pending). The participant was instructed in a standardized manner to consume the drink during a 10-minute period. Next, a timer was started. At each study visit, the subjects were invited to complete a sensory properties questionnaire in which each drink was rated according to the appearance, texture, palatability, and feeling of fullness on its completion (satiation). The participants selected from predefined descriptors that best reflected their rating of the drink for each sensory parameter. A series of venous blood samples were then taken every 30 minutes for a period of 3 hours from the cannula in the forearm. The EDTA plasma and serum Vacutainer® tubes were kept at 4°C during the visit and separated immediately thereafter by centrifugation at 3000g for 10 minutes, with subsequent storage of the supernatant at −20°C until analysis.
After the 3 hours had elapsed, the participants were offered a standardized ad libitum mixed meal of, on average, 5439 kJ to measure their food intake. The participants selected their mixed meal from a choice of four calorie density comparable options (sweet and sour chicken, chicken korma, macaroni and cheese, and pasta bake) at the beginning of the study and received the same meal at each visit. The energy and macronutrient composition of each meal is presented in Table 2. The meals were prepared such that one could not pick out certain ingredients over others. The chicken and vegetables were chopped into smaller pieces and mixed well with the rice and sauce. No technology was permitted during the meal, and the participants ate in isolation to remove social influences. To prevent the subjects from rushing, they were instructed to remain for ≥20 minutes after the meal had started, irrespective of when they had finished eating. The quantity of food consumed was recorded by weighing the food before and after consumption. The caloric intake was subsequently calculated.
Macronutrient Composition of Standardized ad Libitum Mixed Meal (Calculated From Food Labels)
| Variable | Meal Type | |||
|---|---|---|---|---|
| Chicken Korma and Rice | Sweet and Sour Chicken and Rice | Macaroni and Cheese | Pasta Bake | |
| Participants, n | 6 | 2 | 0 | 0 |
| Serving size, g | 770 | 760 | 745 | 896 |
| Energy/100 g, kJ | 707 | 715 | 728 | 607 |
| Total energy, kJ | 5443 | 5434 | 5423 | 5438 |
| Carbohydrate, % | 45 | 53 | 51 | 51 |
| Protein, % | 21 | 15 | 18 | 16.5 |
| Fat, % | 34 | 32 | 31 | 32.5 |
Plasma analysis
Commercially available ELISA kits (catalog no. EZHPYYT66K; Merck KGaA, Darmstadt, Germany) were used to quantify the total human PYY levels. The intra-assay coefficient of variation for the test was 5.8%. The plasma glucose concentration was measured after the administration of the macronutrients in both the gastric and the distal release formulations to verify the discrete release kinetics of the formulations previously described (12). The glucose levels were analyzed using Roche Cobas 8000/c702 (GLUC3; Roche, Mannheim, Germany) with an intra-assay coefficient of variability of 0.8%.
Statistical analysis
The primary outcome in the present study was the integrated PYY area under the curve (AUC). Subsequent food intake was assessed as a secondary outcome. Analyses of the end points was only conducted for completed cases without imputation. One female participant withdrew at week 1 owing to difficulty with the cannulation, and all her data were censored. Two male individuals did not consume the ad libitum meal on one occasion each, and both were censored from the present analysis. One male individual experienced a fainting episode on one visit, and his blood results for that visit was censored. Therefore, the replication for the primary end point was seven participants and for the secondary end point was six participants.
All the data were tested for normality using the D’Agostino-Pearson omnibus normality test. Descriptive statistics for all normally distributed data are presented as the arithmetic mean ± SEM.
Statistical modeling of the data for the primary and secondary outcomes was conducted using the R package “stats” (https://www.R-project.org/). A generalized linear model (GLM) incorporating the baseline PYY concentration, age, and sex was created to investigate the effect of macronutrient type and delivery site on the PYY AUC over 180 minutes after microcapsule consumption. Sex was noted to interact with the intervention to modify the ad libitum food intake; therefore, a GLM incorporating the baseline PYY concentration, age, and intervention*sex interaction was constructed to examine the effect of macronutrient type and delivery site on the ad libitum food intake at 180 minutes after microcapsule consumption. The baseline ad libitum food intake values were not available for inclusion as covariates in the GLM of ad libitum food intake. No serious violations of GLM assumptions were found on examination of the distribution of residuals.
A linear mixed effects model, incorporating subject-specific random intercepts, baseline PYY concentration, age, and sex, was used to examine the effect of macronutrient type and delivery site on the per minute change in the PYY concentration after microcapsule consumption. The function “lmer” from the R package “lme4” was used to fit and test the linear mixed effects model (13). No serious violations of model assumptions were found on examination of the distribution of residuals.
Estimated marginal means were derived for each model using the R package “emmeans” (https://CRAN.R-project.org/package=emmeans). Post hoc pairwise comparisons were conducted to assess the effect of macronutrient type and delivery site on the per minute PYY AUC, per minute change in PYY, and ad libitum food intake. Estimated marginal means and their associated standard errors, 95% CIs, and P values are presented. P < 0.05 was considered statistically significant. Comprehensive cross-tabulated results from the GLM and linear mixed effects model have been deposited in a publicly accessible data repository (14).
Two-way repeated measures ANOVA was conducted in GraphPad Prism to assess the relative effects of each of the six treatments on the AUC for the hunger VAS. Statistical significance was set at P < 0.05.
Results
The baseline characteristics are presented in Table 3. Subject weight did not differ across the study period (P = 0.32).
Baseline Characteristics
| Characteristic | Value |
|---|---|
| Age, y | 28.8 ± 3.5 |
| Women, % | 37.5 |
| Weight, kg | 81.8 ± 7.2 |
| Body mass index, kg/m2 | 26.5 ± 1.4 |
| Waist circumference, cm | 89.1 ± 4.8 |
| Characteristic | Value |
|---|---|
| Age, y | 28.8 ± 3.5 |
| Women, % | 37.5 |
| Weight, kg | 81.8 ± 7.2 |
| Body mass index, kg/m2 | 26.5 ± 1.4 |
| Waist circumference, cm | 89.1 ± 4.8 |
Data presented as mean ± SEM; complete data for eight subjects presented.
Sensory details
A partial set of responses for sensory data were collated from the participants. In summary, five participants responded for the C-S formulation, three for the C-DSI formulation, seven for the P-S formulation, eight respondents for the P-DSI formulation, four for the F-S formulation, and eight for the F-DSI formulation. Figure 1 shows the response rate for each sensory property. From a qualitative perspective, the sample responses did not indicate the presence of any clear relationship between the participants’ perceptions of the appearance of the drink and the microcapsule type. Regarding the texture, the drinks were most frequently rated as either smooth or floury. The F-S formulation was the only one for which no participant indicated a strong dislike. Both protein formulations were uniformly disliked. The C-S formulation was associated with the highest ratings of fullness.
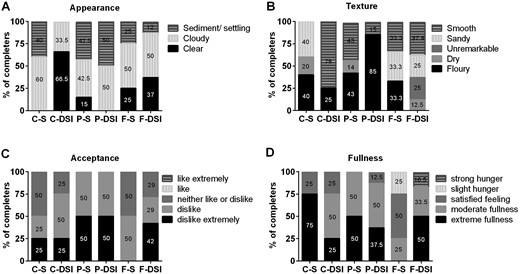
Sample ratings of sensory properties of the microencapsulated drinks. At each visit, the subjects were asked to complete a sensory properties questionnaire to rate the (A) appearance, (B) texture, and (C) palatability of the drink and (D) their feeling of fullness on completion of the drink. The drinks included C-S (n = 5), C-DSI (n = 3), P-S (n = 7), P-DSI (n = 8), F-S (n = 4), and F-DSI (n = 8).
Confirmation of microcapsule release location
The AUC for glucose after the C-DSI meal was significantly lower than the AUC for glucose after the C-S meal (1004 ± 58.9 vs 875 ± 43.2; P = 0.04). This resulted as a consequence of a loss in the 30-minute peak in plasma glucose, suggestive of impaired proximal glucose absorption and, thus, supportive of the ability of the DSI formulations to delay release of the macronutrient cargo to a point beyond the proximal small intestines. No statistically significant differences were found in the plasma glucose after consumption of protein released in the stomach (847.4 ± 19.4) vs the distal small intestine (848 ± 32.01; P = 0.99) or between fat released in the stomach (875.9 ± 33.8) vs the distal small intestine (888.2 ± 22.48; P = 0.99).
PYY responses
The F-DSI treatment significantly increased the per minute PYY trajectory compared with all other treatments, with an effect size of approximately +0.90 ± 0.10 pg/mL/min during the course of the 180-minute observation period (Fig. 2) (14). P-S also increased the PYY trajectory relative to F-S, although the effect size was smaller at 0.42 ± 0.14 pg/mL/min. Similarly, distal small intestinal delivery of fat substantially increased the PYY AUC for the 180-minute observation period compared with all other macronutrient types and release sites (Fig. 2) (14). No other macronutrient types or release sites significantly altered the PYY AUC.
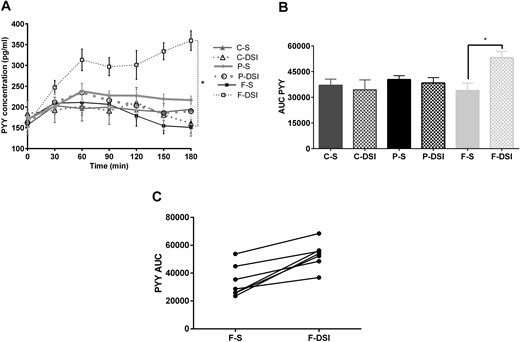
Effect of individual macronutrients and site of delivery on plasma PYY. (A) Evolution of plasma PYY response over 180 min, captured at 30-min intervals, presented as the concentration of PYY at each time point. (B) AUC for PYY across 180 min. Data presented as mean ± SEM. (C) Individual treatment day differences from fat treatment groups (data for seven subjects presented). *P < 0.05.
VAS for hunger
No substantial difference was found between the AUC for hunger for the different formulations (Fig. 3A). However, an apparent difference was found in the duration of reduced hunger between treatments. P-S resulted in a substantial reduction in hunger that lasted until 120 minutes, P-DSI resulted in a substantial reduction in hunger until 90 minutes, C-S resulted in a substantial reduction in hunger until 90 minutes, C-DSI resulted in a substantial reduction in hunger until 150 minutes, F-S resulted in a substantial reduction in hunger for only 30 minutes, and F-DSI resulted in a substantial reduction in hunger until 150 minutes (Fig. 3A). In all treatments, the premeal hunger levels had returned to baseline at 180 minutes, and no substantial differences in the VAS ratings were found at this point among the treatments (Fig. 3B).
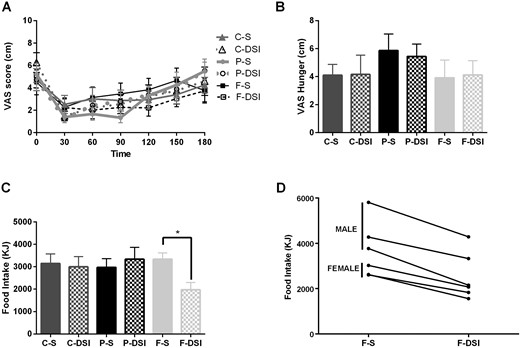
Premeal hunger rating and ad libitum food intake. (A) VAS ratings of hunger during a 180-min period. (B) VAS ratings of hunger at 180 min (before the meal). (C) Total food intake of the ad libitum lunch meal. (D) Individual treatment day differences from fat treatment groups. Data presented as mean ± SEM. Data for seven subjects presented for VAS ratings and for six subjects for food intake. *P < 0.05.
Ad libitum food intake was consistently reduced by the F-DSI formulation compared with the other preloads (Fig. 3C), including the macronutrient-matched F-S formulation (P = 0.046). Sex was noted to interact with the intervention to modify ad libitum food intake. The mean intake across the six interventions for the women vs men was 2442 ± 165 vs 3308 ± 171 kJ (P = 0.0006). Therefore, a GLM incorporating the baseline PYY concentration, age, and intervention*sex interaction was constructed to examine the effect of macronutrient type and delivery site on ad libitum food intake at 180 minutes after microcapsule consumption. Ad libitum food intake was lower across all interventions in the women compared with the men (14). In all participants of both sexes, a decrease in food intake occurred after F-DSI relative to F-S. The magnitude of the decrease in ad libitum food intake in the women after F-DSI was lower given their generally lower food intake and was not important relative to that after F-S. In the male participants, a statistically significant reduction in ad libitum food intake of 1703 ± 541 kJ (P = 0.02) was noted after F-DSI relative to after F-S (14).
Adverse events
Nausea and loose stool motions were reported by four of the eight subjects later on the day they had received the F-DSI preparation. None of these symptoms occurred before or during the meal, and all had completely resolved within 24 hours. None of these subjects reported any nausea or loose stool motions on any of the other days; thus, the phenomenon was specific for the F-DSI trial day.
Discussion
The objectives of the present study were to define the relative effect of isocaloric loads of pure carbohydrate, protein, and fat on plasma PYY responses; determine whether the magnitude of the plasma PYY responses varied depending on the site of release in the gastrointestinal tract; and assess, as an exploratory outcome, whether subsequent ad libitum food intake varied according to macronutrient type and site of delivery. The most notable observation was the marked exaggeration of the PYY plasma response when microcapsules carrying fat but not carbohydrate or protein were delivered to the distal small intestine.
Murine studies profiling the enteroendocrine cell type and density along the longitudinal axis of the intestine have pointed to a progressive enrichment of L cells distally, and, although glucagon-like peptide-1 positivity appears to be a ubiquitous feature of L cells, irrespective of the site of origin, PYY-releasing L cells are characteristic of more distal segments of the small intestine and colon (15, 16). The results arising from the unique experimental design in the present study have allowed us to suggest that distal L cells respond more potently to a fat stimulus than to either carbohydrate or protein stimuli. Exaggerated distal L-cell responses to fat stimulation intuitively make sense as a corrective response to the abnormal physiological stimulus.
Because the data presented suggest that distal L cells respond most potently to a fat stimulus, a selective enrichment of fat sensory activity at the receptor and signal transduction level might be operative in L cells of more distal origin in the gut. In the present study, the fat stimulus used was enriched in the monounsaturated fatty acid oleic acid. Partial hydrolysis of triglycerides containing oleic acid generates ligands for the lipid sensing Gαs containing G protein-coupled receptor Gpr119, and evidence in L cells from human and animal studies has demonstrated that oleic acid derivative-induced stimulation of Gpr119 signaling couples fat sensory activity to cAMP-dependent promotion of L-cell hormone release (17, 18). Murine studies have indicated that the Gpr119 fat-sensing activity is more characteristic of L cells of distal origin (19). Elucidation of signaling events further downstream in L cells have recently been conducted and have implicated ERK signaling as being selectively activated by fat sensing (20).
We have, thus, inferred from our data that, in the human setting, a shift in bulk loading of fat to distal regions of the small intestine stimulates an L-cell population enriched for PYY secretory capacity. This inference from the data from humans is coherent with, and supported by, the murine experimental data indicating the prominence of PYY as a secretory product of distal L cells (16) and concomitant enrichment of Gpr119-dependent responses in distal populations.
Ad libitum food intake in the present study was lowest on the day when fat was delivered to the distal small intestine. Dietary fat is typically digested and largely absorbed in the jejunum. Using distinct, but comparable, experimental approaches, other methods of delivering fat directly to the distal small intestine or preventing its digestion until that point have also been shown to reduce food intake. Ileal infusion of a lipid emulsion in healthy subjects reduced food intake and delayed gastric emptying compared with control infusions (21). The same effect was not observed with intravenous infusion of fat, suggesting that a postingestive/preabsorptive signal is operative, implicating the gut as the source of the effects induced by fat (21). A study of healthy volunteers in whom fat was delivered via a nasal tube to the duodenum, jejunum, and ileum demonstrated that ileal treatment had the most pronounced effect on food intake and satiety (22).
An alternative method of delaying fat digestion experimentally is via rerouting of bile flow from the proximal to the distal small intestine. Bile diversion to the ileum, but not the duodenum or jejunum, has been reported to have comparable, even superior, weight loss and metabolic benefits to Roux-en-Y gastric bypass in an animal model (23). Moreover, maneuvers that shift the digestive and absorptive processes more distally in the distal small intestine have been harnessed clinically as treatments of obesity (e.g., intestinal bypass in bariatric surgery and pharmacological inhibition of pancreatic lipase using orlistat). The mechanism of action in both examples has been attributed in part to adaptive changes in L-cell number and satiety signaling capacity and resultant decreases in food intake (24–27).
Our data are coherent with those obtained using different paradigms to defer fat digestion to more distal sites in the intestine and suggest that the dominant effect of distal fat delivery as a driver of reduced food intake is partly linked to specific exaggeration of plasma PYY responses. Using pure macronutrient stimuli, fat appears to be a stronger stimulus for PYY release than either carbohydrate or protein. Fat delivered to the small intestine also yielded the lowest level of ad libitum food intake. Although a study in rats found that ileal infusions of glucose reduced food intake more than did duodenal glucose (28), these findings have not been replicated in humans.
Previously, using carbohydrate-, protein-, or fat-enriched meals, Batterham et al. (8) demonstrated that protein enrichment was most effective in terms of inducing satiety and augmenting postprandial PYY responses. The results of the present study appear, at first glance, to proffer a different thesis; however, important differences in the experimental objectives and design mean that the studies are not in conflict because a direct comparison of outcomes is not possible. For example, in our study, we used a 500-kcal preload instead of an enrichment of protein within the context of a 1000-kcal mixed meal. Moreover, we used the long-chain monounsaturated fatty acid oleic acid as the fat stimulus (instead of Calogen (Nutricia Medical Ireland, Dublin, Ireland) as a fortificant, which is a 60:35:5 mix of monounsaturated fatty acid/polyunsaturated fatty acid/saturated fatty acid). Oleic acid-containing lipids are potent Gpr119 agonists (19), and we directed nutrient exposure to the distal small intestine, maximizing the response to fat. Moreover, some evidence exists to suggest that protein consumed in a beverage elicits a diminished satiety response compared with that with a solid meal (29, 30).
Study limitations and perspectives
The small number of participants in our proof-of-principle study was sufficient to provide adequate experimental power to assess the changes in PYY release as the primary focus. However, a definitive study on the changes in food intake as a function of individual macronutrient preload would require a larger number of participants to optimally control for covariates. The effect of sex on food intake per se highlights this fact. Missing data from the sensory assessment of the various formulations prevented us from providing definitive insight into the contribution of preingestive visual cues and orosensory stimuli related to taste and texture to the observed differential outcomes with the F-DSI formulation. It has been well recognized that the visual assessment of meal size and differences in texture relating to the viscosity/thickness of liquids can influence food intake in an anticipatory fashion according to the perceived satiating value of a meal, potentially via modulation of gastrointestinal hormone responses during the cephalic and oral phases (31). For example, creamy thicker liquids will be consumed more slowly and conform to the learned beliefs of satiation (32). Thus, differences in the calorie content in the context of equivalent viscosity can remain undetected in terms of the effects on satiation and satiety. The addition of a thickener can help subjects register increased satiation and satiety when the calorie content in liquids has been increased (33). However, in the context of the present findings, we found no single line of evidence from the sensory data obtained from the distal small intestinal formulation of fat relative to the other treatments that pointed to the changes in PYY release and food intake being predominantly preingestive in origin. That said, the proportional contribution of preingestive factors to the main effect in the study could not be definitively discerned.
Future studies using distal release microcapsules should be more application focused, using food intake as the primary outcome in a larger study involving careful quantification of the contribution of preingestive factors. Evidence for a titratable effect on PYY and satiety should be sought to identify whether reductions in ad libitum food intake can be prompted without associated adverse events at follow-up.
Conclusion
A 500-kcal fat load in microcapsular formulation delivered to the distal small intestine relative to gastric release formulations provoked an increase in PYY response and yielded the lowest level of ad libitum food intake. The potential of microcapsule-based priming of the enteroendocrine response warrants further investigation as a method of effecting reductions in food intake and could hold potential as a noninvasive therapeutic tool in the clinical management of obesity.
Acknowledgments
The authors acknowledge Dr. Loai Shakerdi for his invaluable help in starting the study and the Clinical Research Centre, St. Vincent’s University Hospital, Dublin, Ireland, for support during the present study.
Financial Support: The present study was funded, in part, by the Health Research Board (grant USIRL-2016-2 to C.W.l.R.) and by Anabio Technologies Ltd. (to A.M.M.).
Disclosure Summary: The authors have nothing to disclose.
Abbreviations:
- AUC
area under the curve
- C-DSI
carbohydrate released in the distal small intestine
- C-S
carbohydrate released in the stomach
- F-DSI
fat released in the distal small intestine
- F-S
fat released in the stomach
- GLM
generalized linear model
- P-DSI
protein released in the distal small intestine
- P-S
protein released in the stomach
- PYY
peptide tyrosine tyrosine
- VAS
visual analog scale
