


Abstract
Type 1 diabetes (T1D) is associated with an increased fracture risk at all ages.
To understand the determinants of bone health and fractures in children with T1D.
Case-control study of children with T1D on bone-turnover markers, dual-energy X-ray absorptiometry, and 3 Tesla-MRI of the proximal tibia to assess bone microarchitecture and vertebral marrow adiposity compared with age- and sex-matched healthy children.
Thirty-two children with T1D at a median (range) age of 13.7 years (10.4, 16.7) and 26 controls, aged 13.8 years (10.2, 17.8), were recruited. In children with T1D, serum bone-specific alkaline phosphatase (BAP) SD score (SDS), C-terminal telopeptide of type I collagen SDS, and total body (TB) and lumbar spine bone mineral density (BMD) SDS were lower (all P < 0.05). Children with T1D also had lower trabecular volume [0.55 (0.47, 0.63) vs 0.59 (0.47, 0.63); P = 0.024], lower trabecular number [1.67 (1.56, 1.93) vs 1.82 (1.56, 1.99); P = 0.004], and higher trabecular separation [0.27 (0.21, 0.32) vs 0.24 (0.20, 0.33); P = 0.001] than controls. Marrow adiposity was similar in both groups (P = 0.25). Bone formation, as assessed by BAP, was lower in children with poorer glycemic control (P = 0.009) and who were acidotic at initial presentation (P = 0.017) but higher in children on continuous subcutaneous insulin infusion (P = 0.025). Fractures were more likely to be encountered in children with T1D compared with controls (31% vs 19%; P< 0.001). Compared with those without fractures, the T1D children with a fracture history had poorer glycemic control (P = 0.007) and lower TB BMD (P < 0.001) but no differences in bone microarchitecture.
Children with T1D display a low bone-turnover state with reduced bone mineralization and poorer bone microarchitecture.
Adults with type 1 diabetes (T1D) have a significantly increased risk of fracture compared with the general population (1, 2). New presentation of T1D peaks between the ages of 9 and 14 years (3, 4), and given that childhood and adolescence are important physiological periods for optimal bone development (5), it is possible that these young people with T1D may be especially susceptible to abnormalities of bone health. Indeed, recent studies also confirm that children and young people with T1D may also have a higher risk of fractures (6, 7). Earlier studies have suggested that the deficit in bone mass in T1D may be present at an early stage after diagnosis (8), but it is unclear whether the duration of the condition or any other clinical parameters of diabetes or its control are associated with adverse skeletal morbidity. As the significantly increased fracture risk is disproportionate to the marginal reduction in bone mineral density (BMD) in adults with T1D (1), there is an increasing realization that a comprehensive assessment of bone requires an assessment of bone microarchitecture, as well as bone density (9).
Metabolic conditions that may affect bone health, such as diabetes, are also associated with marked alterations in body composition, adiposity, and bone marrow adiposity (10–12). Glycemic control in diabetes has been shown to be positively related to lumbar spine (LS) marrow adiposity (10, 13). MRI, with its ability to study microarchitecture, as well as bone marrow adiposity, promises to be a useful imaging modality. Indeed, recent MRI-based studies in young women with childhood-onset T1D revealed a deficit in trabecular bone microarchitecture (14). The current study was performed to determine whether these MRI-based findings in trabecular bone microarchitecture were present at an earlier age in children with T1D. The detailed multimodality analysis of bone health that was performed in these children also provided a mechanistic insight into the effect of diabetes on the developing skeleton.
Methods
Subjects
Children and adolescents, aged between 10 and 18 years old with T1D for at least 3 years, were recruited from the Pediatric Diabetes Service at the Royal Hospital for Children, Glasgow, United Kingdom, during the period August 2014 through January 2016. The diagnosis of T1D was based on clinical presentation and ongoing insulin requirement with autoantibody confirmation in uncertain cases. For the MRI-based studies, age- and sex-matched children and adolescents without T1D were recruited to provide a reference group. Exclusion criteria included other chronic diseases or medications known to affect bone health. Information on personal health; medication history and lifestyle habits, including dairy intake; use of vitamins or calcium supplementation; cigarette smoking; and a family history of early osteoporosis was collected. Age-appropriate questionnaires were used to collect information on level of physical activity (15, 16). Information was also collected on age at diagnosis; severity of initial presentation; disease duration; glycemic control, as measured by glycosylated HbA1c, averaged over the last 12 months; and presence of microvascular complications in the children with T1D. Glycemic control was categorized as good (HbA1c < 7.5% or < 58 mmol/mol), moderate (HbA1c 7.5% to 9.0% or 58 to 75 mmol/mol), or poor (HbA1c > 9.0% or > 75 mmol/mol) (17). A history of radiologically confirmed fractures was also collected, and in children with T1D, only fractures sustained after the diagnosis of T1D were included. The study protocol was approved by the West of Scotland Research Ethics Committee, and informed consent was obtained from the study participants.
Anthropometry and puberty staging
Age- and sex-adjusted z scores for height, weight, and body mass index were calculated using the LMS method based on UK population reference data (18). Puberty assessment was undertaken by a single researcher (S.C.C.) and categorized according to Tanner stages for girls and boys, with the additional option of self-assessment in those who did not want to be examined (19). For analysis, pubertal status was defined by genital status in boys and breast development in girls.
Biochemical markers of bone metabolism and GH/IGF-1 axis
In all 32 cases, blood samples were collected in the morning to coincide with the clinic visit and centrifuged and the supernatant stored at −80°C. Osteocalcin (OC), bone-specific alkaline phosphatase (BAP), and C-terminal telopeptide of type I collagen (CTX) were measured by ELISA (Immunodiagnostic Systems, Boldon, UK). The intra-assay variation for OC, BAP, and CTX was 1.4%, 9.6%, and 3.1%, respectively. Plasma IGF-I and its binding protein-3 and acid labile subunit (ALS) were also determined, using ELISA (Mediagnost GmbH, Reutlingen, Germany). Intra-assay variabilities were 16.0%, 2.9%, and 10.9%, respectively. Sclerostin was also measured by ELISA (TECO; Pathway Diagnostics, Surrey, UK) with intra-assay variation of 14.1%. PTH and alkaline phosphatase were measured using chemiluminescent microparticle immunoassay (Abbott Diagnostics, Lake Forest, IL) with intra-assay variations <6.3% and <8.0%, respectively. 25-Hydroxyvitamin D (25-OH vitamin D) was measured by liquid chromatography–tandem mass spectroscopy, based on an in-house method with an intra-assay variation of <10% (20).
Dual-energy X-ray absorptiometry
LS (L2 to L4) and total body (TB) measurements were acquired by a Lunar Prodigy densitometer (GE Medical Systems, Waukesha, WI) and analyzed using Encore software (Version 13.0; Novato, CA). As outlined in previous studies, reference data were used to calculate a predicted and a percentage predicted bone area (BA) for age and sex (21, 22). The reference data allowed for a comparison of the actual bone mineral content (BMC) of the individual with the predicted BMC of a subject of the same sex and BA from which the percentage predicted BMC, expressed as a SD score (SDS; BMC SDS) could be calculated. The coefficient of variation, calculated on repeated dual-energy X-ray absorptiometry (DXA) measurement of a phantom, was <1% of BMC and the in vivo coefficient of variation was <2.5%. DXA was also used to perform thoracolumbar vertebral fracture assessment, as previously described (23).
MRI assessment of microarchitecture
MRI images of the proximal tibia, with a resolution of 0.2 mm × 0.2 mm × 0.4 mm (slice thickness), were acquired with a 3 Tesla-MRI scanner (MAGNETOM Prisma; Siemens, Erlangen, Germany) using a transmit/receive extremity coil for the knee, as previously described (9, 14). A fully balanced true fast imaging with steady-state free precession (or TrueFISP) pulse sequence with the following parameters was used to provide a three-dimensional volume of isotropic resolution: echo time = 4.69 ms, repetition time = 10.83 ms, flip angle = 60°, number of averages = 15, field of view = 100 mm × 100 mm, matrix = 448 × 448, number of slices = 20, bandwidth (Hz) = 189, and total scan time = 10 minutes. A low pass filter was applied to the images to correct for any bone marrow inhomogeneity. The images were then coded and analyzed blind using MATLAB (MathWorks Inc., San Mateo, CA) to obtain measures for apparent bone volume-to-total volume ratio (appBV/TV), apparent trabecular number (appTbN), apparent trabecular thickness (appTbTh), and apparent trabecular separation (appTbSp). Standardized analysis was performed to obtain a mean value from five image slices (Slices 9, 10, 11, 12, and 13 out of the 20 slices) per participant. The images were of sufficiently good quality for analysis in 30 of the 32 cases and in all 26 controls.
MRS assessment of bone marrow adiposity
1H-Magnetic resonance spectroscopy (MRS) was performed using an 18-channel body array (anterior) and a 32-channel spine coil (posterior). Spectra were obtained from a 20-mm × 20-mm × 20-mm volume within the vertebral body of L3, using a method described previously (9, 14). A Point Resolved Spectroscopy Sequence with no water suppression was used with the following parameters: echo time = 30 ms, repetition time = 2000 ms, flip angle = 90°, number of averages = 80, bandwidth (Hz) = 1200, and total scan time = 2.5 minutes. Analysis was performed following fitting of the spectrum in the time domain using a nonlinear least-squares algorithm, advanced method for accurate, robust, and efficient spectral fitting (24), in the Java-based magnetic resonance user interface (or jMRUI) software package (25). The areas under the water peak and lipid peak were obtained and used to calculate the lipid-to-water ratio and percentage fat fraction (%FF)as a measure of bone marrow adiposity (26). MRS analysis was performed in 29 cases and in 26 control participants.
Sample size calculation and statistical analyses
The primary hypothesis was that children with T1D would have a lower appBV/TV compared with healthy children. The estimated coefficient of variation for appBV/TV was <5% in our previous work (9, 14), and based on this, a 7.5% difference at P < 0.05, with a power of 0.8, would require at least 25 subjects in each arm. Data were analyzed using IBM SPSS software (Version 22; SPSS, Chicago, IL) and described as medians (ranges). Group differences between cases and controls were initially compared by Mann-Whitney test for continuous variables and χ2 test for categorical variables and then adjusted for multiple testing using false discovery rates (27). Specifically, biochemical markers of bone-turnover and DXA parameters were compared against zero, using the above tests, depending on the variables. Spearman’s rank correlation coefficient was used to assess the association between variables. Further analysis was performed to compare the characteristics of those children with T1D with a history of fractures with those without fractures. Factors significant on univariate analysis (HbA1c, TB BMC, and physical activity score) were included in a multivariate logistic regression for comparison between the fracture and nonfracture groups. All continuous data were presented as median (ranges), with P < 0.05 considered as significant, unless otherwise specified.
Results
Clinical characteristics
Thirty-two children with T1D, median (range) age 13.7 years (10.4, 16.7), were recruited (Table 1). The median age at diagnosis was 5.9 years (1.3, 10.8) and median duration of disease was 7.2 years (3.1, 12.4). The median average HbA1c in the preceding 12 months was 8.1% (4.6, 11.3) or 65 mmol/mol (27, 100); glycemic control was good in seven, moderate in 19, and poor in six. Of the 32 children, three were prepubertal, 17 in early puberty (Tanner Stages 2 and 3), and 12 in late puberty (Tanner Stages 4 and 5). Of the 32, 10 presented with diabetic ketoacidosis (DKA) at the time of diagnosis. The median insulin dose was 1.0 U/kg/day (0.6, 1.8), with 10 out of 32 on continuous subcutaneous insulin infusion (CSII) via pump. Of the 24 children with T1D, aged over 12 years old who were eligible for screening of complications, 16 had undergone retinopathy screening, and 19 had assessment of microalbuminuria. Mild background retinopathy was present in 3 out of 16 children (19%) who had retinopathy screening (in the 24 children with T1D aged over 12 years old), and microalbuminuria was absent in all.
Clinical Characteristics of the Whole Cohort, With Subcategories of Children With T1D Based on Their Glycemic Control as per HbA1c
| Whole Cohort | T1D Cases Based on Glycemic Control (HbA1c) | ||||||
|---|---|---|---|---|---|---|---|
| T1D (n = 32) | Control (n = 26) | P | Good (n = 5) | Moderate (n = 20) | Poor (n = 6) | P | |
| Age, y | 13.7 (10.4, 16.7) | 13.8 (10.2, 17.8) | 0.994 | 12.3 (11.5, 16.4) | 13.8 (10.7, 16.7) | 13.1 (10.4, 16.4) | 0.633 |
| Sex, male/female | 16/16 | 13/13 | 0.999 | 2/3 | 8/12 | 6/0 | 0.031 |
| Height SDS | 0.3 (−1.5, 2.5) | −0.1 (−1.6, 2.7) | 0.173 | 0.3 (−0.8, 1.3) | 0.7 (−1.5, 2.5) | 0.2 (−1.4, 1.2) | 0.479 |
| Weight SDS | 0.8 (−1.3, 3.2) | 0.6 (−1.2, 3.1) | 0.569 | 0.2 (−0.4, 0.5) | 1.0 (−0.4, 3.2) | 0.5 (−1.3, 2.4) | 0.119 |
| BMI SDS | 0.5 (−0.6, 2.9) | 1.0 (−1.6, 2.7) | 0.798 | −0.1 (−0.2, 0.0) | 1.0 (−0.6, 2.4) | 0.5(−0.6, 2.9) | 0.084 |
| Tanner stage, Pre/Early/Late, n | 3/17/12 | 4/13/9 | 0.831 | 1/3/1 | 2/11/7 | 0/3/3 | 0.758 |
| Age at diagnosis, y | 5.9 (1.3, 10.8) | 6.3 (4.2, 10.3) | 5.5 (1.3, 10.8) | 6.2 (3.7, 10.8) | 0.810 | ||
| Disease duration, y | 7.2 (3.1, 12.4) | 7.3 (3.1, 10.1) | 7.3 (3.1, 12.3) | 6.7 (3.1, 9.6) | 0.639 | ||
| HbA1c average in last 12 mo | 8.1 (4.6, 11.3) | 7.0 (6.6, 7.3) | 8.1 (7.5, 8.9) | 10.0 (9.2, 11.3) | <0.001 | ||
| HbA1c average in last 12 mo, mmol/mol | 65 (27, 100) | 53 (49, 56) | 65 (58, 74) | 86 (77, 100) | <0.001 | ||
| HbA1c at diagnosis, % | 10.7 (7.3, 17.2) | 9.5 (7.3, 9.9) | 11.1 (7.9, 17.2) | 9.6 (8.8, 12.1) | 0.069 | ||
| HbA1c at diagnosis, mmol/mol | 93 (56, 164)a | 80 (56, 85) | 98 (63, 164) | 81 (73, 109) | 0.069 | ||
| DKA at initial presentation, yes/no (n = 31) | 21/10 | 0/5 | 7/12b | 3/3 | 0.187 | ||
| Insulin dose, U/kg/d | 1.0 (0.6, 1.8)c | 0.89 (0.60, 1.03) | 1.03 (0.73, 1.50) | 1.6 (1.24, 1.81) | <0.001 | ||
| Insulin pump/injections | 10/22 | 5/0 | 5/15 | 0/6 | 0.001 | ||
| 25-OH Vitamin D, nM | 48 (18, 75) | 53 (48, 60) | 47 (18, 70) | 51 (39, 75) | 0.283 | ||
| Physical activity score | 2.4 (1.3, 4.1) | 2.5 (1.6, 4.1)d | 0.425 | 2.0 (1.4, 3.7) | 2.4 (1.6, 3.5) | 3.0 (1.3, 4.1) | 0.361 |
| Previous fracture(s), yes/no | 10/22 | 5/21 | <0.001 | 1/4 | 5/15 | 4/2 | 0.130 |
Values are presented as median (range). Boldface indicates statistical significance with P < 0.05.
Abbreviation: BMI, body mass index.
n = 25.
n = 19.
n = 27.
n = 24.
Bone metabolism and GH/IGF-1 axis
Children with T1D had reduced BAP SDS −0.57 (−2.50, 2.10), with median absolute value 59.2 μg/L (14.4, 118.5). Those with poor control had a lower BAP SDS of −0.79 (−2.5, −0.54) compared with 0.50 (−0.64, 2.10) for children with good glycemic control (P = 0.009; Fig. 1A). Children with T1D, who were in DKA at initial presentation, had significantly lower BAP SDS than those who were not acidotic (P = 0.017; Fig. 1B). Further hospital admissions with DKA, subsequent to the initial presentation, however, did not appear to have an effect on BAP (P = 0.734; Fig. 1C). A higher BAP SDS was noted in T1D children on CSII compared with those on multiple daily injections (MDI) of insulin (Fig. 1D). The children on pump therapy had a lower HbA1c [58 mmol/mol (49, 71) vs 68 mmol/mol (58, 100) in controls; P = 0.005] and lower daily insulin requirement for weight [0.93 U/kg/day (0.60, 1.16) vs 1.2 U/kg/day (0.73, 1.81) in controls; P = 0.04]. The median serum OC and sclerostin in cases were 56.5 ng/mL (13.9, 262.8) and 0.22 ng/mL (0.01, 0.7), respectively. Serum OC did not show an association to glycemic control, age, or duration of diagnosis. Although median CTX SDS was also lower compared with controls (P < 0.001; Table 2), it did not show a significant association with glycemic control. However, median CTX SDS (r −0.44; P = 0.012) and sclerostin (r −0.38; P = 0.038) were inversely associated with age at diagnosis (Figs 1E and 1F). Although serum IGF-1 was not significantly lower in those with T1D [−0.24 (−3.64, 1.48); P = 0.364], the children had lower ALS SDS [−0.70 (−1.67, 0.76); P < 0.001] and higher IGF-I and its binding protein-3 SDS [1.66 (0.13, 3.81); P < 0.001]. The median 25-OH vitamin D level was 48 nM (18, 75) and PTH 3.6 mM (1.5, 6.6) in the children with T1D. There were no intergroup differences in 25-OH vitamin D levels in the children with [47 nM (25, 70)] and without [49 nM (18, 75)] DKA at initial presentation (P = 0.555) or the children on CSII [pump therapy; 49 nM (37, 60)] compared with those on MDI [47 nM (18, 75)] of insulin (P = 0.602).
![The relationship between T1D disease characteristics and markers of bone turnover (as assessed by bone formation marker BAP, bone resorption marker CTX, and sclerostin). (A) BAP in children with good, moderate, and poor glycemic control. [HbA1c categorized as good (HbA1c < 7.5% or < 58 mmol/mol), moderate (HbA1c 7.5% to 9.0% or 58 to 75 mmol/mol), or poor (HbA1c > 9.0% or > 75 mmol/mol).] Children with poor glycemic control had significantly lower bone formation marker. (B) Children who presented in DKA at the time of T1D diagnosis also had reduced bone formation marker, although (C) a subsequent number of DKAs did not affect BAP SDS. (D) T1D children on CSII (insulin via pump) had higher BAP SDS than those on multiple daily injections (MDI; insulin via injection). The relationships between (E) CTX and (F) sclerostin with age at diagnosis of T1D. Children diagnosed younger with T1D had higher bone resorption and sclerostin levels. ‡P not significant postmultiple testing.](https://oup.silverchair-cdn.com/oup/backfile/Content_public/Journal/jcem/104/8/10.1210_jc.2019-00084/1/m_jc.2019-00084f1.jpeg?Expires=1750357738&Signature=uDr1ZmIAUuF3ie4NtvzHiUTfatLRJGfjSCj9zOvS~2Ro7FPVsSSzP9fopfnlyK6822jPrC4NcwqIHEeApqyWbvp34m1KxGw8hd-m58VyGKyIwbnrGwIZv6-3wlHyX100Q9J1PWXLDUmzIm0sOAtJ1CWhZ6BKCDm0oC2MSZz06NAKcaWhy01ouN0VpeE3noHIN9M5~6kOj2b9XL6ckHx-uSGXR3w55l2FhE5iZFPEO9a8YTjxDO9kfSvHXcdv85JNG0n1EQBEQqo5mgBkis9RdRUDY3oBuLKqba~b9jC2dGLPdhzeVkwup~c2L4tacIi4ji~mVA53gwKg65ukxc7uug__&Key-Pair-Id=APKAIE5G5CRDK6RD3PGA)
The relationship between T1D disease characteristics and markers of bone turnover (as assessed by bone formation marker BAP, bone resorption marker CTX, and sclerostin). (A) BAP in children with good, moderate, and poor glycemic control. [HbA1c categorized as good (HbA1c < 7.5% or < 58 mmol/mol), moderate (HbA1c 7.5% to 9.0% or 58 to 75 mmol/mol), or poor (HbA1c > 9.0% or > 75 mmol/mol).] Children with poor glycemic control had significantly lower bone formation marker. (B) Children who presented in DKA at the time of T1D diagnosis also had reduced bone formation marker, although (C) a subsequent number of DKAs did not affect BAP SDS. (D) T1D children on CSII (insulin via pump) had higher BAP SDS than those on multiple daily injections (MDI; insulin via injection). The relationships between (E) CTX and (F) sclerostin with age at diagnosis of T1D. Children diagnosed younger with T1D had higher bone resorption and sclerostin levels. ‡P not significant postmultiple testing.
MRI-Based Measures of Bone Microarchitecture and Vertebral Bone Marrow Adiposity in the Whole Cohort and Subgroup Analysis of These Parameters in Children With T1D With and Without Fractures Post-T1D Diagnosis
| Whole cohort | T1D Children | |||||
|---|---|---|---|---|---|---|
| Parameters | T1D (n = 32) | Controls (n = 26) | P | Fracture (n = 10) | No Fracture (n = 22) | P |
| appBV/TV | 0.55 (0.47, 0.63)a | 0.59 (0.47, 0.63) | 0.024 | 0.54 (0.50, 0.61)b | 0.55 (0.47, 0.63)c | 0.571 |
| appTbN (mm−1) | 1.67 (1.56, 1.93)a | 1.82 (1.56, 1.99) | 0.004 | 1.64 (1.57, 1.84)b | 1.71 (1.56, 1.93)c | 0.512 |
| appTbSp (mm) | 0.27 (0.21, 0.32)a | 0.24 (0.20, 0.33) | 0.001 | 0.27 (0.23, 0.32)b | 0.26 (0.21, 0.32)c | 0.389 |
| appTbTh (mm) | 0.32 (0.27, 0.39)a | 0.32 (0.25, 0.38) | 0.954 | 0.32 (0.27, 0.37)b | 0.32 (0.27, 0.39)c | 0.587 |
| Marrow %FF | 23.1 (11.0, 66.0)d | 20.0 (8.0, 61.1) | 0.250 | 20.0 (11.0, 45.7)b | 26.4 (13.5, 66)e | 0.451 |
Values are presented as median (range). Boldface indicates statistical significance with P < 0.05.
n = 30.
n = 9.
n = 21.
n = 29.
n = 20.
Bone densitometry by DXA
Median BMC SDS for TB and LS was marginally but significantly lower in the cases than zero at −0.1 (−1.1, 0.9) and −0.3 (−1.0, 1.8), respectively. TB and LS BMC SDS did not show any correlation to glycemic control, age at diagnosis, disease duration, and acidosis at presentation (all P > 0.05). TB BMC SDS, however, was inversely associated with CTX SDS (r −0.5; P = 0.003).
Bone microarchitecture by MRI
Comparison of bone microarchitecture variables revealed that appBV/TV and appTbN were significantly lower, and appTbSp was higher in cases compared with controls (Table 2). The appBV/TV difference between cases and controls was evident across all ages. In the cases, serum ALS showed an inverse association to appBV/TV (r −0.54; P = 0.002), appTbTh (r −0.42; P = 0.02), and appTbSp (r 0.46; P = 0.01); however, removal of two cases with high values of ALS SDS resulted in an absence of this association, except for appBV/TV, where an inverse association was still present at r −0.44 (P = 0.02). In the children with T1D, there was no association of bone microarchitecture parameters with HbA1c, age at diagnosis, disease duration, acidosis at presentation, or presence of retinopathy. However, daily insulin dose for weight was positively associated with appTbN (r 0.41; P = 0.036). There was no evidence of an association between any of the bone microarchitecture variables and BMC SDS for TB and LS.
Bone marrow adiposity by MRI
Median vertebral bone marrow adiposity, expressed as %FF, was higher in cases than controls, but this did not reach statistical significance (Table 2). In the cases, there was no association among %FF and markers of the growth hormone (GH)/IGF-1 axis, markers of bone turnover, or BMC SDS for TB and LS. Combined analysis of the cases and controls showed an inverse association between %FF and appTbN (r −0.40; P = 0.004) and a positive association with appTbSp (r 0.33; P = 0.021; Fig. 2A and 2B).
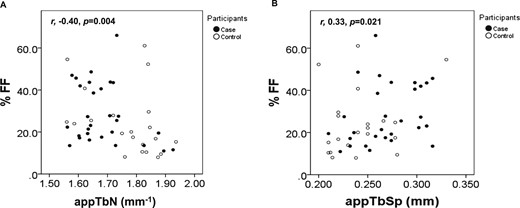
Relationship between bone marrow adiposity and bone microarchitecture in the whole cohort. Marrow %FF was inversely associated with (A) appTbN and positively associated with (B) appTbSp.
Fractures
Children with T1D were more likely to fracture compared with healthy controls (P < 0.001) (Table 1). Of the 32 children with T1D, 10 (31%) had a fracture following the diagnosis of T1D (Table 3). None of the children had any abnormalities identified on vertebral fracture assessment by DXA. The clinical characteristics of the fracture and nonfracture group were comparable for age, age at diagnosis, sex, puberty, anthropometric measurements, insulin doses, and delivery systems (all P > 0.05). The median age of diagnosis was 4.4 years (1.3, 10.8) in the fracture group and 6.5 years (3.8, 10.8) in the nonfracture group (P = 0.077; Fig. 3A). The median disease duration was 8.6 years (3.1, 12.4) in the fracture group and 7.0 years (3.1, 10.9) in the nonfracture group (P = 0.204). The median HbA1c was higher in the fracture group at 8.7% (6.6, 11.3) or 72 mmol/mol (49, 100) compared with the nonfracture group of 7.8% (4.6, 10.1) or 62 mmol/mol (27, 87) (P = 0.005 and P = 0.007, respectively; Fig. 3B). The children with a history of fracture had a median TB BMC SDS of −0.5 (−1.1, 0.0) and significantly lower than the nonfracture group (P < 0.001; Fig. 3C). Both groups had similar BAP SDS, IGF-1 SDS, and CTX SDS. The median physical activity score (1 = least; 5 = most active) for the fracture and nonfracture groups was not significantly different, with 2.8 (1.7, 4.1) and 2.2 (1.3, 3.7), respectively, after correction for multiple testing (Fig. 3D). There was no significant difference in bone microarchitecture or bone marrow adiposity between these fracture groups. Children with fractures had lower TB BMC SDS (adjusted OR 0.002; 95% CI 0.0 to 0.769; P = 0.041) after adjusting for HbA1c and physical activity score in multiple logistic regression.
Age, Distribution, Sites of Fracture, and the Events Preceding Fracture Cohort
| Age at Diagnosis, y | Sex | Age at Fracture, y | Duration of Disease to Fracture Time, y | Fracture Distribution (UL/LL/Other) | Site of Fracture | Event Preceding Fracture |
|---|---|---|---|---|---|---|
| 1.3 | M | 12.3 | 11.0 | LL | Left tibia + metatarsals | Hyperextension injury during football |
| 13.1 | 11.8 | LL | Left calcaneum | Fell off skateboard at low speed | ||
| 13.2 | 11.9 | UL | Left fifth proximal phalange | Hyperextension injury during football | ||
| 2.2 | F | 4.9 | 2.7 | LL | Right fibula | Fell in park from standing height |
| 6.1 | 4.5 | UL | Left supracondyle | Fell off motorcycle with protective gear | ||
| 2.8 | M | 5.9 | 3.1 | Other | Right clavicle | Fell in park from standing height |
| 3.7 | M | 6.4 | 2.7 | UL | Left radius and ulnar | Fell on outstretched hand |
| 4.3 | M | 10.9 | 6.6 | UL | Right radius and ulnar | Fell in school from standing height |
| 4.5 | F | 7.4 | 2.9 | UL | Right radius | Tripped over schoolbag |
| 5.0 | M | 8.1 | 3.1 | UL | Left supracondyle | Fell onto left side from standing height |
| 7.3 | M | 10.4 | 3.1 | UL | Left radius | Slipped and fell during football |
| 12.0 | 4.7 | UL | Left radius | Hyperextension injury during football | ||
| 10.3 | F | 11.5 | 1.2 | UL | Left radius | Fell on outstretched hand |
| 10.8 | M | 11.2 | 0.4 | UL | Left scaphoid | Fell on outstretched hand |
| 11.8 | 1.0 | UL | Left humeral supracondyle | Fell off bicycle |
Abbreviations: F, female; LL, lower limb; M, male; UL, upper limb.
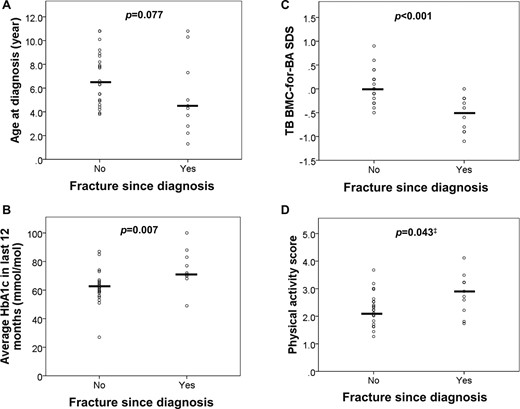
Subanalysis of children with T1D depending on fracture status. T1D children with fracture had a (A) lower age at diagnosis, (B) worse glycemic control (as assessed by HbA1c), and (C) lower TB BMC-for-BA SDS (as assessed by DXA) and tended to have a (D) higher physical activity score (‡P not significant postmultiple testing).
Discussion
This study examined in detail and specifically the association among T1D disease characteristics, bone microarchitecture, and marrow adiposity by MRI and fracture incidence in children. The group of children studied had an overall diabetes control, which was better than expected for adolescents (28) but similar to that described recently in a population-based study of skeletal morbidity in young people with T1D (6). In addition, contrary to other studies of bone health in children and adolescents with T1D (29), the current cohort was well nourished and also vitamin D sufficient.
Previous studies on bone-turnover status of children and adolescents with T1D have produced variable results (30–32). Given that these markers vary markedly in growing children, the values for the two commonly studied markers of bone formation and bone resorption, BAP and CTX, were adjusted for age and sex in the current study. The existence of a low bone-turnover state, characterized by low circulating levels of both BAP and CTX, is important to highlight in a group of well-controlled children with T1D. This biochemical picture has also been described in young adults with T1D (14, 33). Whereas it is possible that this low bone-turnover state may also be a reflection of functional GH resistance, which may exist in people with diabetes (34), circulating IGF-1 was not particularly low in the current cohort. Given that there was a clear inverse association between bone formation and glycemia and between bone resorption and the age at diagnosis of diabetes, it is possible that the mechanisms that influence bone turnover in T1D are mediated through several pathways including those that may be dependent on chronic hyperglycemia or insulinopenia (35). For instance, the inverse association between circulating sclerostin and age at diagnosis further supports the notion of a sclerostin-mediated signaling-pathway inhibition of bone turnover (36).
Marked reduction in diabetes complications has been reported in T1D adolescents with a shift toward a more physiologic insulin replacement using CSII via pump (37). The higher levels of BAP in T1D children on CSII compared with those on MDI suggest that this form of replacement may indeed be advantageous for bone health preservation. However, given that this group also had a lower HbA1c could suggest a degree of selection bias. The lower levels of BAP in children who presented in DKA at initial diagnosis are very interesting and suggest the possibility of an additional programming effect of acidosis or sustained hyperglycemia before initial presentation on skeletal development. Given that the effects of acidosis on bone homeostasis may be independent of calciotropic hormones (38), and it is possible that acidosis may have an effect on mesenchymal stem cell differentiation (39), a long-lasting effect on bone health that may result from the initial acidotic insult deserves further exploration.
In the current study, children with T1D had marginally lower BMD when corrected for size, and this is consistent with previous studies demonstrating that children and adolescents with T1D have lower BMD status (40–42). Although bone microarchitecture studies have been performed in T1D, and some have reported deficits (43, 44), the current study confirmed a deficit in MRI-based assessment of trabecular bone microarchitecture in children with T1D, a similar finding to that previously described in young women with T1D (14). It is interesting to note that the two studies (43, 44) that have shown a deficit and the one (45) that did not show a deficit examined the tibia and radius, respectively; thus, the possibility of a selective effect on a weight-bearing site needs further exploration in adequately powered studies.
The inverse association of bone microarchitecture parameters with bone marrow adiposity in children confirms our previous reports of this finding in young women (46), and not only does this further reinforce the hypothesis that the observed skeletal deficit in T1D may have its origins in a shift of mesenchymal stem cell differentiation toward adipogenesis rather than osteogenesis, but it also highlights the unique benefit of MRI-based assessment for providing mechanistic insight when studying bone health. Furthermore, the positive association between insulin dose and trabecular number substantiates the anabolic effect of insulin on bone (47, 48). The lack of an association between bone microarchitecture parameters and DXA-based measures of bone density has also been previously noted in young women with T1D (46) and highlights the point that bone microarchitecture assessment provides additional information on bone health that cannot be obtained from bone densitometry. Recent histomorphometric and microCT-based studies of trabecular bone microarchitecture have shown an inverse association with HbA1c (49, 50), but this was not observed in the current study or our previous study in young women (9), and perhaps these studies were not sufficiently powered to investigate this association. An association between the deficits in trabecular features and fractures was also not observed, and this may also require a larger cohort, as well as a study of cortical parameters, as described recently in adults (44). In the previous study performed in young women with T1D, we had reported that bone microarchitectural deficits were more likely in those who had retinopathy (14). However, given the low prevalence of microvascular complications in children (51), the current study was not sufficiently powered to investigate this finding in this age group.
Approximately one-third of the current cohort of children with T1D had suffered a radiologically confirmed fracture before the median age of 13.8 years. Fracture rates in children with T1D have rarely been reported, but the current rate of fractures was higher than previously reported in children and young people with T1D (28, 29, 51) and the control group. In the United Kingdom, approximately one-third of children is reported to suffer a fracture before the age of 17 years, with a fracture incidence of 3% in boys and 1.5% in girls at their peak (52). Therefore, it is possible that the control group had a relatively lower incidence of fractures. However, there were some notable differences between the groups of children with T1D who suffered a fracture compared with those who had not suffered a fracture. Children who fractured had lower TB BMD and poorer glycemic control compared with the nonfracture group. Abnormalities in cortical BMD with reduced muscle cross-sectional area have been previously reported in T1D and are consistent with an anabolic bone deficit (53). This is further supported by our finding of significantly lower TB, but not lumbar, BMD in T1D children with fracture. Given that bone microarchitecture at the proximal tibia was not significantly different between the fracture and the nonfracture group, this reinforces the need to study cortical bone architecture in more detail in this condition. Although the combination of lower BMD, poorer glycemic control, and an increased risk of fractures could have been explained by reduced physical activity (54), this confounder was discarded, as both groups had comparable levels of physical activity.
In summary, children and adolescents with relatively well-controlled T1D are more likely to have a history of fractures and show deficits in trabecular bone microarchitecture, BMD, and bone formation. Although the association of these markers of bone health to clinical markers of T1D and its management requires further exploration through prospective clinical trials, we would recommend that assessment of bone health should become routine in all therapeutic trials in the field of diabetes.
Acknowledgments
We thank all of the members of the NHS Greater Glasgow and Clyde Paediatric Diabetes Service for their support, as well as the patients who contributed their time and data. We also thank Christie McComb, Tracey Steedman, Rosemary Woodward, Caroline Crosbie, and Evonne McLennan for their assistance with image acquisition.
Financial Support: Support for S.C.C. was provided by the Glasgow Children’s Hospital Charity.
Author Contributions: S.C.C. recruited the cases, performed the study, analyzed the data, and wrote the initial manuscript and subsequent revisions. S.S. performed the DXA scans and revised the manuscript. M.M. and J.M. performed the assays and revised the manuscript. J.F. designed the MRI acquisition parameters and revised the manuscript. S.C.W. assisted with analysis and revised the manuscript. K.J.R. assisted with recruitment and revised the manuscript. S.F.A. conceived of and designed the study, revised the manuscript, and acts as the guarantor.
Disclosure Summary: The authors have nothing to disclose.
Abbreviations:
- %FF
percentage fat fraction
- 25-OH vitamin D
25-hydroxyvitamin D
- ALS
acid labile subunit
- appBV/TV
apparent bone volume-to-total volume ratio
- appTbN
apparent trabecular number
- appTbSp
apparent trabecular separation
- appTbTh
apparent trabecular thickness
- BA
bone area
- BAP
bone-specific alkaline phosphatase
- BMC
bone mineral content
- BMD
bone mineral density
- CSII
continuous subcutaneous insulin infusion
- CTX
C-terminal telopeptide of type I collagen
- DXA
dual-energy X-ray absorptiometry
- GH
growth hormone
- LS
lumbar spine
- MDI
multiple daily injections
- MRS
magnetic resonance spectroscopy
- OC
osteocalcin
- SDS
SD score
- T1D
type 1 diabetes
- TB
total body
