


Abstract
The understanding of the mechanisms underlying thyroid cancer immune escape can lead to the identification of new molecular targets and/or efficacy biomarkers. For this purpose, we performed immune expression profiling in thyroid cancers to obtain a comprehensive view on immune mechanisms activated during cancer progression.
The study was conducted retrospectively in 25 papillary thyroid carcinomas (PTCs), 14 poorly differentiated thyroid carcinomas (PDTC), 13 anaplastic thyroid carcinomas (ATCs), and 7 normal thyroid (NT) tissue samples. Gene expression profiling was obtained on RNA samples using the Nanostring platform and its nCounter PanCancer Immune Profiling Panel.
Gene expression comparison of ATC, PTC, and PDTC vs NT showed high number of regulated genes in cancer samples. In detail, immune-related gene sets were significantly upregulated (ATC > PTC > > PDTC). Most ATC and approximately half of PTC showed a microenvironment infiltrated by macrophages and T-cells with CD8+ effector phenotype, part of which appeared to be functionally exhausted. Conversely, most PDTC, as NT samples, as the remaining part of PTC, displayed a poor or absent infiltration by immune cells. Interestingly, an upregulation of inhibitory immune checkpoint mediators, including PDL1, PDL2, PD1, LAG-3, TIM-3, PVR, and TIGIT, could be detected in ATC and PTC.
These data indicated the existence of two major immune phenotypes in thyroid carcinoma: an ATC-like one, including hot and altered–immunosuppressed tumors and a PDTC-like one, including altered–excluded and cold tumors. Confirmation of the findings in locally advanced or metastatic cancer tissues is expected to have important immunotherapeutic implications.
There is clear evidence that solid tumors are composed by a complex aggregation of different cell lineages. Next to the cancer cells and cancer stem cells, the stroma of the tumor is composed by endothelial cells, pericytes, tumor-associated fibroblasts, myeloid progenitors, and cells of the innate and adaptive immune system (1). In general, these cells appear to promote tumor growth and progression. More in detail, gene expression profiling of melanoma metastases allowed to detect two major phenotypes of tumor microenvironment: a T-cell inflamed (hot) phenotype, characterized by the expression of T lymphocyte markers and chemokines correlated with the recruitment of T lymphocytes; a T-cell noninflamed (cold) phenotype missing the expression of immune-related genes (2). Typically, the T-cell inflamed phenotype is also characterized by high representation of immune-inhibitory factors, including expression of the membrane protein programmed death ligand 1 (PDL1), expression of the tryptophan-catabolizing enzyme indoleamine 2,3-dioxygenase 1 (IDO1) and infiltration of FOXP3+ T-regulatory (Treg) lymphocytes, which indicate the occurrence of immune-escape in the contest of an antitumor immune response (3–5). Clinical data have shown that patients presenting with T-cell inflamed tumors are those who respond best to different immunotherapeutic approaches such as anticancer vaccines, high-dose IL-2, and inhibitory antibodies directed against cytotoxic T-lymphocyte associated-4 (CTLA-4), programmed death 1 (PD1), and PDL1 (6). Preclinical studies and in vivo analysis of specific biomarkers have suggested that the therapeutic activity of these immunotherapies is associated with the reactivation in the tumor microenvironment of T lymphocytes capable of recognizing tumor antigens (7). Interestingly, the presence in solid tumors of CD8+ activated T lymphocytes correlates positively with a better outcome of the patients (8, 9).
An important immune-regulatory function is delivered by additional cellular components of the stroma such as fibroblasts, cells of the myeloid lineage [myeloid-derived suppressor cells (MDSC), neutrophils, mast cells], macrophages, and vascular endothelial cells (10). In particular, the tumors characterized by a poor infiltration of T-lymphocytes (T-cell noninflamed phenotype) have a denser stroma (10).
In recent time, a more complex classification of the cancer immune contexture was proposed, including four major immune coordination profiles: hot, altered–immunosuppressed, altered–excluded, and cold. Altered phenotypes represent intermediate states between hot and cold. In detail, altered–immunosuppressed tumors are characterized by a low degree of T-cell infiltration, presence of soluble inhibitory mediators (i.e., TGF-β, IL-10, vascular endothelial growth factor also known as VEGF), presence of immune suppressive cells (i.e., MDSC, Treg), and presence of T-cell checkpoints. Conversely, altered–excluded tumors are characterized by T cell at the edge/invasive margins of the lesion, with no intratumoral (IT) infiltration, activation of oncogenic pathways, epigenetic regulation and reprogramming of the tumor microenvironment, aberrant tumor vasculature and stroma, hypoxia (11).
Moreover, very recently, an extensive immunogenomic analysis of more than 10,000 tumors comprising 33 diverse cancer types was performed by utilizing data compiled by The Cancer Genome Atlas (TCGA). Across cancer types, six immune subtypes—wound healing, interferon (IFN)-γ dominant, inflammatory, lymphocyte depleted, immunologically quiet, and TGF-β dominant— could be detected. They were characterized by differences in macrophage or lymphocyte signatures, T helper (Th)1-to-Th2 cell ratio, extent of IT heterogeneity, aneuploidy, extent of neoantigen load, overall cell proliferation, expression of immunomodulatory genes, and prognosis (12).
In the last 30 years, thyroid carcinoma has shown a very relevant increase of incidence. In detail, the number of new cases of thyroid cancer rose in western countries to 13.9 per 100,000 men and women per year. At variance, mortality is low with 98.1% of patients surviving 5 years (13). Indeed, life-threatening traditional therapy-resistant aggressive thyroid carcinomas are a minority with an incidence estimated to be 4 to 5 per 1,000,000 men and women per year (14). Novel molecular targeted therapies, such as sorafenib and lenvatinib for differentiated thyroid carcinoma or vandetanib and cabozantinib for medullary thyroid carcinoma, have been registered. However, lack of strong cytotoxic action, fast development of resistance, and occurrence of side effects limit their efficacy (15). Thus, novel therapeutic approaches are needed for these aggressive thyroid cancers, including immunotherapy.
Several evidences have supported the importance of immune-escape in thyroid carcinoma development. Tumor-associated lymphocytes and increased FoxP3+ Treg cell densities were correlated with more aggressive papillary thyroid cancers and were shown to be enriched in tumor-involved lymph-nodes (16–18). Moreover, PD1+Tim-3+ CD8+ T lymphocytes were shown to display varied degrees of functional exhaustion in patients with regionally metastatic differentiated thyroid cancer (19). Finally, density of tumor infiltrating lymphocytes and expression of PD1 and PDL1 appeared to be higher in advanced differentiated thyroid carcinoma and in anaplastic thyroid carcinoma (ATC) (20).
Increased density of tumor-associated macrophages was shown to be associated with lymph node metastasis in papillary thyroid carcinoma (PTC) (21) and with decreased survival in advanced thyroid cancer (22, 23). Moreover, tumor-associated macrophages (TAMs) were shown to form an interconnected cellular supportive network in ATC (24).
PDL1 expression was evaluated by immunohistochemistry (IHC) in various thyroid cancers and recently also on a large scale. Tumoral PDL1 was expressed in 6.1% of PTCs, 7.6% of follicular thyroid carcinomas, and 22.2% of ATCs. All PDL1-positive cases of follicular thyroid carcinoma and ATC showed strong intensity, and the proportions of positivity in PDL1-positive ATCs were more than 80%. Thus, PDL1 was highly expressed in a subset of patients with advanced thyroid cancer, and its identification may have direct therapeutic relevance (25).
The precise definition of the mechanisms that rule the effects of inflammation and immunity on tumor development is a very important achievement in cancer research. The experience we have gained to date with the immune checkpoint inhibitors (anti-CTLA-4, anti-PD1, anti-PDL1 antibodies) represents the “proof-of-concept” that interference on the immune evasion mechanisms activated by cancer cells can be used to reactivate the immune system against cancer and to cure the disease. Unfortunately, among patients treated with a single agent regimen, in average only 15% to 20% have shown objective and durable responses (26). In differentiated thyroid carcinoma, the preliminary data show a picture that is even worse: two objective responses among 22 patients with advanced DTC (9.1%) treated with the anti-PD1 antibody pembrolizumab as single therapy (27). The response of ATCs to monotherapy with the anti-PD1 antibody spartalizumab is a little better: overall response rate of 17% evaluated by RECIST 1.1 and overall disease control rate of 33% evaluated by irRECIST (28). This low response rate may depend on the potential of tumors to co-opt a myriad of immunosuppressive mechanisms or on the lack of a sufficient number of functioning antitumor T lymphocytes in the tumor microenvironment (26). Therefore, a broader understanding of the mechanisms of tumor immunosuppression, the identification of new strategies to target these mechanisms, and the development of new ways to force the entry of more antitumor T lymphocytes in tumors represent the new challenges of immunotherapy in oncology (26).
In this paper, we report the results of an immunoprofiling experiment using the NanoString technology (NanoString Technologies, Seattle, WA) in a collection of thyroid carcinomas. Interestingly, ATC, PTC, and poorly differentiated thyroid carcinomas (PDTCs) showed each a peculiar and specific pattern of interaction with the immune system compared with normal tissue. Analysis of the data allowed defining immune signaling pathways and immune cell infiltration patterns involved in thyroid cancer development and progression. This approach yielded a more comprehensive view of the immune oncology strategies necessary to treat the different histotypes of advanced thyroid carcinoma.
Materials and Methods
Tissue selection and histological revision
Retrospective samples [formalin-fixed/paraffin-embedded (FFPE)] of 7 normal thyroids (NTs), 25 PTCs, 14 PDTCs, and 13 ATCs from patients diagnosed and operated on between 2012 and 2018 were collected from the archives of Pathology of the Universities of Pisa and Perugia. Clinical data (gender, age, tumor size, tumor capsule infiltration, lymph node metastasis, and extrathyroidal infiltration) were collected analyzing patients’ charts and pathology reports. Aggressiveness was estimated taking into account known negative clinical prognostic features of thyroid cancer such as age ≥ 45 years, bigger tumor size, male gender, tumor capsule infiltration, lymph node metastasis, and extrathyroidal infiltration (29). Inclusion criteria comprised the absence of thyroiditis in the NT control tissues and in the tissue surrounding the cancers, evaluated either histologically or serologically. The diagnoses of all of the thyroid lesions were reviewed and re-evaluated independently by two pathologists (C.U. and F.B.) according to the World Health Organization’s criteria (30). In detail, Turin criteria were adopted for the definition of PDTC (31). The most representative paraffin block of each sample was selected for analysis. Tumor tissue was manually macro-dissected to maximize the amount of tumor cells, putting peculiar attention to exclude surrounding normal tissues, necrosis areas, or regression zones. The density of tumor infiltrating leukocytes (TILs) was not considered in this phase and did not bias the selection of the samples. The study was conducted anonymously and in compliance with the principles of the Helsinki Declaration of 1975.
Nucleic acids extraction and purification
For each sample, four unstained 10-μm sections and four unstained 5-μm sections were used for DNA and RNA extraction, respectively. Unstained sections were deparaffinized with xylene and rehydrated in decreasing-grade ethanol solution. DNA was extracted and purified by using the QIAamp DNA Mini Kit (Qiagen, Hilden, Germany), according to the manufacturer’s protocol. DNA was eluted in 50-μL of elution buffer. RNA was isolated using the RNeasy FFPE Kit (Qiagen) in conformance to the manufacturer’s instructions. RNA was eluted in 20-μL of RNase-free water. RNA and DNA quantification and quality were assessed by means of a spectrophotometer (Xpose Trinean, Gentbrugge, Belgium).
Genotyping of the samples
Mutational status of BRAF (exon 15), NRAS (exon 3), HRAS (exon 3), and TERT gene promoter was evaluated by PCR followed by direct sequencing (3130 Genetic Analyzer, Thermo Fisher Scientific, Waltham, MA), as described previously (32, 33).
Tumor mutational burden analysis
Twenty-seven DNA samples (14 PDTC and 13 ATC used in gene expression profiling) were analyzed using NEOplus v2 RUO (NEO New Oncology GmbH, Cologne, Germany), a hybrid-capture based next-generation sequencing assay, covering 340 genes to analyze tumor mutational burden (TMB). DNA samples were subjected to an initial QC check. Good quality DNA was sheared (Covaris, Woburn, MA) and subjected to NEO plusv2 analysis (NEO New Oncology GmbH In brief, after DNA shearing, adapters were ligated and individual genomic regions of interest were enriched using complementary bait sequences (hybrid-capture procedure). The selected baits ensure optimal coverage of all relevant genomic regions. After enrichment, all targeted fragments were amplified (clonal amplification) and sequenced in parallel at high sequencing depth. Computational analysis was performed using NEO New Oncology’s proprietary computational biology analysis pipeline to detect relevant genomic alterations in a quantitative manner and calculate TMB.
Immune-related gene expression analysis
Analysis of the expression profiles of more than 700 immune-related genes was performed using the NanoString nCounter® PanCancer Immune Profiling Panel (NanoString Technologies). Detailed information about the panel, together with the gene list, is available at https://www.nanostring.com/products/gene-expression-panels/hallmarks-cancer-gene-expression-panel-collection/pancancer-immune-profiling-panel.
In detail, 150 ng of RNA from each sample was hybridized with the nCounter® PanCancer Immune Profiling Panel (GX Assay) CodeSet. All procedures related to mRNA quantification, including sample preparation, hybridization, detection, and scanning, were performed following the manufacturer’s instructions. The counts were normalized according to the standard protocol. Raw NanoString counts for each mRNA within each experiment was subjected to technical normalization using the counts obtained for positive-control probe sets prior to biological normalization referring to the 40 reference genes included in the CodeSet. Normalized data were log2-transformed and then used as input for differential expression analysis. Data were filtered to exclude relatively invariant features and features below the detection threshold (defined for each sample by a cutoff corresponding to twice the standard deviation of the negative control probes plus the means).
Gene expression data analysis
The PanCancer Immune Profiling Advanced Analysis Module (NanoString Technologies) was used to perform the statistical analyses of data obtained by the nCounter panel analysis. This module includes unique analytical methods for expression-based assessment of immune cell type activity. Genes defined as being cell type-specific were used to calculate cell type scores, and gene set analysis grouped genes into functional immune-related categories. More in detail, the PanCancer Immune Profiling Panel had 40 candidate normalization genes (“housekeeping genes”) that had been selected based on their stability in gene expression data from multiple cancer types (34). However, normalization analysis used only the most stable subsets of these genes. In detail, the normalization was based on the geNorm algorithm (35) to identify an optimal subset of housekeeping genes. Next, the covariates to be used in the analysis were selected. In our project, the main covariates were the histological diagnosis and the genetic profile of the tumors. However, also clinical features of PTC and PDTC and immunohistochemical data on CD68+ or CD3+ infiltrating cells were considered. Additionally, several technical covariates were included either to confirm that they were not influencing the results or to account for their effects in the analysis. The PanCancer Immune Profiling Advanced Analysis Module used linear regression to investigate differential gene expression in response to multiple covariates simultaneously. This approach isolated the independent effect of each covariate on gene expression and avoided confounding due to technical variables. The large number of genes in the CodeSet made the use of raw P values problematic. Thus, the differential expression module provided two methods for adjusting P values: The Benjamini-Yekutieli (BY) false discovery rate and the Bonferroni correction. Furthermore, to understand what the immune cell profiling results represented, for each cell population a set of genes were assumed to be specific (reference genes) to that cell type. This assumption allowed to estimate a cell type’s absolute and relative abundance simply by taking the average log2 expression of its characteristic genes. In detail, this approach was used to test the relative abundance of B-cells, T-cells (helper T-cells, Treg, cytotoxic cells, CD8+ T-cells, exhausted CD8+ T-cells, CD45+ T-cells), natural killer cells, dendritic cells, macrophages, mast cells, and neutrophils. For B-cells, abundance of TNFRSF17, BLK, CD19, and MS4A1 mRNA was evaluated. For T-cells, abundance of CD3G, SH2D1A, CD6, CD3D, and CD3E mRNA was evaluated. For macrophages, abundance of CD84, CD163, and CD68 mRNA was evaluated. In detail, all three markers are specifically expressed by macrophages, but unable to define alone M1 or M2 polarization (36–38). For cytotoxic cells, abundance of GZBM, PRF1, KLRK1, GZMH, KLRB1, KLRD1, GNLY, GZMA, and CTSW mRNA was evaluated. For CD8+ T-cells, abundance of CD8A and CD8B mRNA was evaluated. For exhausted CD8+ T-cells, abundance of CD244, EOMES, and LAG3 mRNA was evaluated.
Kyoto Encyclopedia of Genes and Genomes pathway enrichment analysis
The software Pathview was used to overlay data on the Kyoto Encyclopedia of Genes and Genomes (KEGG) pathways (39). In detail, for each KEGG pathway, genes within the panel were mapped to the pathway, and differential expression information was overlaid on the protein-based KEGG pathway image.
IHC and staining score
Immunohistochemical analysis of CD3, CD19, CD45, CD68, CCL2, CCL3, and PDL1 expression was performed on FFPE tumor sections using rabbit monoclonal anti-CD3 ready to use antibody clone 2GV6, 1:100 dilution (Roche-Ventana Medical Systems, Tucson, AZ); rabbit monoclonal anti-CD19 antibody clone EP169, 1:100 dilution (cell marquee); mouse monoclonal CONFIRM anti-CD45, ready to use antibody clone LCA (RP2/18) (Roche-Ventana Medical Systems); rabbit monoclonal CONFIRM anti-CD68 ready to use antibody clone KP-1 (Roche-Ventana Medical Systems); mouse monoclonal anti-CCL2 (MCP-1) antibody clone 2D8, 1:100 dilution (Thermo Fisher); rabbit monoclonal anti-CCL3 ABfinity antibody clone 1H20L19, 1:100 dilution (Thermo Fisher); rabbit monoclonal anti-PDL1 antibody clone E1L3N, 1:200 dilution (Cell Signaling Technologies, Danvers, MA). Sections were stained using the BenchMark ULTRA IHC/ISH System (Roche-Ventana Medical Systems).
Expression of the immune cell markers was evaluated in leukocytes independently by two investigators (C.U. and F.B.) following a four-step scoring system: 0: < 25 positive cells; 1: 25 to 50 positive cells; 2: 51 to 100 positive cells; 3 > 100 positive cells. The evaluation was performed on 10 HPFs (high-power fields, 40× magnification) and then the mean of the values of different fields was calculated. For the mRNA/protein correlation analysis, the quantification of the cell densities was performed on the whole sample. Conversely, for the analysis of the cell distribution in the tumors, IT and peritumoral (PT) densities were separately scored. In the case of CD3+ leukocytes, the obtained IT and PT scores were used to stratify the cancer immune contexture according to the four major immune coordination profiles: hot, altered–immunosuppressed, altered–excluded, and cold (11). In detail, a IT score ≥ 2 defined hot tumors, a simultaneous IT and PT score of 0 defined cold tumors, an IT score of 1 defined altered–immunosuppressed tumors, a 1 to 3 PT score associated with an IT score of 0 defined an altered–excluded tumor.
Conversely, expression of chemokines and PDL1 was evaluated independently by two investigators (R.C. and M.M.) according to the H score system (40). In detail, intensity score, evaluated as absent (0), low (+1), moderate (+2), or high (+3), was added to stained cell %, evaluated as 0% (0), 1% to 25% (+1), 26% to 50% (+2), 51% to 75% (+3), and 76% to 100% (+4). Among the 0 to 7 scoring range, a four-tiered classification was extrapolated [0, 1 (2 and 3/7), 2 (4 and 5/7), and 3 (6 and 7/7)].
To estimate the correlations between mRNA data and immunohistochemical scores, the Nonparametric Spearman correlation coefficient (r) was calculated using GraphPad Software (San Diego, CA).
Results
Data normalization and data strength
The housekeeping genes selected for the normalization of the experiment presented a steady expression level in all the studied samples (41).
For each covariate included in the analysis, a histogram of P values testing each gene’s univariate association with the chosen covariate was created. The global distribution of P values for the entire experiment was evaluated. A significant mass of data showed a low P value, compatible with a strong association between the covariates and the gene expression data (41).
Sample clustering
None of the samples was excluded after data normalization (41). Figure 1(a) shows a heatmap of the normalized data generated via unsupervised hierarchical clustering. Interestingly, the histological covariates segregated in two major clusters: the one on the left, characterized by a lower upregulation of immune-related genes, included a subcluster of all the NT samples, two subclusters of all the PDTC samples but one, a subcluster of 10 PTCs, interposed between the two groups of PDTC, and one ATC. Conversely, the cluster on the right, characterized by a higher upregulation of immune-related genes, included a subcluster of all ATC but one, 15 PTCs, 14 of whom included in a subcluster, and one PDTC.
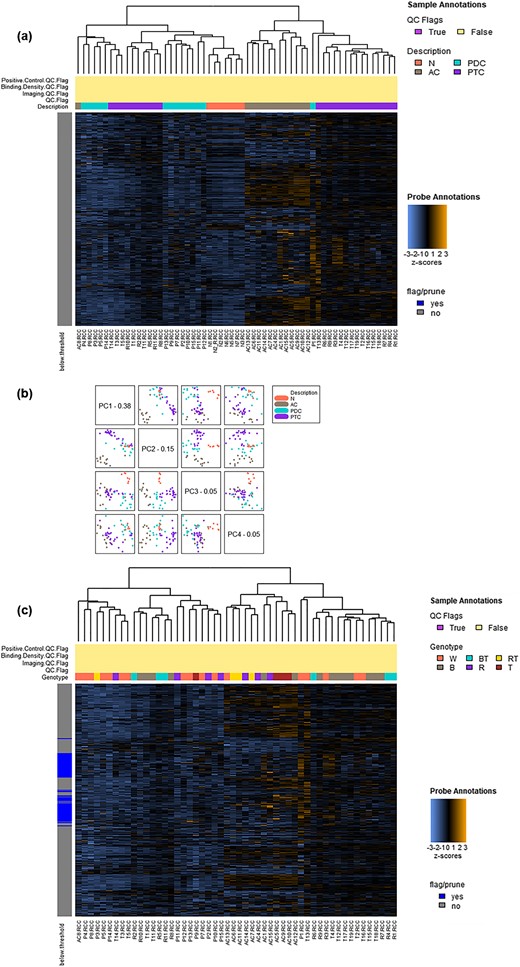
Sample clustering. (a) Heatmap of the normalized data, scaled to give all genes equal variance, generated via unsupervised clustering according to histological covariates. Orange indicates high expression; blue indicates low expression. The histological covariates segregate in two major clusters: the one on the left includes a subcluster of all the NT samples, two subclusters of all the PDTC samples but one, a subcluster of 10 PTCs, interposed between the two groups of PDTC, and one ATC. Conversely, the cluster on the right includes a subcluster of all ATC but one, 15 PTCs, 14 of whom included in a subcluster, and one PDTC. (b) PCA. The first four principal components of the gene expression data are plotted against each other and colored by the values of the selected covariate. The plotting of the first and second components allows a significant separation between ATC and all other histotypes. Conversely, the plotting of the second and the third components allows a significant clustering of NT samples and of each of all the other three cancer histotypes. (c) Heatmap of the normalized data, scaled to give all genes equal variance, generated via unsupervised clustering according to genetic covariates. Orange indicates high expression; blue indicates low expression. Cancer genotypes, including wild type, BRAF mutation, RAS mutation, TERT mutation, BRAF + TERT mutations, or RAS + TERT mutations, do not segregate with the gene expression data.
Principal component analysis (PCA) of the gene expression data showed that the plotting of the first and second components allowed a significant separation between ATC and all other histotypes [Fig. 1(b)]. Conversely, the plotting of the second and the third components allowed a significant clustering of NT samples and of each of all the other three cancer histotypes [Fig. 1(b)].
BRAF mutation, RAS mutation, TERT mutation, BRAF + TERT mutations, or RAS + TERT mutations did not segregate with the gene expression data [Fig. 1(c)]. However, a higher concentration of wild type cases could be detected in the cluster characterized by a lower upregulation of immune-related genes and specifically in the PDTC cases (3 RAS mutant cases, 1 TERT mutant case, 1 TERT + RAS mutant case, 9 cases wild type for all the considered mutations) [Fig. 1(c)].
Finally, in PTC and PDTC, although PDTC were characterized by a bigger tumor size and an older age at diagnosis (41), the clinical covariates age ≥ 45 years, bigger tumor size, male gender, tumor capsule infiltration, lymph node metastasis, and extrathyroidal infiltration did not segregate with the gene expression data (41).
Interestingly, no difference in clinical aggressiveness and genotype could be detected between PTC characterized by higher or lower upregulation of immune-related genes (41).
Tumor mutational burden
A total of 27 DNA samples from 14 PDTC and 13 ATC used in gene expression profiling experiment were provided to NEO New Oncology for analysis. Three DNA samples showed insufficient DNA material in the primary QC check. Five samples showed insufficient exonic territory coverage for robust TMB calling. One sample failed and therefore could not be analyzed. Informative cases (7 PDTC and 11 ATC) allowed to calculate a mean TMB of 7.40 ± 5.72/Mb in PDTC and 4.41 ± 2.86/Mb in ATC (41).
Gene expression data
Compared with NT samples, ATC presented a statistically significant expression change (P value BY < 0.01) in 263/730 genes (36%), PTC in 146/730 (20%), and PDTC in 63/730 (9%). The genes in common between ATC and PTC were 101, between ATC and PDTC 39, between PTC and PDTC 31, between ATC, PDTC, and PTC 24 [Fig. 2(a)].
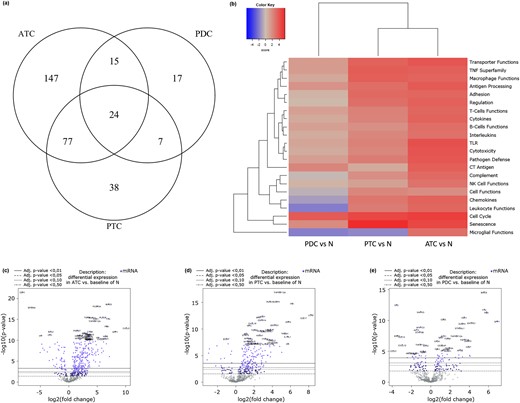
Gene expression data. (a) Venn diagram of genes showing a statistically significant expression change. ATC presented a statistically significant expression change (P-value BY < 0.01) in 263 genes, PTC in 146, and PDTC in 63. (b) Heatmap displaying each sample’s directed global significance scores. Directed global significance statistics measure the extent to which a gene set’s genes are up- or downregulated with the variable. Red denotes gene sets whose genes exhibit extensive overexpression with the covariate, blue denotes gene sets with extensive underexpression. ATC show the more extensive upregulation of all the 22 gene sets compared with NT samples, followed by PTC (19 upregulated gene sets, 1 downregulated one, and 2 neutrals). Conversely, PDTC display a slight upregulation only of 10 gene sets and the downregulation of four (eight resulted neutral). (c–e) Volcano plots displaying each gene’s -log10 (P-value) and log-twofold change with the selected covariate. Highly statistically significant genes fall at the top of the plot above the horizontal lines, and highly differentially expressed genes fall to either side. Horizontal lines indicate various P-value thresholds. Genes are colored if the resulting P-value is below the given P-value threshold. The 40 most statistically significant genes are labeled in the plot. (c) ATC show a high density of statistically significant upregulated genes and only few statistically significant downregulated genes. (d) PTC show a slightly lower density of statistically significant upregulated genes and only few statistically significant downregulated genes. (e) PDTC display a far lower number of statistically significant gene expression changes and a clear equability between up and downregulated genes.
Figure 2(b) shows the heatmap displaying each sample’s directed global significance scores compared with NT. In detail, 22 gene sets were considered (Table 1).
List of the 22 Gene Sets Considered in the Immunoprofiling Experiment
| Transporter functions |
| TNF superfamily |
| Macrophage functions |
| Antigen processing |
| Adhesion |
| Regulation |
| T-cell functions |
| Cytokines |
| B-cell functions |
| Interleukins |
| TLR |
| Cytotoxicity |
| Pathogen defense |
| CT antigens |
| Complement |
| NK cell functions |
| Cell functions |
| Chemokine’s |
| Leukocyte functions |
| Cell cycle |
| Senescence |
| Microglial functions |
ATC showed the more extensive upregulation of all the 22 gene sets compared with NT samples, followed by PTC (19 upregulated gene sets, 1 downregulated one, and 2 neutrals). Conversely, PDTC displayed a slight upregulation only of 10 gene sets and the downregulation of four (eight resulted neutral).
These findings were confirmed by the volcano plots of all the data displaying each gene’s -log10 (P value) and log-twofold change for the three histological covariates compared with NT. In detail, ATC [Fig. 2(c)] and to a lower extent PTC [Fig. 2(d)], showed a high density of statistically significant (P value BY < 0.01) upregulated genes (ATC 216 and PTC 135; Table 2) and only few statistically significant (P value BY < 0.01) downregulated genes (ATC 47 and PTC 11; Table 2). Conversely, PDTC [Fig. 2(e)] displayed a far lower level of statistically significant gene expression changes and a stronger equability between up-regulated and downregulated genes (up 38; down 25; Table 2).
Numerosity of Statistically Significant (P-Value BY < 0.01) Up- and Downregulated Genes in the Different Histotypes
| ATC | PTC | PDTC | ||||
|---|---|---|---|---|---|---|
| Up | Down | Up | Down | Up | Down | |
| All | 216 | 47 | 135 | 11 | 38 | 25 |
| Chemokines | 46 | 7 | 21 | 1 | 9 | 9 |
| Cytokines | 26 | 0 | 15 | 1 | 5 | 4 |
| ATC | PTC | PDTC | ||||
|---|---|---|---|---|---|---|
| Up | Down | Up | Down | Up | Down | |
| All | 216 | 47 | 135 | 11 | 38 | 25 |
| Chemokines | 46 | 7 | 21 | 1 | 9 | 9 |
| Cytokines | 26 | 0 | 15 | 1 | 5 | 4 |
Table 3 summarizes the mean gene expression changes of the functionally important genes upregulated in at least one of the three thyroid cancer histotypes (Table 3).
Statistically Significant Log-Twofold Changes of the Functionally Relevant Upregulated Genes in the Three Thyroid Carcinoma Histological Types
| ATC | PTC | PDTC | |
|---|---|---|---|
| CXCL9 | 4.77 | 2.28 | 2.38 |
| CXCL10 | 5.8 | 1.67 | 2.69 |
| CXCR4 | 1.6 | 2 | 1.19 |
| CCL2 | 3.58 | 1.44 | — |
| CCL3 | 2.87 | 1.38 | — |
| CCL4 | 2.34 | — | — |
| CCL5 | 2.25 | — | — |
| CCL17 | 2.5 | 7.43 | 2.26 |
| IL6 | 4.7 | 5.71 | 2.66 |
| IL6R | 1.27 | 0.927 | — |
| IL8 | 6.12 | 3.53 | 2.59 |
| IL10 | 2.31 | — | — |
| IL10R | 1.9 | — | — |
| TGFB1 | 3.33 | 2.08 | 1.77 |
| IFNA1 | — | — | — |
| IFNB1 | — | — | — |
| IFNA7 | 1.21 | — | — |
| IFNG | 1.78 | — | — |
| IFNAR1 | — | 0.407 | — |
| IFNAR2 | 0.924 | 0.842 | — |
| JAK1 | — | 0.445 | — |
| JAK2 | 1.09 | — | — |
| JAK3 | 2.46 | 1.82 | — |
| STAT1 | 2.06 | 1.22 | — |
| STAT2 | 0.946 | 0,898 | — |
| CD86 | 2.94 | — | — |
| CTLA4 | 2.29 | 2.11 | — |
| PDL1 | 3.46 | 1.28 | — |
| PDL2 | 4.06 | — | — |
| PD1 | 1.55 | — | — |
| PVR | 1.03 | — | — |
| TIGIT | 3.27 | 2.91 | — |
| TIM3 | 3.63 | 1.91 | — |
| LAG3 | 4.04 | — | — |
| IDO1 | 2.63 | — | 1.71 |
| GITR | 2.41 | 2.64 | — |
| 4-1BB | 2.21 | — | — |
| OX40 | 2.23 | — | — |
| CD40 | 0.783 | 0.691 | — |
Abbreviation: —, not upregulated.
PDTC lack chemokine and cytokine gene sets upregulation
Volcano plots evaluating the gene expression data for genes of the chemokines and cytokines gene sets of the three thyroid carcinoma histotypes compared with NT samples are shown in supplemental materials (41). It clearly appeared that ATC (41) followed by PTC (41) had a very robust (P value BY < 0.01) upregulation of these gene sets (chemokines: ATC: up 46, down 7; PTC: up 21, down 1; Cytokines: ATC: up 26, down 0; PTC: up 15, down 1; Table 2). Conversely, PDTC (41) showed a very poor regulation of these gene sets and a significant downregulation of considered mRNAs (chemokines: up 9, down 9; cytokines: up 5, down 4; Table 2).
Immune infiltrate cell type profiling
Genes previously shown to be characteristic of various cell populations were used to estimate these populations’ absolute and relative abundance. Quality control plots explored the validity of each cell type’s measurements and showed a statistically significant finding for cytotoxic cells, macrophages, T-cells, CD8+ T-cells, B-cells, and exhausted CD8+ T-cells (41). TIL score was extrapolated from the measures of the abundance of all the considered cell populations. In first instance, the estimated abundance of TIL was compared in the different thyroid cancer histotypes. As shown in Fig. 3(a), ATC showed the highest median TIL score, followed by PTC. Conversely, PDTC displayed the lowest median TIL score, even lower than that of NT samples. However, all cancer variants showed a wide range with one case of ATC falling at the level of NT samples, or one case of PDTC reaching the levels of ATC, or 10 PTC falling at the level of PDTC or NT samples. Interestingly, a comparison of TIL score in the analyzed thyroid samples and the heatmap of the normalized data generated via unsupervised clustering of Fig. 1(a) showed an association between the TIL abundance of the samples and their position in the cluster (41). In detail, the unique ATC sample and the 10 PTC samples clustering in the NT and PDTC cluster displayed TIL scores superimposable to that of NT and PDTC. Similarly, the PDTC sample clustering with ATC displayed a TIL score superimposable to that of ATC. Finally, ATC and PTC samples clustering together showed superimposable TIL score levels.
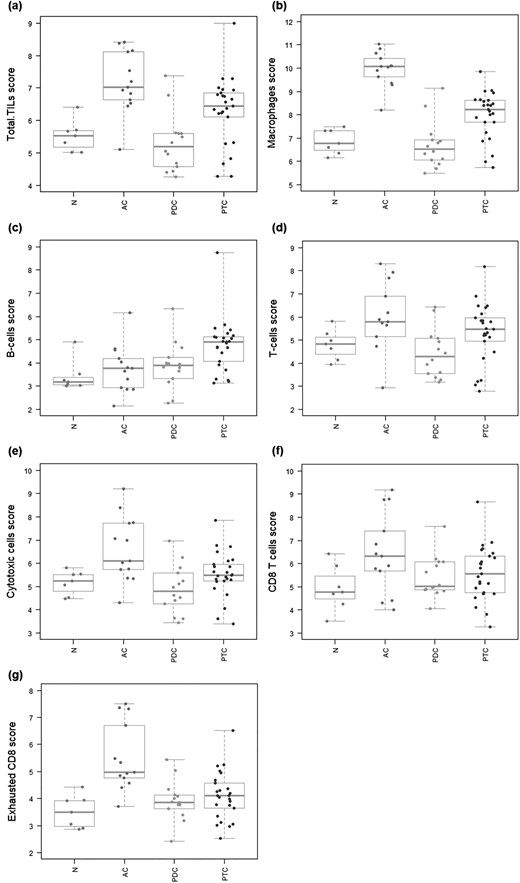
Immune infiltrate cell type profiling. Genes previously shown to be characteristic of various cell populations are used to measure these populations’ abundance. Covariates plots that compare cell type measurements to histological covariates are presented. (a) TILs. TIL score is extrapolated from the measures of the abundance of the considered cell populations. ATC show the highest median TIL score, followed by PTC. Conversely, PDTC display the lowest median TIL score, even lower than that of NT samples. (b) Macrophages. Median macrophage score results significantly higher in ATC and to a lower extent in PTC compared with NT samples. In PDTC median macrophage score is below that of NT samples. (c) B cells. Median B-cell score results significantly higher in PTC and to a lower extent in ATC and PDTC compared with NT samples. (d) T cells. Median T-cell score results significantly higher in ATC and to a lower extent in PTC compared with NT samples. In PDTC median T-cell score is below that of NT samples. (e) Cytotoxic cells. Median cytotoxic cell score results significantly higher in ATC and to a lower extent in PTC compared with NT samples. In PDTC median cytotoxic cell score is below that of NT samples. (f) CD8+ T cells. Median score of CD8+ T cells shows the following trend: ATC > PTC > PDTC > NT. (g) Exhausted CD8+ T cells. Median score of exhausted CD8+ T cells shows the following trend: ATC > PTC > PDTC = NT.
Moving to other cell types, median macrophage score resulted significantly higher in ATC and slightly lower in PTC compared with NT samples [Fig. 3(b)]. In PDTC median macrophage score was below that of NT samples [Fig. 3(b)]. Median B-cell score resulted significantly higher in PTC and slightly lower in ATC and PDTC compared with NT samples [Fig. 3(c)]. Median T-cell score resulted significantly higher in ATC and slightly lower in PTC compared with NT samples [Fig. 3(d)]. In PDTC median T-cell score was below that of NT samples [Fig. 3(d)]. Similarly, median cytotoxic cell score resulted significantly higher in ATC and slightly lower in PTC compared with NT samples [Fig. 3(e)]. In PDTC median cytotoxic cell score was below that of NT samples [Fig. 3(e)]. At regards of CD8+ T cells, median cell scores showed the following trend: ATC > PTC > PDTC > NT [Fig. 3(f)]. Median cell scores of exhausted CD8+ T cells followed a similar trend: ATC > PTC > PDTC = NT [Fig. 3(g)].
Relative abundance of the considered cell types in relation to total TIL score (41) or of CD8+ T cells in relation to exhausted CD8+ T cell score (41) was also analyzed in the different thyroid cancer histotypes in comparison with NT samples. It clearly appeared that ATC have higher infiltration of macrophages and of exhausted CD8+ T cells. PTC showed a more equability between cell types with a slight dominance of macrophages and B cells and lower levels of exhausted CD8+ T cells. Finally, the very few TIL present in PDTC appeared to include B cells, CD8+ T cells, and possibly exhausted CD8+ T cells (41).
mRNA/Protein correlations for immune cell markers
To confirm the immune infiltrate cell type profiling obtained by mRNA expression analysis, density of CD68+, CD3+, CD45+, and CD19+ leukocyte was evaluated by IHC. As shown in Fig. 4, a statistically significant correlation of mRNA data and immunohistochemical scores could be detected for CD68 [Fig. 4(a)], CD3 (either CD3D [Fig. 4(b)]) or (CD3E [Fig. 4(c)]), CD19 [Fig. 4(d)], and CD45 [Fig. 4(e)]. Moreover, a nice correlation between mRNA TIL score and CD45 immunohistochemical score could be observed (41).
![mRNA/Protein correlation for immune cell markers. Immunohistochemical analysis of CD3, CD19, CD45, and CD68 expression was performed on FFPE tumor sections. Expression of the immune cell markers was scored in leukocytes infiltrating the whole sample. The evaluation was performed on 10 HPFs (40× magnification) and then the mean of the values of different fields was calculated. The correlation between mRNA expression data and immunohistochemical score is shown for each sample. A statistically significant correlation of mRNA and protein data could be detected for CD68 (a), CD3 [either CD3D (b) or CD3E (c)], CD19 (d), and CD45 (e).](https://oup.silverchair-cdn.com/oup/backfile/Content_public/Journal/jcem/104/8/10.1210_jc.2018-01167/1/m_jc.2018-01167f4.jpeg?Expires=1747929378&Signature=pjFITG4Q9g3vqB9OsrPQR6uI6gAuYc5ep-g4ZBSfcj7pIV2DXemBlnlhPt4TMgyMI3NLkCaYuubCulpQb2e5ijvUi3JykDWaGv3RTih6ZjU4u2ma2DdGi1dfiYvMBPO9pq41zO0orh6NY7xztPQg6GaJNwGDORDLc6kg~ISZSlxwUL6O1hb9Jr6na6T8h6jfbrLUOhW9YulCcwENEicgr2rUd1yBQ0gJJeXDpipp-sr3yxUoy5JtKVJbwNE0Gz4044uIm5Rv2-WdupWOS5DtCVWocOy~2ycpztX8dhXGhz6iR3ZwhLKMlsF~eJfE8iGoLHfEQmT6RKCK-iAorZmd4w__&Key-Pair-Id=APKAIE5G5CRDK6RD3PGA)
mRNA/Protein correlation for immune cell markers. Immunohistochemical analysis of CD3, CD19, CD45, and CD68 expression was performed on FFPE tumor sections. Expression of the immune cell markers was scored in leukocytes infiltrating the whole sample. The evaluation was performed on 10 HPFs (40× magnification) and then the mean of the values of different fields was calculated. The correlation between mRNA expression data and immunohistochemical score is shown for each sample. A statistically significant correlation of mRNA and protein data could be detected for CD68 (a), CD3 [either CD3D (b) or CD3E (c)], CD19 (d), and CD45 (e).
Immunohistochemical analysis of the distribution of CD3+ and CD68+ leukocytes
Eleven ATC out of 12, characterized by a high upregulation of the genes of the considered panel, showed intense infiltration by CD68+ leukocytes and always a positive score for CD3+ leukocytes with different degrees of infiltration densities (41). Moreover, at IHC, 15 PTC, characterized by the highest upregulation of the genes of the panel between PTC, showed high frequency of a positive score for CD68+ and CD3+ leukocytes with different degrees of infiltration densities (41). Interestingly, the unique PDTC with this expression type was characterized by an intermediate CD68+ cell infiltration. Conversely, the remaining cases, characterized by a low upregulation of the genes of the panel, including 1 ATC, 10 PTC, and 13 PDTC cases, showed absent or poor staining for CD68 or CD3, with the exception of 3 PDTC that despite the low immune profile showed an intermediate/high infiltration of CD3+ and CD68+ leukocytes (41).
Interestingly, specific quantitation of CD3+ leukocytes at IT and PT level allowed to estimate the presence of 4/12 hot ATC (34%), 6/12 altered–immunosuppressed ATC (50%), 1/12 altered–excluded ATC (8%), 1/12 cold ATC (8%), 1/14 hot PDTC (7%), 2/14 altered–immunosuppressed PDTC (14%), 2/14 altered–excluded PDTC (14%), 9/14 cold PDTC (65%), 4/23 hot PTC (17.5%), 7/23 altered–immunosuppressed PTC (30.5%), 3/23 altered–excluded PTC (13%), and 9/23 cold PTC (39%) (Table 4) (41). The cold ATC belong to the low immune gene expression cluster. Only 1 PDTC, a cold one, belong to the high immune gene expression cluster. Six cold and one altered–excluded PTC belong to the low immune gene expression cluster. Four hot, six altered–immunosuppressed, three altered–excluded, and three cold PTC belong to the high immune gene expression cluster (41).
Cancer Immune Contexture of the Cases Evaluated by IHC
| Immune Contexture | ATC | PTC | PDTC |
|---|---|---|---|
| Hot | 4/12 (34%) | 4/23 (17.5%) | 1/14 (7%) |
| Altered–immunosuppressed | 6/12 (50%) | 7/23 (30.5%) | 2/14 (14%) |
| Altered–excluded | 1/12 (8%) | 3/23 (13%) | 2/14 (14%) |
| Cold | 1/12 (8%) | 9/23 (39%) | 9/14 (65%) |
| Immune Contexture | ATC | PTC | PDTC |
|---|---|---|---|
| Hot | 4/12 (34%) | 4/23 (17.5%) | 1/14 (7%) |
| Altered–immunosuppressed | 6/12 (50%) | 7/23 (30.5%) | 2/14 (14%) |
| Altered–excluded | 1/12 (8%) | 3/23 (13%) | 2/14 (14%) |
| Cold | 1/12 (8%) | 9/23 (39%) | 9/14 (65%) |
KEGG pathway enrichment analysis
Figures 5 and 6 show the KEGG pathways displaying the highest enrichment in upregulated genes of the experiment. In first instance, an upregulation of the expression of most of CXC subfamily chemokines and of some of their receptors could be detected in PTC and ATC and to a lower extent in PDTC [Fig. 5(a)]. Of note, all histotypes showed statistically significant upregulation of CXCL9, CXCL10, IL-8, and CXCR4 [Fig. 5(a); Table 3]. Similarly, several CC subfamily chemokines and corresponding receptors resulted upregulated especially in ATC and to a lower extent in PTC [Fig. 5(b)]. Conversely, PDTC showed only the upregulation of CCL17 [Fig. 5(b)]. Of note, CCL2, CCL3, CCL4, and CCL5 resulted significantly upregulated in ATC and CCL2 and CCL3 in PTC [Fig. 5(b); Table 3]. Regarding the hematopoietin subgroup of cytokines and cytokine receptors, again ATC and to a lower extent PTC displayed upregulation of many cytokine receptors, including IL-6R [Fig. 5(c); Table 3]. Of note, IL-6 resulted upregulated in all the cancer histotypes and represented the only upregulated gene of this functional cluster in PDTC [Fig. 5(c); Table 3]. ATC showed also upregulation of IL-10 and IL-10RA and IFNG [Figs. 6(a)–6(c); Table 3]. Regarding the activation of type I IFN pathways, IFNA1 and IFNB1 did not appear to be upregulated in any thyroid cancer histotype [Fig. 6(b); Table 3]. However, in ATC and PTC, but not in PDTC, INFA/B receptor molecules INFAR1 and INFAR2 resulted slightly upregulated [Fig. 6(b); Table 3]. Moreover, ATC showed a significant upregulation of IFNA7, JAK2, JAK3, STAT1, and STAT2, whereas PTC only of JAK1, JAK3, STAT1 and STAT2 (Table 3). Interestingly, all the histotypes showed upregulation of TGFB1 [Fig. 6(d); Table 3].
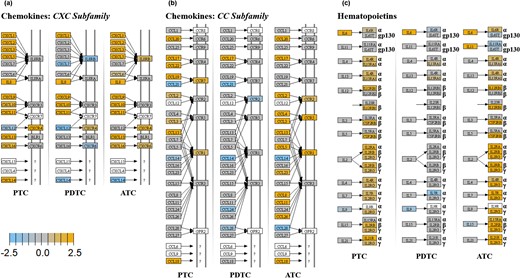
KEGG pathway enrichment analysis. Chemokines and hematopoietins. For each KEGG pathway, genes within the panel are mapped to the pathway and differential expression information is overlaid on the protein-based KEGG pathway image. Pathway nodes shown in white have no genes in the panel that map to them. Pathway nodes in gray have corresponding genes in the panel; however, no significant differential expression is observed. Nodes in blue denote downregulation relative to the selected baseline, whereas nodes in orange denote upregulation relative to the selected baseline. (a) CXC subfamily of chemokines. Upregulation of the expression of most of CXC subfamily chemokines and of some of their receptors can be detected in PTC and ATC and to a lower extent in PDTC. (b) CC subfamily of chemokines. Several CC subfamily chemokines and corresponding receptors result upregulated especially in ATC and to a lower extent in PTC. Conversely, PDTC show only the upregulation of CCL17. (c) Hematopoietins. The hematopoietin subgroup of cytokines and cytokine receptors result upregulated in ATC and to a lower extent PTC. IL-6, upregulated in all the cancer histotypes, represents the only upregulated gene of this functional group in PDTC.
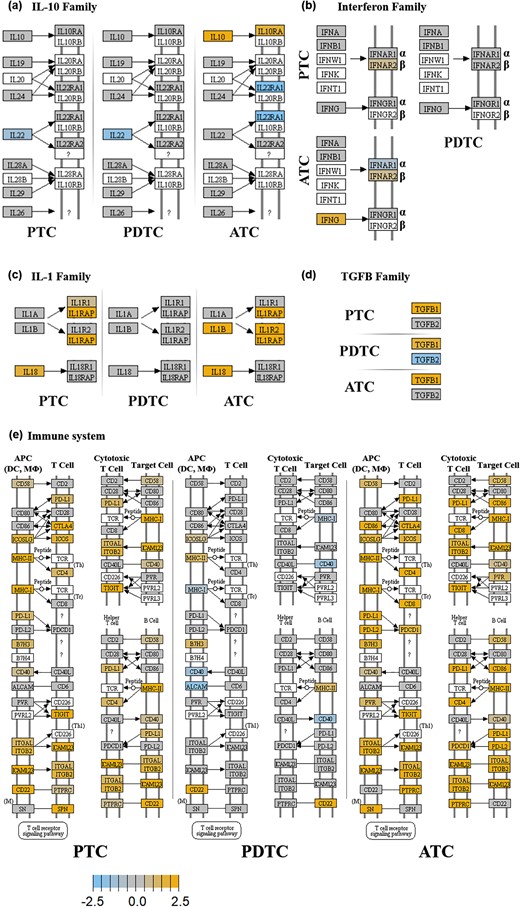
KEGG pathway enrichment analysis. IL-10, IFNs, IL-1, TGFB and molecules involved in adhesion/interaction. For each KEGG pathway, genes within the panel are mapped to the pathway and differential expression information is overlaid on the protein-based KEGG pathway image. Pathway nodes shown in white have no genes in the panel that map to them. Pathway nodes in gray have corresponding genes in the panel; however, no significant differential expression is observed. Nodes in blue denote downregulation relative to the selected baseline, whereas nodes in orange denote upregulation relative to the selected baseline. (a) IL-10 family. Only ATC show upregulation of IL-10 and IL-10RA. (b) IFN family. Only ATC show upregulation of IFNG. IFNA and IFNB do not appear to be upregulated in any thyroid cancer histotype. However, in ATC and PTC, but not in PDTC, INFA/B receptor molecules INFAR1 and INFAR2 result slightly upregulated. (c) IL1 family. Only ATC and PTC show upregulation of IL-1 and/or IL-18 and their receptors. (d) TGFB family. All the histotypes show upregulation of TGFB1 (e) Immune system adhesion/interaction mediators. ATC and to a slightly lower extent PTC show upregulation of genes of this group (see text). PDTC are only marginally affected.
Finally, evaluation of molecules involved in the adhesion/interaction of immune cells showed extensive upregulation in ATC and to a lower extent in PTC [Fig. 6(e)]. Again, PDTC were only marginally affected [Fig. 6(e)]. Interestingly, among the upregulated genes the following inhibitory immune checkpoint regulators could be detected in ATC: CD86 and CTLA-4, PDL1/PDL2 and PD1, PVR and TIGIT, and LAG3 and TIM-3 [Fig. 6(e); Table 3]. In regards of activating immune checkpoint regulators, ATC showed upregulation of the following molecules: GITR, 4-1BB, OX40, and CD40. At variance, PTC showed upregulation only of PDL1, CTLA4, TIGIT, TIM-3, GITR, and CD40 [Fig. 6(e); Table 3]. Finally, from the analysis of the expression data also upregulation of the inhibitory immune checkpoint IDO1 could be detected in ATC (Table 3). Conversely, IDO1 was the only immune checkpoint mediator to be overexpressed in PDTC (Table 3).
mRNA/protein correlations for chemokines and PDL1
To confirm the mRNA expression data for chemokines and PDL1, protein expression of CCL2, CCL3, and PDL1 was evaluated by IHC. As shown in Fig. 7, a statistically significant correlation of mRNA data and immunohistochemical scores could be detected for CCL2 [Fig. 7(a)] and PDL1 [Fig. 7(b)]. For CCL3 a close to statistically significant correlation could be shown [Fig. 7(c)].
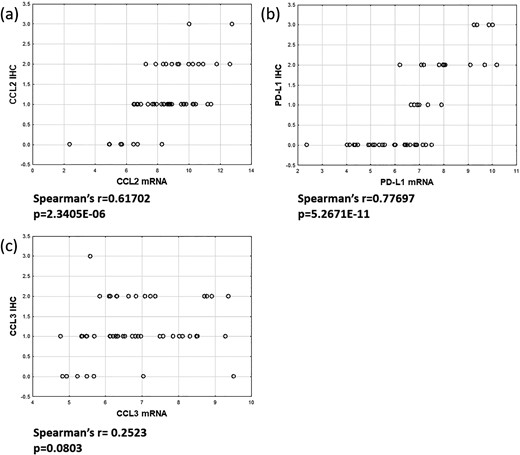
mRNA/Protein correlation for chemokines and PDL1. Immunohistochemical analysis of CCL2, CCL3, and PDL1 expression was performed on FFPE tumor sections. Expression of chemokines CCL2 and CCL3 and PDL1 was evaluated. The correlation between mRNA expression data and immunohistochemical score is shown for each sample. A statistically significant correlation of mRNA and protein data could be detected for CCL2 (a) and PDL1 (b). For CCL3 a close to statistically significant correlation could be demonstrated (c).
Discussion
During the past decades, anticancer immunotherapy has evolved from a promising therapeutic option to a robust clinical reality (42). The more potent approaches included the disruption of CD80/CD86-CTLA-4 and PDL1-PD1 interactions using anti-CTLA4 and anti-PD1 and anti-PDL1 antibodies, respectively. The exclusion of these inhibitory immune-checkpoints is associated with a reactivation of an antitumoral adaptive immune reaction. These responses are frequently rapid and durable, increase median overall survival compared with chemotherapy, and produce long-term survivors. However, despite these very significant results, only a minority of patients (15% to 20%) really benefit from these approaches. This is because of the potential for malignancies to co-opt myriad immunosuppressive mechanisms other than aberrant expression of PDL1 or of the lack of an adequate T-cell infiltration (26). Thus, a broader understanding of the interactions between tumor and immune system is instrumental to lead to the identification of new molecular targets, novel immunotherapy approaches and new efficacy biomarkers that may improve immunotherapy for cancer. For this purpose, we performed immune expression profiling in thyroid cancers of the papillary, poorly differentiated, and anaplastic histotype. Ultimate aim was the gain of a comprehensive view on immune mechanisms activated in the microenvironment of the tumors during cancer progression.
NanoString technology appeared as a very robust technique to analyze the expression changes of a specific cancer immune gene expression panel starting from FFPE archival material (43). As a matter of fact, none of the analyzed samples was discharged due to low quality results.
Interestingly, ATC, PTC, and PDTC showed each a peculiar and specific pattern of interaction with the immune system compared with NT samples. Indeed, either unsupervised hierarchical clustering or PCA showed a good differentiation of the histotype descriptors. In detail, the differences were clearly related to the degree of upregulation of the immune-related genes, high in almost all ATC, low in almost all PDTC, high or low in two subgroups of PTC, respectively.
In first instance, the question if the genetic background of the cancers could drive the sample clustering was addressed. For this purpose, a genotype analysis was performed looking for mutations in BRAF, RAS, TERT and their combination. Unexpectedly, BRAF, RAS, or TERT mutations did not appear to segregate with the gene expression clustering. Eventually, a higher prevalence of BRAF, RAS, and TERT wild type cases could be detected in the PDTC subgroup. Thus, other not explored genetic or epigenetic events might have driven progression of the PDTC considered in our study. Similarly, no other negative clinical prognostic feature of PTC and PDTC, including age ≥ 45 years, bigger tumor size, male gender, tumor capsule infiltration, lymph node metastasis, and extrathyroidal infiltration, segregated with the gene expression data. In particular, no difference in genotype or clinical behavior could be detected between PTC samples clustering in the two groups of high or low immune gene expression. These data appear to indicate that there is a separation between degree of interaction of tumor cells with the microenvironment and the genotype or the clinical aggressiveness of the cancers, with the exception of histotype for ATC and PDTC and their intrinsic aggressiveness and the low rate of BRAF, RAS, and TERT mutations in PDTC. However, because this study was not designed to find correlations between the immune gene expression data and genetic or prognostic clinical features of the cancers, further studies are warranted to definitely prove this finding.
Conversely, correlation between the position of the samples in the cluster analyses and the estimation of TIL score, according to the expression of genes previously shown to be characteristic of the various cell populations, indicated that TIL quantity and quality was a more consistent determinant of the peculiar gene expression profile of each sample. Due to the experimental design, characterized by RNA extraction from tissue blocks, it was not possible to know with certainty the precise source of the differentially expressed mRNAs. However, we were aware that mRNA fold changes were impacted by the density of infiltrating immune cells and the obtained results clearly confirmed this statement. Independently of the origin of the differences in the gene expression profiles, it appeared that each considered histotype had its peculiar infiltration in TILs. In detail, ATC and a subgroup of PTC had in average a rich TIL infiltration. Conversely, PDTC and the remaining PTC had a median TIL infiltration that was even lower than that of NT samples. Interestingly, the rich TIL infiltration was associated with the expression of multiple chemokines capable of recruiting effector T cells (44, 45). Conversely, the poor TIL infiltration was associated with a poor upregulation or even downregulation of the immune-related gene sets, including downregulation of the one related to chemokines.
Analysis of specific immune cells subpopulations showed a high density of macrophages in ATC and to a lower extent in PTC, as previously reported (21–24). Recruitment of macrophages and their conversion into M2 TAM is expected to be mediated by the high expression of several cytokines/chemokines and their receptors, such as IL-6, IL-8, and CXCR4 (46, 47), which were found to be upregulated in thyroid cancers in the present experiment. Conversely, B cells appeared to be more represented in PTC and to a lower extent in PDTC and ATC. Either TAMs with an M2 polarization or B lymphocytes with a regulatory phenotype (Breg) might contribute to a microenvironmental immune suppression by secreting the cytokines IL-10 and TGF-β1 (48, 49), which were actually found to be upregulated in thyroid cancers in the present experiment. In detail, TGFB1 resulted upregulated in ATC, PTC, and PDTC, whereas IL-10 and its receptor IL-10RA were upregulated only in ATC.
T-cell infiltration resulted higher than NT in ATC and to a slightly lower extent in PTC and lower than NT in PDTC. These data are clearly compatible with the gene expression profile detected for the different thyroid cancer histotypes. Indeed, high number of tumor infiltrating lymphocytes has been correlated with increased expression of multiple chemokines capable of recruiting effector T cells, including CCL2, CCL3, CCL4, CCL5, CXCL9 and CXCL10 (44, 45). ATC showed the highest expression of these chemokines followed by PTC. Conversely, PDTC showed the lowest expression of these genes. Thus, at NanoString analysis, most ATC could be addressed as T-cell inflamed “hot” tumors. On the contrary, most PDTC appeared as non–T-cell-inflamed “cold” tumors. At variance, PTC could be either T-cell inflamed or non–T-cell-inflamed. Interestingly, an additional support for this statement still came from the analysis of the gene expression profile. Indeed, a functionally relevant characteristic of T-cell inflamed tumors is the expression of type I IFN and IFN-inducible genes (44, 45). Although the expression of IFNA7 could be detected only in ATC, a slight overexpression of IFN receptor molecules INFAR1 and 2 and a significant upregulation of their signaling mediators of the JAK and STAT family could be detected in ATC and PTC, but not in PDTC. Analysis of the abundance of cytotoxic cells and of CD8+ T cells clearly indicated that the T-cell inflamed infiltration of ATC and PTC is characterized by effector CD8+ T cells. Although in general PDTC could not be defined as T-cell inflamed tumors, due to the fact that neither T cells nor CD8+ T cells abundance was different from that of NT samples, a relative overrepresentation of CD8+ T cells in their poor immune cell microenvironment infiltration could be detected. This finding might be correlated to the unexampled overexpression of the chemokines CXCL9 and CXCL10 that play a known role in CD8+ T-cell recruitment by binding to their surface CXCR3 receptors (50). However, we can speculate that the lack of overexpression and secretion of other chemokines, related to a reduced or no activation of a type I IFN response, might limit CD8+ T-cell migration into most of these tumors.
Finally, based on the expression of peculiar mRNA types (CD244, EOMES, and LAG3), exhausted CD8+ T cells absolute and relative density was estimated. Highest abundance of the considered markers was detected in ATC and to a lower extent in PTC, followed by PDTC. Considering the relative lack of specificity of all the three considered markers (51–53), their low expression in NT and PDTC might have indicated a negligible density of exhausted CD8+ T cells in these samples.
Indeed, only in ATC and to a lower extent in PTC, the increase in exhausted CD8+ T cells was associated with the overexpression of several inhibitory immune checkpoint mediators such as CD86 and CTLA-4 (49), PDL1/PDL2 and PD1 (54), PVR and TIGIT (55), LAG3 itself (53), and TIM-3 (56) known to turn down CD8+ T-cell function. Interestingly, the primordial immune suppressive enzyme IDO1, involved in the transformation of tryptophan into kynurenine, and in a consequent reduction in T-cell activation in the tumor microenvironment (57), resulted upregulated in ATC and PDTC. Finally, ATC and to a lower extent PTC, but not PDTC, also showed upregulation of stimulatory immune checkpoint mediators, such as GITR, 4-1BB, OX40, and CD40. Altogether, these data confirm the rich infiltration of immune cells, including T lymphocytes, in ATC and a subgroup of PTC and their lack in most PDTC.
Importantly, mRNA expression data were confirmed by IHC analysis in the case of immune cell markers for macrophages (CD68), T lymphocytes (CD3), B lymphocytes (CD19) and leukocytes (CD45), CCL2 and CCL3 chemokines, and PDL1. Moreover, a correlation between mRNA TIL score and CD45 IHC score could be observed. Altogether, this information established the consistency of the NanoString findings.
The accomplishment of the IHC analysis for CD3+ leukocytes gave us also the possibility to analyze in more detail the cancer immune contexture referred to T lymphocyte infiltration (11). In detail, this analysis confirmed a predominance of T-cell infiltration in ATC, either in the form of a frank hot phenotype (34% of cases) or an altered–immunosuppressed one (50% of cases). Conversely, PDTC appeared predominantly altered–excluded (14%) or cold (65%), characterized by an absent IT T-cell infiltration. PTC had a mixed behavior: hot (17.5%), altered–immunosuppressed (30.5%), altered– excluded (13%), cold (39%). A clear overlap between the cancer immune contexture and the immune gene expression data could be confirmed specially for ATC and PDTC. Moreover, the gene expression data (i.e., those regarding the immune checkpoints expression) strongly confirm the proposed T-cell-based classification of the tumors.
In regards of the six immune subtypes recently described using the TCGA data of 10,000 cancers (12), most ATC of our casuistry could be ascribed to the INF-γ dominant subtype. PTC, as stated in the paper by Thorsson et al. (12), belong to the inflammatory subtype. Conversely, the framing of PDTC in one of the six immune subtypes appeared difficult.
A question that arose from the analysis of our data regarded the model of thyroid cancer progression that could sustain these findings, characterized by the evidence that differentiated thyroid carcinomas are inflamed with different degrees of T-cell infiltration and the progression to ATC follows more often a “hot pathway”, including altered–immunosuppressed cases, whereas the progression to PDTC more often a “cold pathway,” including more rarely altered–excluded cases. Interestingly, the study of the TMB did not show any significant difference between PDTC and ATC. Both histotypes presented a mean TMB at least 10 times higher than the mean TMB (0.41/Mb) described for PTC in the TCGA study (34). These data indicated that increase of TMB is associated to thyroid cancer progression but is not directly involved in thyroid cancer immune phenotype development. A similar phenomenon has already been described in melanoma and, in the case of a cold microenvironment associated to high TMB, was ascribed to the lack of BATF3-lineage dendritic cells (58). Moreover, no apparent correlation between the searched driver mutation and the gene expression data could be detected, especially in the case of PTC. After taking into account all those considerations, we proposed the following model: Genetic mutations and epigenetic changes play a role in driving transformation and progression/dedifferentiation of thyroid carcinomas, by deregulating growth, cell survival and angiogenesis and stimulating invasion, metastasis, and dedifferentiation. The interaction between tumor cells and the microenvironment depends either on specific genetic events, which trigger the expression of chemokines or cytokines or on other factors such as individual shape of the immune cells influenced by environmental features including gut microbiome. Indeed, the mixed immunological behavior of PTC may be ascribed to the fact that their tumor microenvironment is more often shaped by activated oncogenic pathways that may or may not drive specific chemokine expression than by an antigen-mediated interaction between the tumor cells and the immune system. Conversely, in the vision of a continually changing immune/tumor interface during tumor progression, combination of dedifferentiating signals with a rich antigen-mediated interaction between tumor cells and the microenvironment, also maintained by a high TMB, pushes progression in a prominently “hot pathway” that ultimately drives the development of T-cell infiltrated primary ATC or ATC-like tumors (hot or altered–immunosuppressed) detectable at the time of histological examination. Conversely, combination of dedifferentiating signals with a poor interaction between tumor cells and the microenvironment, including lack of specific dendritic cell activation in the case of high TMB, drives the “cold pathway” of PDTC-like tumors (cold). Aberrant tumor vasculature and/or stroma may also be involved (rare altered–excluded). Further studies are warranted to prove this hypothesis.
In summary, in this immune gene expression profiling experiment all but one ATC and three PDTC presented a microenvironment infiltrated by macrophages and T cells, showing a hot or altered–immunosuppressed phenotype. These cancers appeared to express negative immune checkpoint mediators involved in the functional exhaustion of CD8+ T cells. Moreover, infiltrating T lymphocytes also appeared to express activating receptors. These phenotypes explain the peculiar clustering of ATC in the immune profiling experiment. Immunotherapeutic approach for primary cancers or their metastases with hot features should foresee combination of inhibitory immune checkpoint disruptors and activating immune checkpoints stimulators. Conversely, in the case of altered–immunosuppressed tumors the former strategies should be combined with measures to inhibit inhibitory soluble factors and immunosuppressive cells or to activate innate immune response (12). Interestingly, the response of ATCs to monotherapy with the anti-PD1 antibody spartalizumab showed a promising overall response rate and overall disease control rate (28) that could be improved by combinatorial therapy. Conversely, all PDTC but three, as one ATC, displayed a poor or no IT infiltration by macrophages and T cells, showing a cold or altered–excluded phenotype. These phenotypes explain the peculiar clustering of PDTC in the immune profiling experiment. Primary cancers or their metastases with these PDTC-like features are not expected to respond to the treatment with inhibitory immune checkpoint disruptors alone. Immunotherapy should in first instance foresee a strategy to increase lymphocyte priming and/or immune infiltration of the tumor microenvironment (26) such as radiotherapy, chemotherapy, DNA-repair-based therapy, targeted therapy, adoptive cell therapy, oncolytic therapy, or vaccine-based therapy (12). It is possible to speculate that the poor responses (2/22) in the first pembrolizumab study as single therapy in advanced DTC (27) may be related to the inclusion of patients harboring tumors of the PDTC type. Combination of TKI and anti-PD1 antibody might overcome this limit. However, it is still necessary to continue the characterization of thyroid cancer microenvironment to identify and improve new immunotherapeutic strategies and efficacy biomarkers.
Acknowledgments
Financial Support: This work was supported by a grant from the “Fondazione Cassa di Risparmio di Perugia” – Perugia, to E.P., and by a grant from the “Fondazione Brunello e Federica Cucinelli” – Corciano, Perugia, to E.P.
Disclosure Summary: M.P. is employed by Diatech Pharmacogenetics srl. The remaining authors have nothing to disclose.
Abbreviations:
- ATC
anaplastic thyroid carcinoma
- BY
Benjamini Yekutieli
- CTLA-4
cytotoxic T-lymphocyte associated-4
- FFPE
formalin-fixed/paraffin-embedded
- IDO1
indoleamine 2,3-dioxygenase 1
- IFN
interferon
- IHC
immunohistochemistry
- IT
intratumoral
- KEGG
Kyoto Encyclopedia of Genes and Genomes
- MDSC
myeloid-derived suppressor cell
- NT
normal thyroid
- PCA
principal component analysis
- PD1
programmed death 1
- PDL1
programmed death ligand 1
- PDTC
poorly differentiated thyroid carcinoma
- PT
peritumoral
- PTC
papillary thyroid carcinoma
- Th
T helper
- TIL
tumor infiltrating leukocyte
- TMB
tumor mutational burden
- Treg
T-regulatory
References
Author notes
R.G., S.M., and C.U. contributed equally to this study.
