


Abstract
To our knowledge, circadian rhythms have not been examined in girls with polycystic ovarian syndrome (PCOS), despite the typical delayed circadian timing of adolescence, which is an emerging link between circadian health and insulin sensitivity (SI), and decreased SI in PCOS.
To examine differences in the circadian melatonin rhythm between obese adolescent girls with PCOS and control subjects, and evaluate relationships between circadian variables and SI.
Cross-sectional study.
Obese adolescent girls with PCOS (n = 59) or without PCOS (n = 33).
Estimated sleep duration and timing from home actigraphy monitoring, in-laboratory hourly sampled dim-light, salivary-melatonin and fasting hormone analysis.
All participants obtained insufficient sleep. Girls with PCOS had later clock-hour of melatonin offset, later melatonin offset relative to sleep timing, and longer duration of melatonin secretion than control subjects. A later melatonin offset after wake time (i.e., morning wakefulness occurring during the biological night) was associated with higher serum free testosterone levels and worse SI regardless of group. Analyses remained significant after controlling for daytime sleepiness and sleep-disordered breathing.
Circadian misalignment in girls with PCOS is characterized by later melatonin offset relative to clock time and sleep timing. Morning circadian misalignment was associated with metabolic dysregulation in girls with PCOS and obesity. Clinical care of girls with PCOS and obesity would benefit from assessment of sleep and circadian health. Additional research is needed to understand mechanisms underlying the relationship between morning circadian misalignment and SI in this population.
Polycystic ovarian syndrome (PCOS) affects 10% to 15% of women and is characterized by chronic hyperandrogenism, anovulation, or menstrual irregularity, and is associated with obesity (1,2) and insulin resistance (IR) (3,4). Women with PCOS are at increased risk for some of the leading causes of morbidity and early mortality, including type 2 diabetes and cardiovascular disease (1, 4, 5). Identifying novel targets that may prevent or mitigate these negative health outcomes is critical. Emerging evidence suggests that women with PCOS may have circadian rhythm dysfunction and poorer sleep than their healthy peers; thus, circadian and sleep health may be one such target. However, less is known about these factors in adolescent girls with PCOS.
Circadian rhythms are near–24-hour patterns of physiology and behavior that are regulated by the master circadian pacemaker located in the suprachiasmatic nucleus (SCN) of the hypothalamus (6, 7). Daily oscillations of light and darkness synchronize, or entrain, the circadian SCN pacemaker to the 24-hour day (8, 9). Peripheral cellular clocks located outside of the SCN also influence local tissue function and can be synchronized by circadian-driven behaviors such as feeding-fasting cycles (10). Melatonin is a hormone synthesized by the pineal gland and its circadian rhythm is regulated by the SCN. Thus, melatonin is commonly used as a marker of SCN time. In general, levels of melatonin are low during the daytime, rise on average in the evening before habitual bedtime, and return to low daytime levels after habitual waketime (11). Melatonin is the most precise phase marker of the SCN circadian pacemaker when it is measured in dim light, because brighter light can acutely suppress melatonin levels (12). The onset and offset of melatonin secretion, called the dim-light melatonin onset (DLMOn) and the dim-light melatonin offset (DLMOff), are the most commonly used phase markers representing the beginning and end of the biological night, respectively (9). Melatonin can easily be measured in plasma or saliva, and levels in saliva are ∼30% to 40% of the levels in plasma (13). The gold standard threshold for melatonin onset in plasma is 10 pg/mL (14); therefore, the DLMOn/Off threshold in saliva is commonly 3 or 4 pg/mL (15). Although other rhythms such as core body temperature and cortisol have also been used as markers of circadian timing, melatonin phase is considered the most reliable marker, because it is less affected by changes in physiology or behaviors (16, 17).
Adolescents experience a puberty-related delay in timing of melatonin secretion in comparison with younger age groups (18). Indeed, adolescents often endorse an eveningness chronotype (e.g., “night owl”), or preference to stay awake later and sleep later (19). As a result, chronic insufficient sleep, with typical sleep durations less than the recommended 8 to 10 hours per night, is common in adolescence (20–22). Short sleep has been correlated with obesity (23, 24), cardiovascular disease (25), and insulin resistance (IR) (26–28) in adults, with some evidence for similar associations in adolescents (29). Emerging evidence suggests that circadian misalignment is also associated with IR in adults (30–33), but, to our knowledge, this has not been examined in youth despite their increased risk for delayed circadian rhythm.
Beyond the risk of adolescence for poor sleep and circadian health, girls with PCOS may be uniquely predisposed to have sleep and circadian disruption. Women with PCOS report greater excessive daytime sleepiness and reduced sleep quality compared with control subjects (34, 35). Elevated nighttime and morning melatonin levels and lower day-night variability in melatonin concentrations have been reported in women with PCOS compared with healthy peers (35–37). Moreover, genetic variants in melatonin receptors have been associated with increased risk of developing PCOS and impaired insulin sensitivity (SI) and secretion (38). Whereas adolescent girls with PCOS have been reported to have greater rates of sleep-disordered breathing, increased sleep onset latency, poorer sleep efficiency, and more daytime sleepiness than healthy peers, circadian health has not been examined in this population (39–44).
Thus, the goal of the current study was to examine differences in objectively-measured circadian rhythms between obese adolescents with PCOS and obese control subjects, as well as to evaluate associations between circadian variables and SI in this at-risk population. We hypothesized that the PCOS group would have later melatonin timing and greater circadian misalignment that the obese control subjects, and that later melatonin timing and circadian misalignment would be significantly associated with SI and free testosterone.
Materials and Methods
Participants
Participants were recruited from adolescent medicine, weight management, and endocrinology specialty clinics at Children’s Hospital Colorado between August 2014 and March 2018. They were enrolled in one of two protocols with identical measures except where noted: (1) Liver and Fat Regulation in Overweight Adolescent Girls (APPLE; Clinicaltrials.gov identifier NCT02157974; N = 78: n = 59 girls with PCOS and n = 19 obese control subjects) and (2) Sleep Timing and Insulin Resistance in Adolescents with Obesity (CIRC; Clinicaltrials.gov identifier NCT02585830; N = 14 obese control subjects). Some results from a subset of participants (n = 31 obese control subjects only) have been previously reported (45). Participants included in this analysis from APPLE were all participants who completed the protocol except those with a repeated study on PCOS medication (n = 3). Participants included in this analysis from CIRC included all girls who completed the protocol. The final sample included 59 adolescent females with PCOS and obesity and 33 control subjects with obesity and no PCOS.
All participants were between the ages of 12 and 21 years, habitually physically inactive (<3 hours of physical activity per week), in late puberty (Tanner stage 4 or 5), and had body mass index (BMI) >90th percentile. PCOS was defined per National Institutes of Health criteria: irregular menses >2 years postmenarche and elevated testosterone concentrations (46). Nine of the PCOS participants were treated with combined oral contraceptives, nine received a one-time dose of a short-acting GLP-1 agonist (exenatide) the night before fasting laboratory studies, and two received at least 6 months of metformin therapy (2000 mg/d). The control group included menarchal girls with a regular menses interval of every 24 to 35 days and normal testosterone concentrations.
Exclusion criteria for all participants were diabetes (HbA1c ≥6.5%); liver disease other than nonalcoholic fatty liver disease and alanine amino transferase level >125 IU/mL; medications affecting sleep or IR other than those specified previously in a few select participants; pregnancy or breastfeeding; and Hb level <9 mg/dL. The protocol was approved by the Colorado Clinical and Translational Sciences Institute Scientific Advisory Committee and Colorado Multiple Institutional Review Board, and all participants and parents gave informed assent or consent before completing research procedures.
Procedures
After a screening visit including history, physical examination, questionnaires, and fasting laboratory studies to determine PCOS status, an actigraphy monitor was provided to participants to wear for 7 days at home. During an overnight admission to the Children’s Hospital Colorado Clinical and Translational Research Centers, participants received a fixed macronutrient, weight-maintenance snack and dinner to control for the potential effect of diet on SI measurements. Salivary melatonin was sampled hourly in the evening and following morning (CIRC participants also had overnight melatonin sampling). The following morning, an oral sugar tolerance test (OSTT) was conducted. Participants were scheduled in the follicular phase when possible, because menstrual timing can influence measures of SI, sleep, circadian rhythms, and melatonin levels (47). Participants were also asked to refrain from exercising in the 72 hours before the study visit, because activity can affect SI.
Laboratory analyses
Analyses were performed by the University of Colorado Anschutz Research core laboratory or the Children’s Hospital Colorado clinical laboratory, except where noted. Triglycerides and high-density lipoprotein were analyzed enzymatically (Hitachi 917 autoanalyzer; Boehringer Mannheim Diagnostics, Indianapolis, IN). HbA1c was calculated using Diabetes Control and Complications Trial–calibrated high-performance ion-exchange liquid chromatography (Bio-Rad Laboratories, Hercules, CA). Radioimmunoassay was used to analyze serum insulin (Millipore, Billerica, MA). Total testosterone was measured by HPLC–tandem mass spectrometry, free testosterone via equilibrium dialysis, and SHBG via chemiluminescent immunoassay (Esoterix Laboratories, Calbassas Hills, CA). Salivary samples were assayed for melatonin using direct double-antibody RIAs that have been validated by gas chromatography–mass spectroscopy [Buhlmann Laboratories, Schonenbuch, Switzerland; 0.3 pg/mL sensitivity (minimal level of detection); interassay coefficients of variation, 14% to 17%; intraassay coefficients of variation, 11% to 14% (48)] at the Sleep and Chronobiology Laboratory at the University of Colorado Boulder.
Measures
Sleep/wake monitoring was conducted using Spectrum Plus and Actiwatch2 actigraphy devices to estimate sleep duration and timing for 7 days at home (Phillips Respironics, Bend, OR). A concurrent sleep diary was completed to allow for removal of artifacts (e.g., failure to wear the watch during a portion of the night). Bedtime and waketime, total sleep time, sleep-onset latency, sleep efficiency, and wake after sleep onset were calculated using Actiware Sleep, version 6, software and standard scoring rules (Phillips Respironics, Pittsburgh, PA) (49).
Melatonin was measured via serial saliva sampling conducted every 60 minutes during waking hours beginning at 7 pm until 12 pm the following day. In addition, the CIRC cohort had 30-minute sampling around actigraphy-estimated habitual bed and wake times, and hourly sampling overnight. All participants were allowed to sleep per their usual schedule [CIRC participants were woken briefly to provide overnight saliva samples and then allowed to return to sleep, because acute sleep has little to no impact on melatonin levels (50)]. Dim light conditions (<10 lux measured at angle of gaze) were maintained and participants were asked to remain recumbent and to refrain from eating at least 15 minutes before sampling to minimize melatonin-suppressing effects and sample contamination (15). Dim-light melatonin onset (DLMOn) was defined as the clock time at which evening salivary melatonin concentrations increased and remained above a 3 pg/mL threshold, using linear interpolation between successive samples (15). Dim-light melatonin offset (DLMOff) was the linear interpolated clock time when concentrations went below the 3 pg/mL threshold (15). Later DLMOn and DLMOff are indicative of a later circadian rhythm (15, 18). Duration of melatonin secretion was calculated as the time (in hours) from DLMOn to DLMOff. The temporal alignment between actual sleep behaviors and internal circadian clock were quantified by calculating phase angles (PAs) of entrainment, the time interval between circadian markers (DLMOn and DLMOff) and average actigraphic estimates of sleep time (bedtime and wake time) (15).
To assess SI, an OSTT was completed in the morning after an overnight fast. After fasting baseline laboratory studies and consumption by the APPLE cohort of a 76- to 78-g dextrose drink with 25 g of fructose, serum glucose and insulin measurements were collected every 30 minutes for 4 hours. Homeostatic Model Assessment of Insulin Resistance (HOMA-IR) and Matsuda Index were calculated to quantify SI; higher HOMA-IR and lower Matsuda Index indicate worse SI. The Matsuda Index was calculated with the following equation: 10,000/([fasting insulin (μU/mL) × fasting glucose (mmol/L)] × [mean OSTT insulin (μU/mL) × mean OSTT glucose (mmol/L)]) (51). HOMA-IR was calculated as [fasting insulin (μU/mL) × fasting glucose (mmol/L)]/22.5 (52). HOMA-IR was not calculated for participants receiving exenatide or metformin (n = 11), because these medications would affect this measure.
Participants completed the Cleveland Adolescent Sleepiness Questionnaire (CASQ) (53) and the Sleep Disturbances Scale for Children (SDSC) (54) at the screening visit. The CASQ has demonstrated good internal consistency (Cronbach α = 0.89) and construct validity (53); a higher score indicates greater daytime sleepiness. The SDSC assesses symptoms of common sleep disorders over the past 6 months, and the Sleep Breathing Disorders subscale was used for the current study. The SDSC has demonstrated adequate internal consistency (Cronbach α = 0.71 to 0.79) (54). Thirty participants from the APPLE cohort also underwent overnight polysomnography during the overnight study visit.
Statistical analyses
Demographic and clinical characteristics were summarized with descriptive statistics. Standardized residuals were examined for all variables and assumptions of normality were determined to be withheld and no transformations required. Independent samples t tests were performed to compare sleep and melatonin variables between groups. The relationship between group membership (PCOS vs control subjects) and melatonin values over time (7 pm to midnight and 5 am to 12 pm) was modeled using a piecewise linear mixed-effects model. Random intercepts and slopes accounted for potential correlations between repeated measures on the same participant. Analysis of covariance was used to evaluate the association between sleep timing and melatonin timing between groups. Nonsignificant interaction terms were removed from the models. Linear regression models were used to evaluate the association between IR and melatonin variables (model 1), controlling for group status (model 2). SAS, version 9.0 (SAS Institute, Cary, NC); SPSS Statistics, version 24 (IBM, Armonk, NY); and MATLAB (MATLAB, Natick, MA) were used for analyses.
Results
Participant characteristics
There were no significant differences between groups in regard to age, BMI percentile, or HbA1c; there were more Hispanic participants in the control group (P < 0.05; Table 1). As expected, participants with PCOS had higher HOMA-IR and free testosterone values, and lower Matsuda Index compared with control subjects. There were no differences between groups for questionnaire-reported excessive daytime sleepiness (i.e., the CASQ) or sleep-disordered breathing (i.e., the SDSC), but the PCOS cohort had a higher apnea-hypopnea index than did control subjects (P = 0.01). Neither the SDSC score or the apnea-hypopnea index were significantly associated with demographic, SI, or melatonin variables, and thus they were not controlled for in subsequent analyses. Daytime sleepiness was significantly associated with Matsuda Index (r = −0.23; P = 0.03) and was included as a covariate in analyses.
Participant Demographics, Physical Characteristics, and SI Measurements
| PCOS (n = 59) | Obese (n = 33) | P Value | |
|---|---|---|---|
| Age, y | 15.7 ± 1.8 | 15.8 ± 1.4 | 0.86 |
| BMI percentile | 97.4 ± 2.3 | 96.8 ± 2.4 | 0.85 |
| Race/ethnicity, no. (%) | 0.01 | ||
| White | 32 (54.2) | 8 (24.2) | |
| Black | 6 (10.2) | 6 (18.2) | |
| Hispanic | 21 (35.6) | 19 (57.6) | |
| HbA1c, % | 5.4 ± 0.3 | 5.3 ± 0.3 | 0.23 |
| Fasting insulin, pmol/L | 19.6 ± 11.5 | 12.4 ± 5.5 | 0.001 |
| Fasting glucose, mg/dL | 90.9 ± 7.3 | 88.5 ± 5.3 | 0.13 |
| HOMA-IR, n = 46 | 4.3 ± 2.6 | 2.8 ± 1.2 | 0.001 |
| Matsuda Index | 2.3 ± 1.5 | 3.4 ± 1.7 | 0.002 |
| Free testosterone, ng/dL | 7.8 ± 4.9 | 3.9 ± 2.1 | <0.001 |
| CASQ total score | 36.6 ± 8.3 | 35.0 ± 8.9 | 0.38 |
| SDSC | 0.82 | ||
| Disorders subscale score | 58.1 ± 13.4 | 57.4 ± 11.0 | |
| Apnea-hypopnea index, n = 30 | 8.1 ± 2.1 | 2.0 ± 0.8 | 0.01 |
Data are shown as mean ± SD unless otherwise noted.
Actigraphy results revealed insufficient sleep in both the PCOS and control groups on weekdays and weekends, compared with the 8 to 10 hours per night recommended for this age group (55) (Table 2). Bedtime and waketime were significantly later on weekends compared with weekdays for both the PCOS and control groups (all P < 0.01). For the control group, total sleep time was significantly longer (P = 0.001) and wake after sleep onset higher (P = 0.003) on weekends vs weekdays. For the PCOS group, sleep efficiency was significantly higher on weekends vs weekdays (P = 0.04). Girls with PCOS had significantly longer weekday sleep-onset latency (P = 0.02) and lower weekday sleep efficiency (P = 0.04) compared with the control group. There was a nonsignificant trend for the PCOS group to have later weekday waketime (P = 0.05) compared with control subjects.
Actigraphy Estimated Sleep Variables
| PCOS Group (n = 58) | Control Group (n = 32) | |||
|---|---|---|---|---|
| Weekday | Weekend | Weekday | Weekend | |
| Total sleep time, h | 7.1 ± 1.0 | 7.4 ± 1.4 | 6.9 ± 1.0 | 7.8 ± 1.0 |
| Onset latency, min | 18.5 ± 15.8a | 15.6 ± 16.0 | 12.7 ± 8.3a | 12.1 ± 13.1 |
| Sleep efficiency, % | 81.3 ± 7.1a | 83.4 ± 6.7 | 84.1 ± 5.3a | 83.1 ± 6.0 |
| WASO, min | 66.2 ± 29.0 | 63.9 ± 31.8 | 58.80 ± 21.87 | 75.2 ± 42.5 |
| Bedtime (earliest, latest) | 11:02 pm (7:04 pm, 2:45 am) | 11:54 pm (8:50 pm, 4:45 am) | 10:59 pm (8:55 pm, 1:31 am) | 11:43 pm (8:31 pm, 2:38 am) |
| Waketime (earliest, latest) | 7:43 am (5:20 am, 11:50 am) | 8:51 am (5:34 am, 2:40 pm) | 7:06 am (5:18 am, 10:48 am) | 9:08 am (5:50 am, 12:14 pm) |
Data are shown as mean ± SD unless otherwise noted.
Abbreviation: WASO, wake after sleep onset.
Between-groups differences for sleep variables on weekdays, P < 0.05.
Circadian rhythm in girls with PCOS and control subjects
Melatonin concentrations by group and results of the piecewise linear mixed-effects model are illustrated in Fig. 1, which shows hourly sampling during waking hours from 7 pm to 12 pm the following day, with hourly overnight sampling for the CIRC cohort only (i.e., control subjects only). Melatonin concentrations significantly increased from 7 pm to midnight and decreased from midnight to 12 pm, as expected. The overall change in the trajectory of melatonin concentration was significant different between groups (β = −5.63; P < 0.001), due to significantly higher melatonin concentration in the PCOS group compared with control subjects. The trajectory of melatonin concentration increase from 7 pm to midnight was significantly different for the PCOS group compared with the control group, with significantly higher increases for PCOS participants compared with control subjects (9.06vs 4.89 pg/mL, respectively; β = 4.17; P < 0.001). Similarly, there was a significant difference in trajectory of melatonin decrease from midnight to 12 pm, with melatonin concentration in the PCOS group decreasing by −3.55 pg/mL compared with −2.08 pg/mL in the obese control subjects (β = −1.46; P < 0.001).
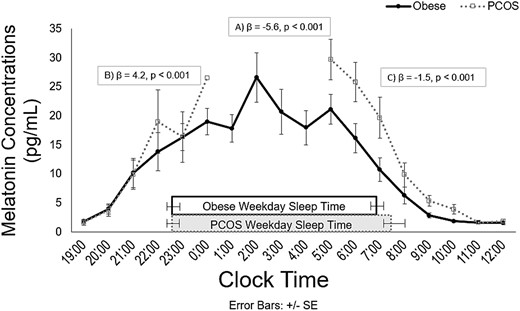
Salivary melatonin concentrations by clock time for PCOS (open squares, dotted line) and control subjects (black circles, solid line). Rectangles represent actual sleep times for each group. Results from a piecewise linear mixed-effects model examining differences in melatonin values between groups over time show that (A) the overall change in trajectory of melatonin concentration was significantly different between groups; (B) the trajectory of melatonin increase from 7 pm to midnight was significantly higher for the PCOS group than the control group; and (C) the trajectory of melatonin concentration decrease from midnight to 12 pm was significantly higher for the PCOS group compared with the control group. Serial saliva sampling was conducted every 60 minutes during waking hours from 7 pm to 12 pm the following day; in addition, the CIRC cohort (i.e., obese control subjects only) underwent hourly sampling overnight. Thus, values from 1 am to 4 am are not present in the figure for the PCOS group. Because PCOS participants were not woken to provide samples, only one participant with PCOS contributed a saliva sample at midnight; hence, the lack of error bars at this time point. The number of participants with samples at each time point ranged from one to 25 in the PCOS group and 11 to 25 in the control group.
Girls with PCOS had significantly later DLMOff times than did control subjects (P = 0.001) but no significant differences in DLMOn time (Table 3). The PCOS group also demonstrated a wider PA between bedtime and DLMOff (P = 0.002) and longer duration of melatonin secretion (P = 0.004) compared with control subjects. Melatonin timing and sleep timing relationships are summarized in Fig. 2. The relationship between sleep timing (i.e., bedtime and wake time) and DLMOff was shifted later in girls with PCOS compared with control subjects (bedtime, P = 0.001; wake time, P = 0.003), but the relationship between sleep timing and DLMOn did not differ significantly between groups. Interactions between sleep timing and group were not significant.
Dim-Light Melatonin Measurements
| PCOS Group (n = 25) | Control Group (n = 25) | P Valuea | |
|---|---|---|---|
| DLMOn | 8:18 pm ± 0.9 h | 8:24 pm ± 1.2 h | 0.64 |
| DLMOff | 9:30 am ± 1.5 h | 8:12 am ± 1.0 h | 0.001 |
| PA DLMOn and bedtime, h | 2.6 ± 1.4 | 2.4 ± 1.3 | 0.77 |
| PA DLMOn and waketime, h | 11.0 ± 1.7 | 10.6 ± 1.6 | 0.42 |
| PA bedtime and DLMOff, h | −10.7 ± 1.9 | −9.3 ± 1.0 | 0.002 |
| PA waketime and DLMOff, h | −1.8 ± 1.8 | −1.1 ± 1.1 | 0.09 |
| Duration of melatonin secretion, h | 13.1 ± 1.5 | 11.5 ± 1.4 | 0.004 |
Data are shown as mean ± SD unless otherwise noted.
P value indicates significant differences between groups.
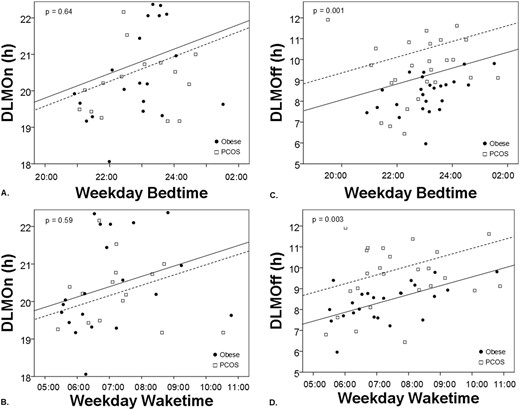
PCOS status is associated with morning circadian misalignment. Analysis of covariance shows that the relationship between DLMOn and sleep timing measured by (A) bedtime and (B) wake time does not differ between PCOS (open squares, dotted line) and control subjects (black circles, solid line). By contrast, DLMOff is later relative to sleep timing measured by (C) bedtime and (D) waketime in PCOS compared with obese control subjects. P values indicate significance of differences between groups.
Melatonin and free testosterone levels and SI
Linear regressions revealed significant relationships between free testosterone levels with DLMOff clock hour (β = 0.44; 95% CI, 0.65 to 2.48; P = 0.001), PA between bedtime and DLMOff (β = −0.40; 95% CI, −2.04 to −0.41; P = 0.004), PA between waketime and DLMOff (β = −0.39; 95% CI, −2.12 to −0.37; P = 0.006), and duration of melatonin secretion (β = 0.31; 95% CI, 0.43 to 2.50; P = 0.001). Specifically, later DLMOff, wider PAs between bedtime and DLMOff (likely reflecting increase in duration of the biological night) and waketime and DLMOff [reflecting melatonin secretion continuing longer after wake time; i.e., morning circadian misalignment (33)], and longer duration of melatonin secretion were all associated with higher levels of free testosterone (Fig. 3).
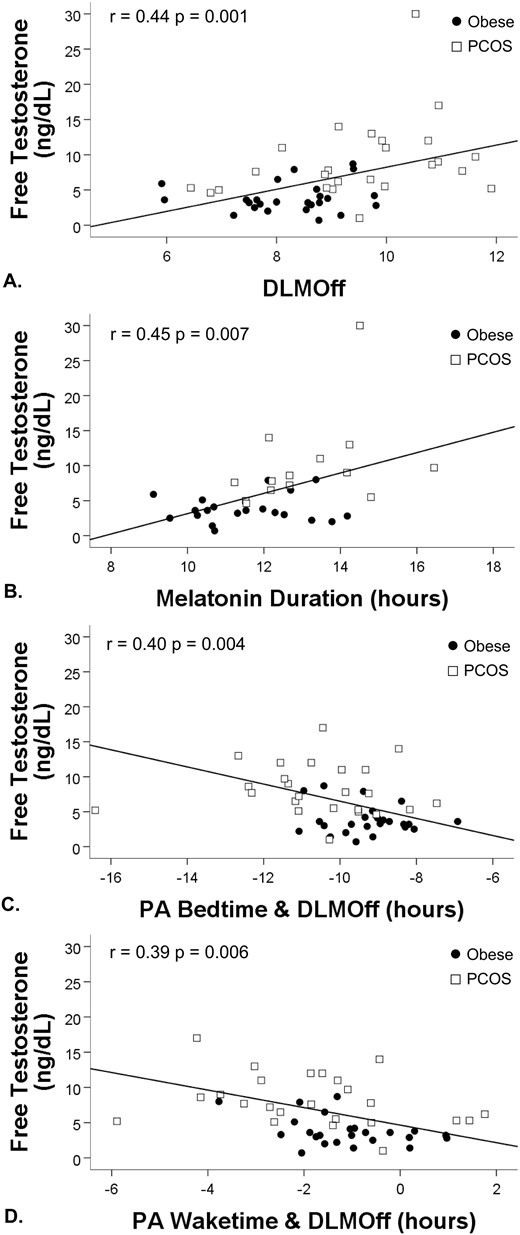
Regression analyses for melatonin variables and free testosterone. (A) Later DLMOff, (B) longer duration of melatonin secretion, (C) wider PA between bedtime and DLMOff (indicating longer sleep duration during the biological night), and (D) waketime and DLMOff (indicating melatonin secretion continuing after wake time) were associated with higher concentrations of free testosterone.
Wider PA between waketime and DLMOff was significantly associated with worse SI as measured by HOMA-IR (β = −0.36; 95% CI, −0.85 to −0.11; P = 0.01; Fig. 4). After controlling for PCOS status, only the relationships between waketime and DLMOff with free testosterone (β = −0.28; 95% CI, −0.73 to −0.11; P = 0.02) and HOMA-IR (β = −0.33, 95% CI, −0.80 to −0.06; P = 0.02) remained significant, indicating these relationships were independent of PCOS status; all other relationships were attenuated after controlling for PCOS status. Relationships between Matsuda Index and melatonin variables were nonsignificant. Results did not change after controlling for questionnaire-assessed daytime sleepiness.
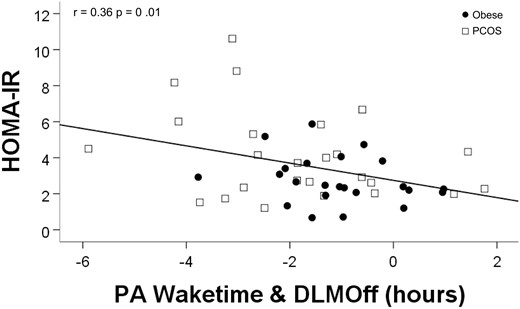
Regression analyses for melatonin and SI. Wider PA between waketime and DLMOff (indicating melatonin secretion continuing after wake time) was associated with worse SI as measured by higher HOMA-IR.
Discussion
Girls with PCOS in our sample had later morning melatonin offset timing relative to both clock time and sleep timing, as well as longer duration of melatonin secretion compared with control subjects with regular menses and of similar age, activity levels, and BMI. Moreover, melatonin variables were significantly positively correlated with serum testosterone concentrations and HOMA-IR. These findings add data from adolescents to the literature demonstrating that women with PCOS have poorer sleep health than their healthy peers (34, 35) and that sleep and circadian rhythm are associated with SI in adolescent PCOS, as they are in other populations (26–28, 30–33).
Our finding that a wider PA between waketime and DLMOff was associated with higher free testosterone levels and HOMA-IR are consistent with the extant literature in healthy adults showing worsening SI the longer melatonin levels remain high after wake time (33) and acute negative effects of melatonin on IR (56). This is particularly salient for adolescents, because typically early high school start times may result in adolescents waking during the biological night on school days when endogenous melatonin levels are still high. Although we cannot infer causality, due to the cross-sectional nature of our data, our findings are consistent with the causal effect of circadian misalignment on SI identified in previous experimental studies in adults (26–28, 30–33). Therefore, our findings suggest that environmental factors that increase the PA between markers of sleep timing and DLMOff, such as early school start times, may negatively impact metabolic health. After controlling for PCOS status, only waketime and DLMOff PA were associated with free testosterone levels and HOMA-IR, indicating that girls with PCOS who have later melatonin DLMOff and longer melatonin duration may be particularly vulnerable to these environmental effects.
Authors of previous studies have suggested that PCOS is related to IR by postreceptor defects in the insulin signal transduction cascade between the receptor kinase and glucose transport (57, 58) and have hypothesized that the elevated melatonin levels found in adult women with PCOS may contribute to peripheral tissue SI (59). Melatonin may affect insulin as a protective mechanism against hypoglycemia during sleep, a period with high melatonin levels and low metabolic demands (60). Furthermore, animal models show that melatonin supplementation results in reduced body weight, improved lipid profile, normal glucose tolerance, and improved maturation of oocytes, though it is important to note that, by contrast with humans, melatonin levels are high during the active phase in nocturnal animals when most food consumption occurs (61, 62). In adult women, 6 months of exogenous oral melatonin treatment at bedtime resulted in significantly decreased androgens levels, including testosterone; increased FSH levels; and restoration of regular menses in 95% of participants, though it is unclear whether this was due to changes in circadian timing or the direct effect of the melatonin supplement (63). Given our current findings, additional research investigating whether melatonin has similar effects in adolescents is imperative. In addition, the physiologic process underlying the relationship between melatonin and SI requires further study.
In this study, we examined circadian rhythm and SI in adolescents with PCOS and obesity, using rigorous objective measurements of melatonin to assess circadian rhythm and actigraphy to obtain estimates of sleep duration and timing. Furthermore, we controlled for many confounding variables, such as physical activity levels, weight status, and menstrual cycle, which may have enhanced our ability to detect associations between circadian health and SI. However, the current findings should be evaluated in the context of study limitations, including that polysomnography to assess obstructive sleep apnea (OSA) was only able to be conducted in a subset of participants. Because girls with obesity and PCOS are at increased risk of OSA and OSA is itself significantly associated with IR (64–66), OSA status is important to assess. However, neither questionnaire-assessed symptoms of sleep-disordered breathing nor apnea-hypopnea index were significantly associated with SI or melatonin variables in our sample. Nonetheless, objectively evaluating for OSA in future research involving girls with obesity and PCOS is recommended. Moreover, the data presented are a compilation from two studies, and although these protocols had only minor differences, it is nonetheless possible that methodological differences affected results.
Work is needed to expand on these findings, investigate the physiological mechanisms involved, and assess the potential for relevant therapeutic targets. The use of more rigorous stimulated measures of SI or secretion, such as the IV glucose tolerance test or hyperinsulinemic-euglycemic clamp, may provide more sensitive and/or tissue-specific measures of SI. In addition, experimental manipulation of circadian timing would elucidate causal mechanisms behind the relationship between circadian timing and SI in girls with PCOS. Clinicians working with girls with PCOS should consider including assessment and treatment of sleep and circadian health in their routine care.
In summary, we found that adolescent girls with PCOS had later morning melatonin offset timing relative to both clock time and sleep timing as well as longer duration of melatonin secretion compared control subjects with regular menses and of similar age, activity levels, and BMI. In addition, melatonin variables were significantly positively correlated with serum testosterone concentrations and HOMA-IR. Coupled with the puberty-associated delay in circadian rhythm and typically early high school start times, adolescent girls may be at particularly high risk. Given the increasing prevalence of PCOS in the adolescent population and the high rates of delayed circadian rhythm and insufficient sleep among adolescents, additional research on sleep and circadian rhythm and their relation to health outcomes is needed in adolescent girls with PCOS.
Acknowledgments
Financial Support: This research was supported by the University of Colorado Denver Center for Women’s Health Research Pilot Award (to S.L.S.); Children’s Hospital Colorado and Colorado School of Mines Collaborative Pilot Award (to S.L.S. and C.D.B.); National Institute of Diabetes and Digestive and Kidney Diseases (Grants K12HD057022 and K23DK107871 to M.C.-G.); Doris Duke Foundation Caregivers Fellowship (Grant 2015212 to M.C.-G.); Boettcher Webb-Waring Biomedical Research Award (to M.C.-G.); and Colorado Clinical and Translational Science Award (UL1TR002535). The funding sources had no involvement in study design, collection, analysis, and interpretation of data; the writing of this report; or the decision to submit the paper for publication.
Clinical Trial Information: ClinicalTrials.gov no. NCT02157974 (registered 6 June 2014) and NCT02585830 (registered 23 October 2015).
Author Contributions: S.L.S., C.D.B., K.J.N., and M.C.-G., designed the study. S.L.S., H.R., Y.G-R., and M.C.-G. collected and assembled the data. S.L.S., C.D.B., K.M.B., J.L.K., and L.P. analyzed data and performed statistical analyses. S.L.S., C.D.B., K.P.W., and M.C-G. interpreted the results. S.L.S. and L.M. wrote the manuscript. All authors reviewed and critiqued the manuscript, contributed to revisions, and approved the final manuscript.
Disclosure Summary: C.D.B. has received research funding from Jazz Pharmaceuticals. K.P.W. has received research support from Somalogics, consulting fees from, or served as a paid member of scientific advisory boards for, the Sleep Disorders Research Advisory Board of the National Heart, Lung and Blood Institute, CurAegis Technologies, and Circadian Therapeutics; and has received speaker/educational consultant honoraria or travel reimbursement fees from the American Academy of Sleep Medicine, American College of Chest Physicians, American College of Sports Medicine, American Diabetes Association, Associated Professional Sleep Societies, and the Sleep Research Society. The remaining authors have nothing to disclose.
Abbreviations:
- APPLE
Liver and Fat Regulation in Overweight Adolescent Girls
- BMI
body mass index
- CASQ
Cleveland Adolescent Sleepiness Questionnaire
- CIRC
Sleep Timing and Insulin Resistance in Adolescents with Obesity
- DLMOff
dim-light melatonin offset
- DLMOn
dim-light melatonin onset
- HOMA-IR
Homeostatic Model Assessment of Insulin Resistance
- IR
insulin resistance
- OSA
obstructive sleep apnea
- OSTT
oral sugar tolerance test
- PA
phase angle
- PCOS
polycystic ovarian syndrome
- SCN
suprachiasmatic nucleus
- SDSC
Sleep Disturbances Scale for Children
