


Abstract
The consumption of high-fructose beverages is associated with a higher risk for obesity and diabetes. Fructose can stimulate glucagon-like peptide 1 (GLP-1) secretion in lean adults, in the absence of any anorexic effect.
We hypothesized that the ingestion of glucose and fructose may differentially stimulate GLP-1 and insulin response in lean adolescents and adolescents with obesity.
We studied 14 lean adolescents [four females; 15.9 ± 1.6 years of age; body mass index (BMI), 21.8 ± 2.2 kg/m2] and 23 adolescents with obesity (five females; 15.1 ± 1.6 years of age; BMI, 34.5 ± 4.6 kg/m2). Participants underwent a baseline oral glucose tolerance test to determine their glucose tolerance and estimate insulin sensitivity and β-cell function [oral disposition index (oDIcpep)]. Eligible subjects received, in a double-blind, crossover design, 75 g of glucose or fructose. Plasma was obtained every 10 minutes for 60 minutes for the measures of glucose, insulin, and GLP-1 (radioimmunoassay) and glucose-dependent insulinotropic polypeptide (GIP; ELISA). Incremental glucose and hormone levels were compared between lean individuals and those with obesity by a linear mixed model. The relationship between GLP-1 increment and oDIcpep was evaluated by regression analysis.
Following the fructose challenge, plasma glucose excursions were similar in both groups, yet the adolescents with obesity exhibited a greater insulin (P < 0.001) and GLP-1 (P < 0.001) increase than did their lean peers. Changes in GIP were similar in both groups. After glucose ingestion, the GLP-1 response (P < 0.001) was higher in the lean group. The GLP-1 increment during 60 minutes from fructose drink was correlated with a lower oDIcpep (r2 = 0.22, P = 0.009).
Fructose, but not glucose, ingestion elicits a higher GLP-1 and insulin response in adolescents with obesity than in lean adolescents. Fructose consumption may contribute to the hyperinsulinemic phenotype of adolescent obesity through a GLP-1–mediated mechanism.
The rise in fructose consumption during the past two decades is a major change in US dietary intake, which has paralleled the unabated obesity epidemic in youths (1, 2). The use of fructose as a sweetener has exponentially increased, either as simple sugar (sucrose) or in the form of high-fructose corn syrup, and fructose intake now accounts for ∼15% of the daily caloric intake of US adolescents (3). Consumption of fructose and sugar-sweetened beverages has been associated with obesity in both adults and youths (4), and two large randomized clinical trials have proven that the blinded replacement of sugar-sweetened beverages with noncaloric drinks for 12 months reduces body weight in adolescents and minimizes weight gain in children (5, 6).
Fructose does not directly stimulate insulin secretion, owing to the lack of the fructose specific-transporter GLUT-5 on β-cells (7, 8) and to the limited glycemic excursion following ingestion. However, the mechanism by which oral, but not IV, fructose consumption causes a weak rise in insulin secretion has been described in healthy nonobese adults. Oral fructose consumption is detected by the GLUT-5–containing L-cells in the gut (7, 9), which are responsible for the mild increase in glucagon-like peptide 1 (GLP-1) following fructose ingestion (7, 9).
In contrast to glucose ingestion, oral fructose load does not inhibit food-seeking behavior (10) or impact orexigenic hormones such as ghrelin (11) and its active form, acyl-ghrelin (12). Furthermore, the lack of suppression of orexigenic hormones is more pronounced in youths with obesity than in lean peers after an oral fructose load (12), suggesting that obesity itself can enhance the obesogenic metabolic effect of fructose. Multiple mechanisms have been called to sustain the role of fructose in the obesity epidemic (13–17), including its direct effect as a promoter of de novo hepatic lipogenesis (18–21), that may in turn contribute to lower hepatic insulin sensitivity and to liver fat deposition.
We hypothesized that fructose may determine a differential insulin response after oral ingestion in lean adolescents and in adolescents who are obese with normal glucose tolerance through an incretin-mediated mechanism.
Materials and Methods
Participants
We studied 14 lean adolescents and 23 adolescents with obesity recruited from the Yale Pediatric Obesity Clinic and the community (12). Participants were matched for age, sex, pubertal development, ethnicity, and metabolic parameters, including fasting and 2-hour glucose. Youths with diabetes, impaired glucose tolerance, or impaired fasting glucose, as well as those taking any medication affecting glucose metabolism, were excluded. Abnormal renal function, pregnancy, endocrinopathies, chronic illness, psychiatric disorders, substance abuse, or the use of anorexic agents were additional exclusion criteria. Eligible participants were divided into a lean group [body mass index (BMI) >25th to <75th percentile] and a group with obesity (BMI >95th percentile).
This cohort was previously described in a parent study (NCT01808846) that sought to assess acyl-ghrelin and peptide YY responses to glucose and fructose ingestion in lean adolescents and in adolescents who are obese (12). Four subjects from the original cohort were excluded because of the lack of GLP-1 samples at all time points. The original cohort and the current one did not differ with respect to anthropometric and metabolic features.
Study procedures
Eligible subjects underwent an oral glucose tolerance test (OGTT) as previously described (12) to assess glucose tolerance and to estimate surrogate measures of insulin sensitivity and secretion, followed by two admissions, in a double-blind, crossover manner, during which participants drank 75 g of either a glucose or fructose drink in a random order, a minimum of 13 days apart. Anthropometric measures included height, weight, and BMI measured by a body fat analyzer (TBF 300, Tanita, Arlington Heights, IL). The study was approved by the Yale University Human Investigation Committee. Subjects provided assent and parents provided written informed consent to participate in the study. During the three admissions participants received glucose (3-hour OGTT and 1-hour glucose study day) or a fructose drink. The glucose or fructose content was dissolved in 300 mL of cherry flavored water. The 75 g of glucose was an appropriate dose for all subjects based on OGTT standards per body weight. During the OGTT, blood samples were obtained every 30 minutes for 180 minutes for the measurement of plasma glucose, insulin, and C-peptide. During the two 1-hour admissions for the glucose or fructose drink, blood samples were collected at baseline (−20 and 0 minutes) and every 10 minutes for 60 minutes to measure glucose, insulin, GLP-1, and glucose-dependent insulinotropic polypeptide (GIP). Prior to each of the three admissions, all subjects followed a weight-maintenance diet consisting of at least 250 g of carbohydrates per day for 7 days before the study.
The insulinogenic index (IGIcpep), the whole-body insulin sensitivity index (WBISI), and the oral disposition index (oDIcpep) were computed on the 3-hour OGTT performed prior to the two admissions as follows: IGIcpep, that is, the change (Δ) in C-peptide (0 to 30 minutes)/Δglucose (0 to 30 minutes), was calculated as a surrogate measure of the acute insulin response (22, 23); the whole-body insulin sensitivity index (WBISI), that is 10,000 divided by the square root of [(fasting glucose × fasting insulin) × (mean glucose × mean insulin)], was calculated as a measure of insulin sensitivity as previously described (24); and oDIcpep was the product of WBISI and IGIcpep, with a lower oDIcpep indicating a reduced β-cell function in the context of ambient insulin sensitivity (24). We adopted the C-peptide–based index to minimize the effect of the differential insulin clearance described in some of the ethnic groups enrolled in our study (25), as recently described by the Restoring Insulin Secretion study (26).
Assays
Plasma glucose was analyzed using the YSI 2700 STAT Plus glucose analyzer (YSI Life Sciences, Yellow Springs, OH). Plasma insulin was measured by radioimmunoassay (Linco Research, St. Charles, MO). Plasma C-peptide levels were determined by ELISA using immunoassays from ALPCO (Salem, NH). Total GLP-1 was measured by RIA (EMD Millipore, Billerica, MA). The assay used an antibody specific to GLP-1(7–36) and GLP-1(9–36) with no cross-reactivity with GLP-2, GIP, glucagon, or oxyntomodulin. Intra-assay and interassay variability were <5% and <12%, respectively. GIP was tested by ELISA (EMD Millipore) with 8.2 pg/mL sensitivity and 1.8% to 6.1% and 3.0% to 8.8% intra-assay and interassay variability, respectively.
Statistical analysis
Comparisons were conducted between a lean group and a group with obesity. The primary outcome was the change from baseline in total GLP-1 during the 60 minutes following the fructose drink. Changes in plasma glucose, insulin, GLP-1, and GIP were expressed as incremental values from baseline (average value of −20 and 0 minutes) to the specified time points. The use of an incremental increase above baseline for the tested hormones aimed to minimize the baseline variation between the lean cohort and the cohort with obesity that could have biased the observed effect of fructose or glucose. Distribution of continuous variables was examined for skewness, and variables were logarithmically transformed when appropriate.
The 60-minute trajectories of (Δ)glucose, (Δ)insulin, (Δ)GLP-1, and (Δ)GIP were compared between lean individuals and individuals with obesity using linear mixed effects modeling, for the glucose and the fructose test, and the difference between lean individuals and individuals with obesity (ΔL-Ob) was expressed as mean differenceSD, with negative values consistent with higher levels in the group with obesity. The linear mixed model analysis was adopted to estimate the effect of the BMI group (lean or obese) on the glucose profile and the hormone change. Fixed effects in the model included BMI category (lean or obese), time (10, 20, 30, 40, 50, and 60 minutes after drinking), and their interaction. The main effect of the BMI group was analyzed separately for each drink (fructose and glucose). The incremental area under the curve (iAUC) was calculated for glucose, insulin, GLP-1, and GIP. Multivariate regression analysis of the effect of increment of GLP-1 from baseline at 10, 30, and 60 minutes after a glucose (ΔGLP-110, 30, or 60-glu) and fructose (ΔGLP-110, 30. or 60-fru) drink on the continuous outcome oDIcpep was performed on the full cohort, selecting the following adjustment variables based on the published literature (27, 28): sex, age, BMI, pubertal stage (Tanner stage), fasting and 2-hour glucose, and ethnicity (non-Hispanic white, non-Hispanic black, and Hispanic) (27, 29, 30). Multivariate regression analysis was therefore adopted to test the effect of incremental GLP-1 over the baseline value at 60 minutes on the insulin increase, at the same time point, for the fructose drink in the two groups, adjusted for sex, age, and 2-hour glucose.
Prior to including the covariates into the models, we examined them for multicollinearity and we excluded variables with a significance >0.85 when individually tested against the continuous outcome of the model.
Statistical significance for the parameter estimate was established with α of <0.05. Continuous variables were expressed as mean ± SD, unless otherwise specified. Data were analyzed using Stata 13 software (StataCorp, College Station, TX) and GraphPad Prism 8 software (GraphPad Software, La Jolla, CA).
Results
Participants
Clinical and metabolic characteristics of lean subjects and subjects with obesity are described in Table 1. The lean group and group with obesity were similar for age, sex, pubertal stage, ethnic background, fasting, and 2-hour glucose, whereas, as per the study design, the group with obesity had a higher BMI (P < 0.001) and lower insulin sensitivity (WBISI, P = 0.004), as well as a reduced oDIcpep (P = 0.020).
Baseline Characteristics of Participants
| Lean (n = 14) | Obese (n = 23) | P | |
|---|---|---|---|
| Sex (female) | 4 (28) | 13 (26) | 0.621 |
| Age, y | 15.4 (14.7, 16.8) | 15.6 (14.1, 16.6) | 0.899 |
| BMI, kg/m2 | 22 (20.4, 23.4) | 33.7 (32.2, 37.4) | <0.001 |
| HbA1c, % | 5.6 (5.2, 5.6) | 5.6 (5.3, 5.7) | 0.411 |
| HbA1c, mmol/mol | 39 (33, 38) | 39 (34, 39) | |
| Ethnicity (NHW/NHB/H) | 5/4/5 | 6/8/7 | 0.629 |
| Tanner stage | 0.898 | ||
| II–III | 5 (36) | 10 (43) | |
| IV–V | 9 (64) | 13 (57) | |
| Fasting glucose, mg/dL | 82.5 (79.5, 91.5) | 87.5 (85, 89.5) | 0.410 |
| 2-Hour glucose (mg/dL) | 106 (92, 113) | 102.5 (93, 123) | 0.872 |
| WBISI, (dL × mL−1)/(mg × μIU−1) | 3.1 (2.4, 4.7) | 1.3 (0.94, 3.4) | 0.004 |
| IGIcpep, pmol/mL−2 × mg | 60.7 (28.8, 83.0) | 44.8 (24.02, 63.3) | 0.247 |
| oDIcpep | 12.9 (7.3, 19.6) | 5.0 (1.6, 7.6) | 0.020 |
Data are median (25th percentile, 75th percentile). Boldface indicates P values < 0.05.
Abbreviations: H, Hispanic; NHB, non-Hispanic black; NHW, non-Hispanic white.
Glucose, insulin, and incretin trajectories after glucose or fructose drink
Baseline levels of plasma glucose, GLP-1, and GIP were not different between lean individuals and individuals with obesity prior to the two drinks, whereas baseline insulin levels were higher in the group with obesity than in the lean group (P < 0.001) during both conditions (Table 2).
Glucose, Insulin, GLP-1, and GIP After Fructose or Glucose Drink
| Lean (n = 14) | Obese (n = 23) | P | |
|---|---|---|---|
| Fructose drink | |||
| Baseline glucose, mg/dL | 88.5 ± 0.87 | 92.0 ± 5.5 | 0.112 |
| Incremental peak glucose, mg/dL | 12.3 ± 8.3 | 6.8 ± 3.5 | <0.001 |
| iAUC glucose, mg/dL⋅min | 7472 ± 185.6 | 7468 ± 134.2 | 0.986 |
| Baseline insulin, μU/mL | 14.6 ± 6.7 | 34.2 ± 17.3 | <0.001 |
| Incremental peak insulin, μU/mL | 37.6 ± 17.9 | 67.0 ± 31.5 | 0.003 |
| iAUC insulin, μU/mL⋅min | 796.1 ± 188.0 | 1001 ± 164.3 | <0.001 |
| Baseline GLP-1, pmol/L | 1.49 ± 2.1 | 4.1 ± 6.3 | 0.185 |
| Incremental peak GLP-1, pmol/L | 1.0 ± 0.7 | 5.2 ± 6.8 | 0.028 |
| iAUC GLP-1, pmol/L⋅min | 21.0 ± 9.1 | 253.1 ± 105.7 | <0.001 |
| Baseline GIP, pmol/L | 65.7 ± 31.0 | 59.3 ± 26.2 | 0.505 |
| Incremental peak GIP, pmol/L⋅min | 102.3 ± 95.5 | 75.7 ± 52.1 | 0.279 |
| iAUC GIP, pmol/L⋅min | 2415 ± 1606 | 1840 ± 666.4 | 0.136 |
| Glucose drink | |||
| Baseline glucose, mg/dL | 86.9 ± 5.4 | 91.4 ± 6.3 | 0.194 |
| Incremental peak glucose, mg/dL | 60.1 ± 26.7 | 52.7 ± 17.9 | 0.319 |
| iAUC glucose, mg/dL⋅min | 9231 ± 447.1 | 8689 ± 436.9 | 0.417 |
| Baseline insulin, μU/mL | 14.5 ± 6.0 | 33.5 ± 16.6 | <0.001 |
| Incremental peak insulin, μU/mL | 162.5 ± 124.1 | 232.7 ± 106.3 | 0.040 |
| iAUC insulin, μU/mL⋅min | 5750 ± 1302 | 9275 ± 1597 | <0.001 |
| Baseline GLP-1, pmol/L | 1.38 ± 2.1 | 3.98 ± 6.8 | 0.194 |
| Incremental peak GLP-1, pmol/L | 3.8 ± 2.8 | 1.8 ± 1.6 | 0.009 |
| iAUC GLP-1, pmol/L⋅min | 95.6 ± 38.4 | 24.6 ± 25 | <0.001 |
| Baseline GIP, pmol/L | 92.1 ± 47.7 | 92.0 ± 47.6 | 0.999 |
| Incremental peak GIP, pmol/L⋅min | 176.8 ± 107.8 | 217.8 146.8 | 0.995 |
| iAUC GIP, pmol/L⋅min | 6808 ± 1979 | 8396 ± 2034 | 0.026 |
Data are presented as mean ± SD. Incremental values are calculated as the difference from baseline. Boldface indicates P values < 0.05.
Fructose ingestion caused a similar slope in plasma glucose in lean individuals and in individuals with obesity (mean ΔL-Ob, 0.9 ± 2.2 mg/dL; P = 0.699), although the rise in insulin and GLP-1 from baseline was significantly greater in the group with obesity than in the lean group (ΔL-Ob, −22.3 ± 6.4 mg/dL, P = 0.002 for insulin and −3.6 ± 1.6, P = 0.030 for GLP-1) (Fig. 1). Therefore, the iAUC for GLP-1 during the 60 minutes was markedly greater in the participants with obesity than in the lean participants after the fructose drink (Table 1), whereas GIP change from baseline did not differ between the two groups (ΔL-Ob, −13.2 ± 19.2; P = 0.497; Fig. 1, left panels). The glucose peak was slightly, but significantly, higher (12.3 ± 8.3mg/dL, P < 0.001) in the lean group, consistent with the smaller increase in insulin levels during the 60 minutes after fructose ingestion. Insulin and GLP-1 incremental peak values from baseline were greater in adolescents with obesity than in lean adolescents (P = 0.003 and P = 0.028; Table 2) Consistent with these findings, a linear regression model demonstrated that the GLP-1 increase from baseline paralleled the insulin rise at 60 minutes (P = 0.045) in the group with obesity, but not in the lean group (P = 0.593), when adjusted for age, sex, and 2-hour glucose.
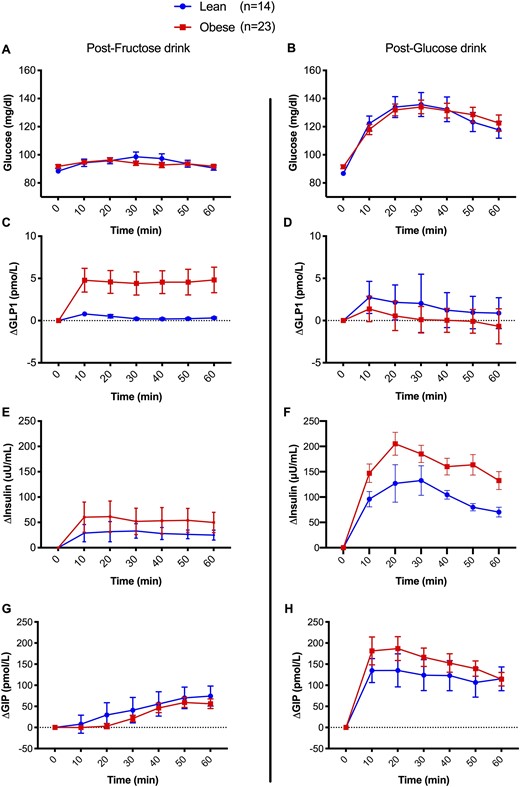
Glucose, insulin, GLP-1, and GIP incremental values after (A, C, E, G) fructose and (B, D, F, H) glucose drinks. Values are expressed as incremental mean ± SD from baseline.
After the glucose drink, despite similar plasma glucose levels (ΔL-Ob, −0.8 ± 6.1 mg/dL; P = 0.894) during the test, the cohort with obesity had a greater insulin rise from baseline (ΔL-Ob, −54.80 ± 21.10 pmol/L; P = 0.013), whereas, in contrast to fructose ingestion, the GLP-1 increase was more pronounced in the lean group (ΔL-Ob, +1.2 ± 0.5 pmol/L; P = 0.026; Fig. 1) with a higher peak over baseline (P < 0.001) and an approximately fourfold greater iAUC than did the cohort with obesity (Table 2). GIP changes from baseline were similar between lean participants and those with obesity (ΔL-Ob, −29.0 ± 31.5; P = 0.365; Fig. 1).
GLP-1 response and β-cell function (oDIcpep)
The GLP-1 increase after 60 minutes from glucose (ΔGLP-160-glu) and fructose (ΔGLP-160-fru) ingestion was tested against the β-cell function, as estimated by oDIcpep. The increase of GLP-1 at 60 minutes from the fructose drink, but not after the glucose ingestion, was associated with a decline in oDIcpep (r = 0.47 and P = 0.009 for ΔGLP-160-fru; r = 0.17 and P = 0.338 for ΔGLP-160-glu) (Fig. 2). This finding was confirmed when adjusted for age, BMI, fasting and 2-hour glucose, ethnicity, and baseline GLP-1 on the multivariate regression analysis. Per each picomole per liter of increase in ΔGLP-160-fru, we estimated a decline in oDIcpep (P = 0.024) in the absence of a significant effect for ΔGLP-160-glu on the disposition index. The increase in GLP-1 at 10 minutes after fructose challenge was also associated with a decrease in β-cell function (P = 0.008) as estimated by the oDIcpep during the baseline OGTT. Fasting glucose and BMI were negatively associated with oDIcpep (P = 0.011 and P = 0.005), as well as with the Hispanic ethnic background (P = 0.001).
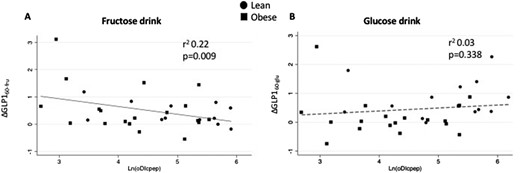
Linear regression plot of C-peptide–derived oDIcpep and change in GLP-1 from baseline at 60 min from (A) fructose or (B) glucose drink. Ln(DIcpep), natural logarithm of oDIcpep.
Discussion
This study describes, to our knowledge for the first time, that in adolescents with obesity and normal glucose tolerance, fructose, but not glucose, ingestion causes a rapid and sustained rise in circulating GLP-1 levels, ∼12-fold greater than in their lean peers (Fig. 1). Importantly, this was paralleled by a more robust rise in insulin (Fig. 1). The magnitude of the GLP-1 increase from baseline and during 1 hour in response to the fructose drink, in both lean adolescents and those with obesity (Fig. 2A), is independently associated with a blunted β-cell function (oDIcpep), a result not detected with the glucose drink. oDIcpep, measured during the baseline OGTT, is a robust estimate of β-cell function based on C-peptide and whole-body insulin sensitivity, representing an independent predictor of prediabetes and diabetes in both youths and adults (31–33).
In animal models, both a high-fructose diet (34–36) and obesity (36) have been associated with overexpression of the intestinal GLUT-5 transporter, which could justify the differential effect of fructose in adolescents with obesity and those who are lean on GLP-1 secretion. GLUT-5 mRNA was found to be fourfold higher in duodenal biopsies from adults with type 2 diabetes than for their healthy peers (37), suggesting that the luminal expression of GLUT-5 could represent one of the mechanisms driving the incretin hyperresponsiveness to oral fructose in youths who are obese (Fig. 3). Future studies should elucidate the individual effects of obesity and high-fructose diet on the enhanced incretin response of the adolescent group with obesity. The impact of regular consumption of fructose, as a main dietary component, may contribute to the hyperinsulinemic phenotype characteristic of obesity (38).
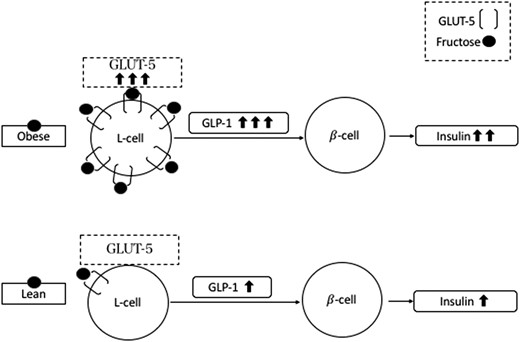
Hypothetic mechanism sustaining the GLP-1 response observed in subjects with obesity and in lean subjects after fructose drink.
The purpose of this study was to investigate the individual effects of the two monosaccharides on the insulin and incretin response in subjects with obesity and in lean subjects. Accordingly, this is also a limitation because fructose is rarely used as a standalone sugar, but it is often consumed with glucose, as sucrose or high-fructose corn syrup. Resultant effects may differ from the observations in this experimental setting (12). However, owing to the limited number of in vivo dynamic studies in humans, we preferred this two-arm study design to compare glucose and fructose response in lean youths and youths with obesity as a first step.
In healthy nonobese adults fructose did not exhibit a differential effect on the GLP-1 response as compared with the glucose oral load (39), whereas hyperinsulinemia has been reported after fructose oral challenge in adults with T2D as compared with nondiabetic peers, in the absence of a differential effect on the GLP-1 response (40). Our findings fill a gap of knowledge in this field, as we explored the differential effect of fructose in nondiabetic youths with obesity and lean youths and depict the early effect of obesity on the incretin response to fructose in youths.
Therefore, we explored the relationship between GLP-1 response to fructose and β-cell function. We adopted the oDIcpep calculated during the OGTT to quantify β-cell function owing to its large use in pediatric studies and its robustness (28, 32, 41–45). The early GLP-1 release, at 10 minutes, and its persistent increase (60-minute assessment) were both correlated with a blunted oDIcpep, suggesting a role for both proximal duodenal and distal ileal L-cells in the fructose-mediated incretin effect (46).
A sustained increase in GLP-1 response has been described in nonobese healthy women after three high-fructose meals (11), which can be attributed to the distal L-cells in the absence of an increase in GIP levels during the same test (11). Indeed, proximal duodenal L-cells are responsible for a limited amount of the total GLP-1 secreted after a meal, with ileal and colon L-cells secreting most of the circulating incretins (47). Owing to the early rise in GLP-1 levels in our cohort, and its persistence throughout the 1-hour test, we can hypothesize that fructose may exert a primary luminal action in both proximal and distal L-cells. A reduced absorption of fructose in the proximal small intestine in the group with obesity could justify the prolonged GLP-1 response as a consequence of a greater percentage of the monosaccharide processed from the distal L-cells. In this manner, nonluminal signals, as cholinergic neurotransmission and orexigenic hormones, could be responsible for the early increase in GLP-1 levels of the cohort with obesity, and L-cell secretion is regulated by both cholinergic neural signals and hormones (48).
Alternatively, the clinical translation of these findings must take into account the pleiotropic effects of GLP-1 on insulin secretion and appetite (46). Indeed, nutrients can differentially modulate the anorexic effect of GLP-1. A high-fat diet, as well as fructose consumption, blocks the anorexic signal of insulin, leptin, and GLP-1 (49) by preventing the inhibition of the hypothalamic AMP-activated protein kinase pathway (49). As a consequence, the observed higher levels of GLP-1, after fructose ingestion, will fail to induce satiety in adolescents who are obese.
Previous findings from animal models and lean humans (7) demonstrated that fructose specifically causes GLP-1, but not GIP, secretion after oral ingestion. In the present study, we observed a modest increase in GIP levels after fructose ingestion, without a significant difference between lean individuals and those who are obese. The GIP increase after glucose ingestion was higher in the group with obesity, as previously described (50).
In healthy nonobese adolescents, oral glucose promptly raises plasma insulin levels by both a direct effect on the β-cell and also by an indirect action mediated by gut incretin secretion (GLP-1 and GIP). A defective incretin response to oral glucose has been described in adults with obesity in the absence of impaired glucose tolerance (51, 52). We have confirmed the previous finding (52, 53) of a weakened GLP-1 response to the glucose drink in youths who are obese. This phenomenon may be a consequence of blunted incretin secretion (54) or of reduced incretin responsiveness due to β-cell incretin resistance. The latter case has been described by higher GLP-1 levels in the absence of insulin elevation in adults carrying the risk allele for the TCF7L2 rs7903146 genotype (55). Furthermore, total GLP-1 can be differentially cleared by dipeptidyl peptidase type 4 (DPP-4) in individuals who are obese and in lean individuals, with the former likely to have the higher activity of the enzyme. DPP-4 converts total GLP-1 into the active form, and its activity is increased in the high fat–fed murine model of insulin resistance (56). The role of DPP-4 in modulating the incretin response to fructose requires further studies evaluating both total and active GLP-1.
Lastly, we depicted a new potential contributor to the hyperinsulinemic phenotype of youths who are obese. The clinical relevance of our findings is multifaceted. First, hyperinsulinemia has been suggested to have a pivotal role in β-cell failure and not being the mere consequence of lower insulin sensitivity in individuals who are obese (57, 58). Hyperinsulinemia is associated with a worsening in glucose tolerance independently from the insulin sensitivity (59). In a second instance, we proved that the GLP-1 response to fructose parallels the insulin increase in youths who are obese, calling for a role of this incretin in the hypersecretion phenotype of youths who are obese. As GLP-1 represents one of the most promising therapeutic options for diabetes, the role of incretins in determining hyperinsulinemia, and its potential harm in youths, should be carefully considered in future studies (58, 59).
Although we observed a consistent effect of fructose across the youths with obesity, the numerosity of this study is still a major limit to the generalizability of our findings, as other variables may play a role in the response to fructose, including the BMI, fasting and 2-h glucose, ethnic background, and specific genotypes associated with the incretin response (60).
As a consequence of the variability in the hormonal measurements, we did not perform subgroup analyses to investigate the role of insulin sensitivity within the group with obesity, as it would have required a larger sample size. We chose to measure total GLP-1, instead of its active form [i.e., GLP-1(7–36)], owing to the longer half-life of total GLP-1 and to avoid the confounding effect of adiposity on differential GLP-1 clearance (61), whose role was out of the scope of the current study.
In conclusion, we demonstrated that (i) obesity can differentially modulate the incretin response to specific nutrients, such as fructose and glucose; (ii) the incretin response to fructose negatively correlates with β-cell function (oDIcpep); and (iii) although the GLP-1 response is blunted after glucose challenge in youths who are obese, other nutrients, such as fructose, can still trigger a marked incretin response.
Fructose consumption and its effect on the incretin response may play a major role in the hyperinsulinemia characteristic of obesity in youths, and its long-term effects remain unexplored.
Acknowledgments
We are grateful to the patients who participated in this study and their families, and to the staff and nurses of the Yale Hospital Research Unit of the Yale Center for Clinical Investigation (funded in part by National Center for Advancing Translational Sciences Grant UL1-RR-024139) for their assistance with collecting serum samples, as well as the Yale Center for Clinical Investigation Core Laboratory for conducting the hormone assays.
Financial Support: This work was supported by National Institutes of Health/National Institute of Child Health and Human Development Grants R01-HD-40787, R01-HD-28016, and K24-HD-01464 to S.C.; National Institute of Diabetes and Digestive and Kidney Diseases Clinical and Translational Science Award Grant UL1-RR-0249139 from the National Center for Research Resources, a component of the National Institutes of Health; Distinguished Clinical Scientist Award from the American Diabetes Association (to S.C.); as well as the National Institute of Diabetes and Digestive and Kidney Diseases Grant R01-DK-111038 (to S.C.), the Robert E. Leet and Clara Guthrie Patterson Trust Mentored Research Award (to A.G.), the Pediatric Endocrine Society (to M.V.N.), and the European Society for Pediatric Endocrinology Long-term Research Fellowship (to C.G.).
Disclosure Summary: The authors have nothing to disclose.
Abbreviations:
- BMI
body mass index
- DPP-4
dipeptidyl peptidase type 4
- GIP
glucose-dependent insulinotropic polypeptide
- GLP-1
glucagon-like peptide 1
- iAUC
incremental area under the curve
- IGIcpep
insulinogenic index
- oDIcpep
oral disposition index
- OGTT
oral glucose tolerance test
- WBISI
whole-body insulin sensitivity index; Δ, change;
- ΔGLP-160-glu
GLP-1 increase after 60 minutes from glucose ingestion
- Δ GLP-160-fru
GLP-1 increase after 60 minutes from fructose ingestion
- ΔL-Ob
difference between lean individuals and individuals with obesity
