


Abstract
The patterns of the association between high-density lipoprotein cholesterol (HDL-C) concentrations and mortality among the elderly are still unclear.
To examine the association of HDL-C concentrations with mortality and to identify the optimal HDL-C concentration range that predicts the lowest risk of all-cause mortality among the elderly.
This was a nationwide, community-based, prospective cohort study.
This study included 7766 elderly individuals (aged ≥65 years; mean age: 74.4 years) from the Health and Retirement Study. Cox proportional hazards models and Cox models with penalized smoothing splines were used to estimate hazard ratios (HRs) with 95% CI for all-cause and cause-specific mortality.
During a median follow-up of 5.9 years, 1921 deaths occurred. After a full adjustment for covariates, a nonlinear (P < 0.001 for nonlinearity) association was found between HDL-C and all-cause mortality [minimum mortality risk at 71 mg/dL (1.84 mM)]; the risk for all-cause mortality was significantly higher in the groups with HDL-C concentration <61 mg/dL (1.58 mM; HR: 1.18; 95% CI: 1.05 to 1.33) and with HDL-C concentration >87 mg/dL (2.25 mM; HR: 1.56; 95% CI: 1.17 to 2.07) than in the group with HDL-C concentrations ranging from 61 to 87 mg/dL (1.58 to 2.25 mM). Nonlinear associations of HDL-C concentrations with both cardiovascular and noncardiovascular mortality were also observed (both P < 0.001 for nonlinearity).
Among the elderly, nonlinear associations were found between HDL-C and all-cause and cardiovascular mortality. The single optimal HDL-C concentration and range were 71 mg/dL and 61 to 87 mg/dL, respectively.
Numerous early observational studies have consistently demonstrated strong linear and inverse relationships between high-density lipoprotein cholesterol (HDL-C) and all-cause and cardiovascular mortality (1–3). For example, an analysis of four prospective American studies indicated that each 1 mg/dL increase in HDL-C concentration was associated with a 3.7% to 4.7% decrease in the rate of cardiovascular mortality (1). Nevertheless, this inverse association has recently been questioned based on evidence emerging from randomized controlled trials (RCTs) and genetic studies in humans. For instance, cholesteryl ester transfer protein inhibitors or niacin were not proven to improve clinical outcomes (4–8) and were even shown to increase paradoxically the risk of mortality (4), despite the ability of these treatments to increase HDL-C concentrations significantly. In addition, certain genetic variants associated with higher HDL-C concentrations have been paradoxically associated with an elevated risk of negative cardiovascular outcomes (9–11).
More recently, several prospective cohort studies have suggested a nonlinear association between the full range of HDL-C concentrations and all-cause mortality (12, 13). Indeed, a study using data from the Scottish Health Survey and the Health Survey for England (13) reconfirmed the findings obtained in a study of the general population (12) and in other studies of outpatients (14) or patients with kidney disease (15, 16), which revealed that the association between HDL-C and all-cause mortality is U shaped (both lower and higher concentrations are associated with an elevated risk of mortality). Additionally, new findings have indicated that aging could markedly alter HDL composition, leading to functional impairments that might contribute to the onset of cardiovascular disease (17).
The elderly (aged 65 years and older) is currently the fastest growing segment of the population and will continue to be until 2050. Previous studies have suggested that the HDL-C concentration decreases as a result of aging (18). In this context, the examination of the relationship between HDL-C and mortality and the identification of the optimal HDL-C range in this age group are important for public health and clinical practice. The existing literature has the following limitations: (i) most studies have focused on specific populations (e.g., outpatients or patients with kidney disease), and thus, studies of community-based elderly populations are limited; (ii) nonlinear associations have been explored using Cox models with penalized splines (P-splines), which is an effective method for the examination of the shape of associations; (iii) most previous studies have focused on the association of low HDL-C concentrations with mortality, but the influence of very high HDL-C concentrations remains unclear; and (iv) the optimal HDL-C concentration range, related to the lowest risk of mortality, has not been defined.
In the current study, we aimed to address some of these existing gaps by the examination of the relationship between HDL-C and all-cause and cause-specific mortality among the elderly (aged 65 years or older) using community-based cohort data from the Health and Retirement Study (HRS). Furthermore, we identified the optimal HDL-C concentration range, as determined by its association with the lowest risk of all-cause mortality.
Methods
Design, study setting, and participants
Details of the HRS and the study design have been previously described (19). In brief, the HRS is an ongoing, nationally representative, community-based cohort study of Americans aged 50 years or older with biennial survey assessments since 1992. Biomarker data were first collected in 2006 for one-half of the participants and in 2008 for the other half. Individuals aged 65 years or older with plasma HDL-C concentrations were included. In total, 7766 participants were eligible for the current analysis. Specifically, 2944, 3606, 679, and 537 participants were included from the 2006, 2008, 2010, and 2012 waves, respectively. Ethics approval for the HRS was received from the University of Michigan Institutional Review Board. Informed consent was obtained from all included participants.
Measurement of HDL-C
Blood samples were obtained from the participants by pricking their finger with sterile lancets (20). Measurement of HDL-C performed at the University of Washington involved fluorometric assays (20). In addition, HDL-C concentration was measured by dried blood spot (DBS) assays in HRS. The DBS assay results in the HRS were compared with the results of standard assays that more conventionally use whole blood samples, such as in the National Health and Nutrition Examination Survey (21). The results of the DBS assays were similar to those in the National Health and Nutrition Examination Survey (20). HDL-C concentrations display a low limit of detection of 15 mg/dL, a within-assay coefficient of variability of 5.3%, and a between-assay imprecision of 9.9%.
Analysis of mortality and associated rates
The primary outcome of the current study was death as a result of various causes. Death was ascertained in each wave via linkage with the National Death Index and by exit interviews with a family member. Previous HRS analyses have shown ∼99% validation of death (19). Causes of death were classified according to the International Classification of Diseases, 10th Revision. Death from cardiovascular disease was indicated by the International Classification of Diseases, 10th Revision codes I00 to I99; the remaining codes were used to identify noncardiovascular causes of death.
Covariates
The covariates included in our analyses were selected based on relationships between HDL-C concentration and mortality, as documented in the literature; the covariates included demographic information [age, sex, race, educational level, household income, and body mass index (BMI)], lifestyle information (smoking status, alcohol consumption, and regular exercise), laboratory indexes [total cholesterol (TC), C-reactive protein (CRP) level, and glycosylated Hb A1c (HbA1c)], history of chronic diseases (hypertension, diabetes, heart disease, lung disease, stroke, cancer, and psychiatric problems), and limitations in any of five activities of daily living (ADLs; bathing, getting in and out of bed, dressing, walking across a room, and eating). All covariates were obtained from a structured questionnaire and biochemical tests performed at baseline (see http://hrsonline.isr.umich.edu for the full details). Moreover, to correct for missing values and reduce the potential for inferential bias, we imputed missing data for the covariates using multiple imputation methods (22).
Statistical analysis
We calculated the time (in months) from the return of the baseline questionnaire until the date of death or the end of the observation period (31 December 2014), whichever occurred first. In each group, continuous variables were presented as the means and SD, and categorical variables were described as numbers and proportions (percentage). Based on a previous study (14), HDL-C concentrations were divided into eight categories (<30, 30 to 39, 40 to 49, 50 to 59, 60 to 69, 70 to 79, 80 to 89, and ≥90 mg/dL). We used Cox proportional hazards models to estimate hazard ratios (HRs) and 95% CI and to examine the relationship of HDL-C concentrations to all-cause mortality and cause-specific mortality. Two models were used. Model 1 was adjusted for age (in years) and sex (men or women), and model 2 (the fully adjusted model) was adjusted for race (white, black, or other), educational level (<12, 12 to 15, or >15 years), smoking status (yes or no), alcohol consumption (none, 1 to 4, or 5 to 7 d/wk), regular exercise (yes or no), BMI (<18.5, 18.5 to 25.0, or >25.0 kg/m2), household income (≤$20,000, $20,001 to $50,000, or >$50,000), TC levels (milligram per deciliter), CRP levels (milligram per liter), HbA1c (percentage), hypertension (yes or no), heart disease (yes or no), stroke (yes or no), cancer (yes or no), diabetes (yes or no), lung disease (yes or no), psychiatric problems (yes or no), and limitations in ADLs (yes or no).
We further applied Cox models with P-splines using HDL-C concentration as a continuous variable in the fully adjusted model to examine nonlinear or linear relationships of HDL-C with all-cause mortality and cause-specific mortality. The degree of freedom was determined by the lowest value of the Akaike information criterion (23), and a degree of freedom of four was used for HDL-C. To analyze further the relationship between HDL-C and all-cause mortality, we stratified the participants into three categories (<61, 61 to 87, and >87 mg/dL; Fig. 1), based on the Cox models with P-splines. As the association between HDL-C concentrations and all-cause mortality was approximately linear below and above their nadirs (71 mg/dL; Fig. 1), we additionally used a linear model to calculate the HRs per SD increase in all-cause mortality.
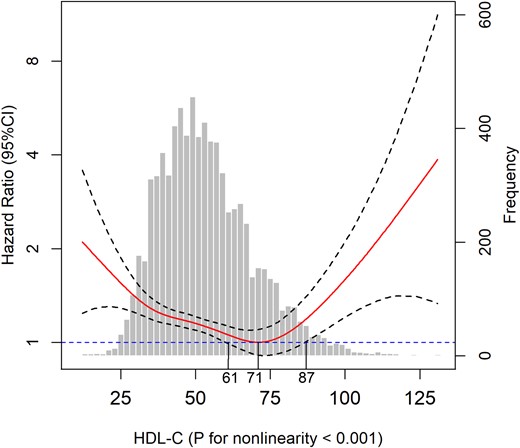
Association of HDL-C with all-cause mortality among the elderly. Solid line represents fully adjusted HRs, and dashed lines indicate 95% CI derived from Cox models with smoothing P-splines. Multivariate analyses were adjusted for age, sex, race, educational level, current smoking status, alcohol consumption, regular exercise, BMI, household income, TC level, CRP level, HbA1c, hypertension, heart disease, stroke, cancer, diabetes, lung disease, psychiatric problems, and limitations in ADLs.
We performed subgroup analyses of the association between HDL-C and all-cause mortality by sex (men or women), alcohol consumption (drinker or nondrinker), and current smoking status (smoker or nonsmoker). Furthermore, we performed several sensitivity analyses to determine the robustness of our primary findings and excluded all participants who died in the first year of follow-up or excluded participants who had a history of hypertension, diabetes, heart disease, stroke, cancer, lung disease, or psychiatric problems.
All analyses were completed using R software version 3.5.0 (2018; R Development Core Team). A two-tailed P value <0.05 was considered statistically significant.
Results
Baseline characteristics
The mean age of the participants was 74.4 years, and among them, 42.8% were women, and 83.4% were white. The mean HDL-C concentration was 51.5 mg/dL (1.33 mM), and the mean TC concentration was 197.4 mg/dL (5.11 mM). The proportion of women individuals and the TC concentration increased with increasing HDL-C concentrations (Table 1). Conversely, participants with lower HDL-C concentrations had progressively lower household income levels and a greater prevalence of hypertension, lung disease, diabetes, and stroke. Moreover, a higher frequency of alcohol consumption was observed among individuals with higher HDL-C concentrations.
Baseline Characteristics of the Participants According to HDL-C Concentrations
| Characteristicsa | HDL-C Concentration, mg/dL | ||||||||
|---|---|---|---|---|---|---|---|---|---|
| <30 | 30–39 | 40–49 | 50–59 | 60–69 | 70–79 | 80–89 | ≥90 | Total | |
| No. of participants | 245 | 1330 | 2004 | 1810 | 1215 | 653 | 322 | 187 | 7766 |
| Age, y | 74.4 ± 6.7 | 74.2 ± 6.6 | 74.7 ± 7.1 | 74.3 ± 6.9 | 74.5 ± 7.1 | 74.1 ± 6.7 | 74.2 ± 7.2 | 72.9 ± 6.1 | 74.4 ± 6.9 |
| Women, n (%) | 74 (30.2) | 507 (38.1) | 986 (49.2) | 1095 (60.5) | 858 (70.6) | 507 (77.6) | 261 (81.1) | 156 (83.4) | 4444 (57.2) |
| Race, n (%) | |||||||||
| White | 196 (80.0) | 1141 (85.8) | 1665 (83.1) | 1510 (83.4) | 1026 (84.4) | 528 (80.9) | 259 (80.4) | 154 (82.4) | 6479 (83.4) |
| Black | 36 (14.7) | 136 (10.2) | 262 (13.1) | 231 (12.8) | 160 (13.2) | 103 (15.8) | 55 (17.1) | 28 (15.0) | 1011 (13.0) |
| Other | 13 (5.3) | 53 (4.0) | 77 (3.8) | 69 (3.8) | 29 (2.4) | 22 (3.4) | 8 (2.5) | 5 (2.7) | 276 (3.6) |
| Household income, $, n (%) | |||||||||
| <20,001 | 77 (31.4) | 386 (29.0) | 597 (29.8) | 540 (29.8) | 349 (28.7) | 165 (25.3) | 87 (27.0) | 37 (19.8) | 2238 (28.8) |
| 20,001–50,000 | 94 (38.4) | 546 (41.1) | 798 (39.8) | 708 (39.1) | 483 (39.8) | 254 (38.9) | 133 (41.3) | 70 (37.4) | 3086 (39.7) |
| >50,000 | 74 (30.2) | 398 (29.9) | 609 (30.4) | 562 (31.0) | 383 (31.5) | 234 (35.8) | 102 (31.7) | 80 (42.8) | 2442 (31.4) |
| Educational level, y, n (%) | |||||||||
| <12 | 81 (33.1) | 377 (28.3) | 555 (27.7) | 467 (25.8) | 291 (24.0) | 144 (22.1) | 68 (21.1) | 26 (13.9) | 2009 (25.9) |
| 12–15 | 121 (49.4) | 724 (54.4) | 1062 (53.0) | 991 (54.8) | 690 (56.8) | 373 (57.1) | 188 (58.4) | 118 (63.1) | 4267 (54.9) |
| >15 | 43 (17.6) | 229 (17.2) | 387 (19.3) | 352 (19.4) | 234 (19.3) | 136 (20.8) | 66 (20.5) | 43 (23.0) | 1490 (19.2) |
| Alcohol consumption, n (%) | |||||||||
| None | 190 (77.6) | 997 (75.0) | 1470 (73.4) | 1238 (68.4) | 813 (66.9) | 415 (63.6) | 187 (58.1) | 97 (51.9) | 5407 (69.6) |
| 1–4 d/wk | 38 (15.5) | 215 (16.2) | 329 (16.4) | 339 (18.7) | 202 (16.6) | 119 (18.2) | 67 (20.8) | 38 (20.3) | 1347 (17.3) |
| 5–7 d/wk | 17 (6.9) | 118 (8.9) | 205 (10.2) | 233 (12.9) | 200 (16.5) | 119 (18.2) | 68 (21.1) | 52 (27.8) | 1012 (13.0) |
| Current smoker, n (%) | 30 (12.2) | 155 (11.7) | 184 (9.2) | 174 (9.6) | 112 (9.2) | 47 (7.2) | 35 (10.9) | 18 (9.6) | 755 (9.7) |
| Regular exercise, n (%) | 165 (67.3) | 979 (73.6) | 1496 (74.7) | 1387 (76.6) | 938 (77.2) | 527 (80.7) | 258 (80.1) | 153 (81.8) | 5903 (76.0) |
| BMI, kg/m2 | 29.1 ± 5.8 | 29.0 ± 5.2 | 28.5 ± 5.6 | 27.7 ± 5.6 | 26.9 ± 5.3 | 26.4 ± 4.9 | 25.7 ± 5.1 | 25.1 ± 4.4 | 27.79 ± 5.5 |
| TC, mg/dL | 161.4 ± 39.1 | 176.8 ± 37.3 | 189.8 ± 38.3 | 200.1 ± 38.3 | 209.0 ± 38.8 | 220.1 ± 40.6 | 226.1 ± 42.1 | 240.9 ± 43.1 | 197.4 ± 42.1 |
| CRP, mg/L | 6.9 ± 14.3 | 5.1 ± 9.2 | 5.0 ± 10.2 | 4.40 ± 9.1 | 4.1 ± 7.8 | 3.5 ± 5.8 | 3.5 ± 5.3 | 2.9 ± 3.5 | 4.57 ± 9.00 |
| HbA1c, % | 6.3 ± 1.4 | 6.0 ± 1.0 | 6.0 ± 1.0 | 5.9 ± 0.9 | 5.8 ± 0.8 | 5.8 ± 0.9 | 5.7 ± 0.8 | 6.0 ± 0.8 | 5.89 ± 0.9 |
| Heart disease, n (%) | 100 (40.8) | 523 (39.3) | 639 (31.9) | 512 (28.3) | 322 (26.5) | 147 (22.5) | 147 (22.5) | 65 (20.2) | 38 (20.3) |
| Stroke, n (%) | 34 (13.9) | 151 (11.4) | 225 (11.2) | 172 (9.5) | 93 (7.7) | 49 (7.5) | 294 (91.3) | 177 (94.7) | 762 (9.8) |
| Hypertension, n (%) | 173 (70.6) | 885 (66.5) | 1352 (67.5) | 1131 (62.5) | 742 (61.1) | 402 (61.6) | 173 (53.7) | 103 (55.1) | 4961 (63.9) |
| Cancer, n (%) | 43 (17.6) | 296 (22.3) | 354 (17.7) | 323 (17.8) | 233 (19.2) | 92 (14.1) | 39 (12.1) | 37 (19.8) | 1417 (18.2) |
| Diabetes, n (%) | 89 (36.3) | 414 (31.1) | 541 (27.0) | 362 (20.0) | 204 (16.8) | 93 (14.2) | 38 (11.8) | 23 (12.3) | 1764 (22.7) |
| Lung disease, n (%) | 26 (10.6) | 172 (12.9) | 228 (11.4) | 176 (9.7) | 150 (12.3) | 63 (9.6) | 27 (8.4) | 21 (11.2) | 863 (11.1) |
| Psychiatric problems, n (%) | 34 (13.9) | 190 (14.3) | 292 (14.6) | 218 (12.0) | 165 (13.6) | 99 (15.2) | 41 (12.7) | 23 (12.3) | 1062 (13.7) |
Values represent the means ± SD or number (percentage).
HDL-C and all-cause mortality
During a median follow-up period of 5.9 years (interquartile range: 3.9 to 7.5 years), we identified 1921 deaths. Table 2 shows the association of stratified HDL-C concentrations with all-cause mortality in the elderly. The pattern of association was nonlinear; compared with the reference group [70 to 79 mg/dL (1.81 to 2.06 mM)], groups with the highest [≥90 mg/dL (≥2.33 mM)] and lowest [<30 mg/dL (0.78 mM)] HDL-C concentrations had fully adjusted HRs of 1.60 (95% CI: 1.11 to 2.31) and 1.86 (95% CI: 1.39 to 2.48), respectively, for all-cause mortality (Table 2).
HRs (95% CI) for All-Cause Mortality According to HDL-C Concentration in the Elderly
| HDL-C Concentration, mg/dL | Deaths/n | Model 1a | Model 2b | ||
|---|---|---|---|---|---|
| HR (95% CI) | P | HR (95% CI) | P | ||
| <30 | 84/245 | 2.30 (1.73–3.07) | <0.001 | 1.72 (1.28–2.31) | <0.001 |
| 30–39 | 406/1330 | 1.79 (1.45–2.22) | <0.001 | 1.39 (1.12–1.74) | <0.001 |
| 40–49 | 526/2004 | 1.51 (1.23–1.85) | <0.001 | 1.31 (1.06–1.62) | 0.005 |
| 50–59 | 421/2810 | 1.40 (1.14–1.73) | 0.002 | 1.28 (1.04–1.59) | 0.006 |
| 60–69 | 254/1215 | 1.24 (0.99–1.55) | 0.060 | 1.16 (0.92–1.45) | 0.131 |
| 70–79 | 112/653 | 1.00 (reference) | – | 1.00 (reference) | – |
| 80–89 | 79/322 | 1.49 (1.12–1.99) | 0.026 | 1.55 (1.16–2.07) | 0.012 |
| ≥90 | 39/187 | 1.51 (1.05–2.18) | <0.001 | 1.56 (1.08–2.26) | <0.001 |
Model 1: adjusted for age and sex.
Model 2: adjusted for age, sex, race, educational level, current smoking status, alcohol consumption, regular exercise, BMI, household income, TC level, CRP level, HbA1c, hypertension, heart disease, stroke, cancer, diabetes, lung disease, psychiatric problems, and limitations in ADLs.
Similar to the results of HDL-C subgroup analysis, the results of the P-spline analysis showed a nonlinear association of HDL-C with all-cause mortality (P < 0.001 for nonlinearity; Fig. 1). The HDL-C concentration at which the risk of all-cause mortality was the lowest was 71 mg/dL (1.84 mM). Participants with HDL-C concentrations lower than 61 mg/dL (1.58 mM) or higher than 87 mg/dL (2.25 mM) had a significantly higher risk of all-cause mortality than participants with HDL-C concentrations of 71 mg/dL (1.84 mM; P < 0.05; Fig. 1); in contrast, an HDL-C concentration of 61 to 87 mg/dL (1.58 to 2.25 mM) did not significantly predict a higher risk of all-cause mortality than an HDL-C concentration above or below that range. To determine the HDL-C range associated with the risk of all-cause mortality, we used Cox proportional hazards models with an intermediate HDL-C range [61 to 87 mg/L (1.58 to 2.25 mM)] as the reference category. In the fully adjusted model, the risk of all-cause mortality was significantly higher in the group with low (HR: 1.18; 95% CI: 1.05 to 1.33) and high (HR: 1.56; 95% CI: 1.17 to 2.07) HDL-C concentrations than in the group with intermediate HDL-C concentrations (Table 3). The HRs for predictions of all-cause mortality per SD increase in participants with HDL-C concentrations below and above 71 mg/dL (1.84 mM) were 0.92 (95% CI: 0.87 to 0.96) and 1.28 (95% CI: 1.12 to 1.47), respectively (Table 3).
HRs (95% CI) for All-Cause Mortality According to HDL-C Concentrations Stratified by Cutoff Values Derived From the Nonlinear Association
| Deaths/n | Model 1a | Model 2b | |||
|---|---|---|---|---|---|
| HR (95% CI) | P | HR (95% CI) | P | ||
| Each 1 SD increase in participants with HDL-C ≤ 71 mg/dLc | 1709/6692 | 0.88 (0.83–0.92) | <0.001 | 0.92 (0.87–0.96) | <0.001 |
| Each 1 SD increase in participants with HDL-C > 71 mg/dL | 212/1074 | 1.25 (1.10–1.42) | <0.001 | 1.28 (1.12–1.47) | <0.001 |
| Categorical HDL-C concentrations, mg/dL | |||||
| <61 | 1470/5540 | 1.32 (1.18–1.48) | <0.001 | 1.18 (1.05–1.33) | 0.005 |
| 61–87 | 395/1975 | 1.00 (reference) | – | 1.00 (reference) | – |
| >87 | 56/251 | 1.41 (1.07–1.87) | 0.016 | 1.56 (1.17–2.07) | 0.002 |
Model 1: adjusted for age and sex.
Model 2: adjusted for age, sex, race, educational level, current smoking status, alcohol consumption, regular exercise, BMI, household income, TC level, CRP level, HbA1c, hypertension, heart disease, stroke, cancer, diabetes, lung disease, psychiatric problems, and limitations in ADLs.
HR per SD increase.
In stratified analyses, the association between HDL-C concentration on a continuous scale and all-cause mortality was nonlinear for both men and women (24); the associations between HDL-C and all-cause mortality were also similar for participants who consumed alcohol and those who did not (24). A significant nonlinear association between HDL-C concentration and all-cause mortality was found in nonsmokers. For smokers, a similar nonlinear trend was observed, but the association was not significant, possibly as a result of the relatively small sample size (24). In sensitivity analyses, the nonlinear association of HDL-C concentration with mortality remained when participants who died in the first year were excluded (24). We also removed participants with a history of hypertension, diabetes, heart disease, lung disease, stroke, cancer, or psychiatric problems and found patterns that were similar to the major findings (24).
HDL-C and cause-specific mortality
Among the participants who died, 665 died of cardiovascular causes, and 1256 died of noncardiovascular causes. Nonlinear associations of HDL-C concentration with both cardiovascular and noncardiovascular mortality were observed (P < 0.001 for nonlinearity; Fig. 2). These findings were also confirmed when HDL-C concentration was treated as a categorical variable (Table 4); in the fully adjusted model, participants in the group with the lowest HDL-C concentration [<30 mg/dL (<0.78 mM)] had a significantly higher risk of both cardiovascular mortality (HR: 2.86; 95% CI: 1.77 to 4.62) and noncardiovascular mortality (HR: 1.57; 95% CI: 1.08 to 2.26) than participants in the group with HDL-C concentrations within the reference range; for participants in the group with the highest HDL-C concentrations [≥90 mg/dL (≥2.33 mM)], we found a similarly increased risk trend for both cardiovascular mortality and noncardiovascular mortality, but the association was not significant, perhaps as a result of the relatively limited sample size.
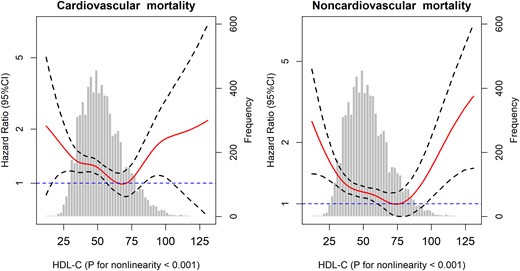
Association of HDL-C with cardiovascular and noncardiovascular mortality among the elderly. Solid lines represent fully adjusted HRs, and dashed lines indicate 95% CI derived from Cox models with smoothing P-splines. Multivariate analyses were adjusted for age, sex, race, educational level, current smoking status, alcohol consumption, regular exercise, BMI, household income, TC level, CRP level, HbA1c, hypertension, heart disease, stroke, cancer, diabetes, lung disease, psychiatric problems, and limitations in ADLs.
Association Between HDL-C and Cause-Specific Mortality
| HDL-C Concentration, mg/dL | Cardiovascular Mortality | Noncardiovascular Mortality | ||||
|---|---|---|---|---|---|---|
| Deaths/n | HR (95% CI)a | P | Deaths/n | HR (95% CI) | P | |
| <30 | 33/245 | 2.86 (1.77–4.62) | <0.001 | 51/245 | 1.57 (1.08–2.26) | 0.016 |
| 30–39 | 127/1330 | 1.77 (1.21–2.58) | 0.293 | 279/1330 | 1.44 (1.10–1.88) | 0.008 |
| 40–49 | 206/2004 | 1.82 (1.28–2.61) | 0.001 | 320/2004 | 1.21 (0.93–1.56) | 0.154 |
| 50–59 | 142/1810 | 1.47 (1.02–2.21) | 0.397 | 279/1810 | 1.27 (0.98–1.64) | 0.073 |
| 60–69 | 78/1215 | 1.17 (0.79–1.74) | 0.433 | 176/1215 | 1.17 (0.89–1.53) | 0.200 |
| 70–79 | 36/653 | 1.00 (reference) | – | 76/653 | 1.00 (reference) | – |
| 80–89 | 30/322 | 1.73 (1.07–2.82) | 0.026 | 49/322 | 1.35 (0.94–1.93) | 0.104 |
| ≥90 | 13/187 | 1.62 (0.86–3.05) | 0.138 | 26/187 | 1.45 (0.93–2.27) | 0.111 |
Adjusted for age, sex, race, educational level, current smoking status, alcohol consumption, regular exercise, BMI, household income, TC level, CRP level, HbA1c, hypertension, heart disease, stroke, cancer, diabetes, lung disease, psychiatric problems, and limitations in ADLs .
Discussion
In this community-based cohort study, we confirmed the presence of independent nonlinear associations of the plasma HDL-C concentration with all-cause, cardiovascular, and noncardiovascular mortality among the elderly. Specifically, with the use of Cox models with P-splines, we observed that the HDL-C concentration associated with the lowest risk of all-cause mortality was ∼71 mg/dL and that the optimal HDL-C concentration range was between 61 and 87 mg/dL.
Early studies have consistently indicated an inverse and linear association between HDL-C concentrations and the risk of death in the general population (1, 3). Interestingly, the plasma HDL-C concentrations in these studies were commonly categorized by quantiles, which might result in failure to detect a positive association of very high HDL-C concentrations (e.g., >90 mg/dL) with mortality. For instance, one study conducted by Wilson et al. (3) categorized the plasma HDL-C concentration by quintiles (12 to 34, 35 to 40, 41 to 46, 47 to 54, and 55 to 129 mg/dL for men; 23 to 44, 45 to 51, 52 to 58, 59 to 69, and 70 to 139 mg/dL for women); in this example, the lower bound of the highest quintile was lower than the nadir (71 mg/dL) for the risk of all-cause mortality in our study. Recent prospective cohort studies, based on the general population, have supported our finding of a nonlinear association between HDL-C and all-cause mortality (12, 13). This community-based cohort study provides clear evidence of a nonlinear association between HDL-C and mortality among the elderly. Previous studies have indicated an inconsistent relationship of HDL-C with cardiovascular mortality in the general population. For instance, Hamer et al. (13) found that the association of HDL-C with cardiovascular mortality was linear, whereas Madsen et al. (12) indicated that the association was nonlinear (U shaped). Among the elderly, we found a nonlinear association between cardiovascular mortality and HDL-C concentration.
Some concerns remain in the assessment of the associations between HDL-C and mortality. The most serious concern is reverse causation associated with mortality. For example, the presence of a chronic disease (e.g., kidney disease), which leads to higher mortality in participants and is associated with HDL-C concentration, can spuriously increase the estimated risk of death. Hence, in our study, we excluded the first year of follow-up to minimize reverse causation bias and found no meaningful change. Another concern is that a potential source of residual confounding may distort the association between HDL-C and mortality. For instance, alcohol consumption is a particularly important factor, as frequent alcohol consumption is associated with high HDL-C concentrations (18); thus, individuals who consume alcohol may skew the estimated risk of death. However, the nonlinear association did not change when the analyses were stratified according to alcohol consumption. Furthermore, we adjusted for multiple important potential confounders, including demographic factors, lifestyle factors, biomarkers (TC, CRP, and HbA1c), and history of chronic diseases. Hence, our findings support a nonlinear relationship between HDL-C and mortality in the elderly.
Nevertheless, the potential mechanism underlying this nonlinear association remains to be fully understood. Compared with the nadir (71 mg/dL) of the nonlinear curve (Fig. 1), both lower (<61 mg/dL) and higher (>87 mg/dL) concentrations are associated with an elevated risk of all-cause mortality. Therefore, this nonlinear association between HDL-C concentrations and all-cause mortality was more likely to be U shaped. The part of the curve with a negative slope might be explained by the fact that individuals with low HDL concentrations have an increased accumulation of arterial plaques, which could potentially lead to atherosclerosis and may contribute to cardiovascular disease, stroke, and other vascular diseases (25). For the part of the curve with a positive slope (>71 mg/dL), in which the risk of mortality increases with increasing HDL-C concentration, several possible explanations exist. One plausible explanation is that at high HDL-C concentrations, the HDL particle sizes become so large that particles, such as low-density lipoproteins, become trapped in the arterial intima (26), resulting in cholesterol deposition and atherosclerosis. Another possible explanation is the presence of genetic variants that lead to very high HDL-C concentrations but have unfavorable health effects (27). Several specific genetic variants (e.g., CETP, SCARB1, LIPC, ABCA1) are known to be related to both a high risk of cardiovascular disease and a high HDL-C concentration (28–30). Moreover, experimental evidence indicates that HDL-C shows concentration-related biphasic effects and that the protective effect of HDL-C is reversed at high concentrations, where it paradoxically promotes senescence and impairs endothelial progenitor cell tube formation and angiogenesis (31).
Our study has potential implications for public health and clinical practice. First, current guidelines recommend that only low HDL-C (<40 mg/dL) concentrations are risk factors for cardiovascular disease and provide guidance for lipid-lowering therapy (32, 33), whereas our findings suggest that clinicians should be aware that older individuals with very high HDL-C concentrations may be at high risk for mortality. Moreover, the finding that higher HDL-C concentrations (e.g., >90 mg/dL) are associated with higher all-cause and cardiovascular mortality might partly help explain the failure of RCTs. For instance, an RCT conducted by Krishna et al. (34) found that the use of evacetrapib increased HDL-C to very high concentrations (>100 mg/dL), which was found to be associated with an increased risk of mortality in our and previous studies (12, 13, 15). Our results indicate that higher HDL-C concentrations are not necessarily always preferable, as the relationship between HDL-C and all-cause mortality is not linear over the entire range of HDL-C concentrations.
The strengths of this study include the nationally representative sample, community-based design, and careful sensitivity analyses to examine the relationship of HDL-C with all-cause mortality across a full range of concentrations among the elderly. In addition, this study used Cox models with P-splines to confirm the potential nonlinear associations and to identify the optimal value and range of HDL-C concentrations associated with the lowest risk of mortality. However, several limitations should be acknowledged. First, this study is limited by its observational design. Hence, a causal relationship between HDL-C concentration and mortality cannot be established. Second, although our analyses were adjusted for an extensive set of confounding factors, residual confounding—resulting from measurement error in the assessment of confounding factors and unmeasured factors, such as the history of statin use, low-density lipoprotein cholesterol, and triacylglycerols—could not be excluded. Moreover, although the relatively small sample size may have contributed to the low statistical power encountered in some subgroup (e.g., >90 mg/L) and cause-specific mortality analyses, this study can help power future investigations.
In conclusion, our study demonstrates that the associations of HDL-C concentration with both all-cause and cardiovascular mortality are nonlinear in the elderly. Based on our results, the optimal HDL-C concentration and range with regard to the lowest risk of all-cause mortality were 71 mg/dL and 61 to 87 mg/dL, respectively. The current study suggests that the HDL-C concentration is not “the higher, the better” in the elderly, because the high HDL-C concentration (e.g., >90 mg/L) may increase the risk of mortality through the promotion of senescence and impairment of endothelial progenitor cell tube formation and angiogenesis (31). These findings need further confirmation in future studies.
Acknowledgments
Financial Support: This study was supported by construction of high-level university of Guangdong: Grants C1050008 and C1051007 (to C.M.). This work also supported by the National Key Research and Development Program of China, Grant 2018YFC2000400 (to C.M.), and the National Natural Sciences Foundation of China, Grant 81573207 (to X.-B.W.).
Author Contributions: Z.-H.L. and Y.-B.L. designed the research and developed the analytical plan. C.M. and X.-B.W. directed the study. Z.-H.L. performed the statistical analyses and had primary responsibility for writing the manuscript. W.-F.Z. contributed to data cleaning. M.-C.Z., X.G., V.B.K., X.-R.Z., F.-R.L., J.-Q.Y., and X.-M.S. contributed to the acquisition, analysis, or interpretation of the data. All authors critically reviewed the manuscript for important intellectual content.
Disclosure Summary: The authors have nothing to disclose.
Abbreviations:
- ADLs
activities of daily living
- BMI
body mass index
- CRP
C-reactive protein
- DBS
dried blood spot
- HbA1c
Hb A1c
- HDL-C
high-density lipoprotein cholesterol
- HR
hazard ratio
- HRS
Health and Retirement Study
- P-spline
penalized spline
- RCT
randomized controlled trial
- TC
total cholesterol
References
Author notes
Z.-H.L. and Y.-B.L. contributed equally to this study.
