


Abstract
Although recent genetic studies have identified many susceptibility loci associated with type 2 diabetes (T2D), the usefulness of such loci for precision medicine remains uncertain.
This study investigated the impact of genetic risk score (GRS) on the development of T2D in a general Japanese population.
The current study consists of 1465 subjects aged 40 to 79 years without diabetes who underwent a health examination in 2002.
The GRS was generated using the literature-based effect size for T2D of 84 susceptibility loci for the Japanese population, and the risk estimates of GRS on the incidence of T2D were computed by using a Cox proportional hazard model in a 10-year follow-up study. The influence of GRS on the predictive ability was estimated with Harrell C statistics, integrated discrimination improvement (IDI), and continuous net reclassification improvement (cNRI).
During the 10-year follow-up, 199 subjects experienced T2D. The risk of developing T2D increased significantly with elevating quintiles of GRS (multivariable-adjusted hazard ratio for the fifth vs first quintile, 2.85; 95% CI, 1.83 to 4.44). When incorporating GRS into the multivariable model comprising environmental risk factors, the Harrell C statistics (95% CI) increased from 0.681 (0.645 to 0.717) to 0.707 (0.672 to 0.742) and the predictive ability of T2D was significantly improved (IDI, 0.0376; 95% CI, 0.0284 to 0.0494; cNRI, 0.3565; 95% CI, 0.1278 to 0.5829). GRS was also associated with the risk of T2D independently of environmental risk factors.
These findings suggest the usefulness of GRS for identifying a high-risk population together with environmental risk factors in the Japanese population.
The number of patients with type 2 diabetes (T2D) is continuing to increase worldwide (1). Diabetes deteriorates quality of life through clinical sequelae, causes >2 million deaths every year through an increase in mortality from macrovascular and microvascular complications, and imposes a tremendous monetary burden, with a global cost of US$825 billion in 2014 (2, 3). Therefore, to prevent or delay T2D onset and reduce the burden of diabetes, the identification of high-risk populations for T2D and the optimal preventive strategies are important emerging goals in global health care systems (4).
Individual prediction to identify a high-risk population of future development of diabetes is a primary methodology for preventive health care. Numerous risk models incorporating environmental risk factors such as lifestyle-related factors and glycemic values have been developed to estimate the individual risk of diabetes in various ethnicities (5). However, the accuracy of risk models in discriminating subjects with and without diabetes remains unsatisfactory. Therefore, epidemiologists and statisticians have been inspired to generate a more precise risk model than the model with known environmental risk factors.
It is known that genetic factors are important for the development of T2D, in complex interaction with environmental factors (6). Accordingly, several studies have developed risk models that incorporate genetic effects into the models using traditional environmental factors, and these risk models have been reported to show little improvement in predictive performance (5, 7). However, most of these studies were performed in white populations, with only a few case-control studies being performed in Japanese populations (8–10). Moreover, case-control studies run the risk of introducing selection bias due to their matched design, and their results lack interpretation, because they are not based on an estimate of the receiver operating characteristic curve for the population of interest (11). Additionally, they used relatively small numbers of susceptibility loci to calculate the genetic risk score (GRS). Because genetic backgrounds, lifestyles, and the potential incidence of diabetes are all heterogeneous among ethnicities, and >80 susceptibility loci have been discovered by genome-wide association studies (GWASs) (12), there is a clear need for new research using genetic factors calibrated for specific ethnicities (13).
In the current study, therefore, we generated the GRS by using the effect size derived from a large-scale GWAS for T2D in the Japanese population (12) and estimated the impact of the gene–environmental interaction on the development of T2D. Additionally, we investigated whether the GRS would achieve a risk prediction ability for T2D greater than that of a model with environmental risk factors in a general Japanese population.
Methods
Study populations and follow-up survey
A population-based prospective study of cerebrovascular/cardiovascular diseases and their risk factors has been underway since 1961 in the town of Hisayama, a suburb of the Fukuoka metropolitan area on Kyushu Island in Japan (14, 15).
A flowchart of subjects in this study is shown in Fig. 1. Of all residents ≥40 years of age, 3328 underwent the examination (participation rate 77.6%) in 2002. Among the participating residents, 3249 subjects agreed to the genetic analysis, and the genotype data were successfully obtained from a total of 3230 subjects by using Illumina’s OmniExpressExome BeadChip (Illumina, San Diego, CA) at the RIKEN Center for Integrative Medical Sciences (16). For quality control of samples, we excluded samples with a call rate of <0.98 in advance. Population structure was evaluated by the PLINK (v1.9; http://www.cog-genomics.org/plink/1.9/) “-pca” method (17), and two non–East Asian subjects were removed. Genetic relatedness was inferred by the PLINK “-genome” method, and 1181 subjects who exhibited cryptic relatedness (PI_HAT >0.25) were removed (18). Of the remaining 2047 samples, we filtered out single-nucleotide polymorphisms (SNPs) with call rates <0.99, Hardy-Weinberg exact test P values <1 × 10⁻⁶, and minor allele frequencies <0.01. From this filtered genotype data set, we extracted variants in autosomal chromosomes and phased the haplotypes using SHAPEIT2 (v2.778; http://mathgen.stats.ox.ac.uk/genetics_software/shapeit/shapeit.html) (19). Genotype imputation was then performed with these phased haplotype data using Minimac3 (v2.0.1; https://genome.sph.umich.edu/wiki/Minimac3) (20) with the 1000 Genomes Project (phase 3, v5; http://www.internationalgenome.org/) as a reference (21). After excluding 115 subjects ≥80 years of age because of a risk of adverse events such as gastrointestinal symptoms in response to the administration of a 75-g oral glucose tolerance test (OGTT), 71 subjects without the measurement of OGTT, 315 subjects with diabetes at baseline, and 81 subjects who did not participate in the follow-up survey, a total of 1465 subjects were enrolled in the current study. They were followed up by yearly health examinations, including an OGTT as well as a check of the medical records for antidiabetic treatment, until the time of death, the onset of diabetes mellitus, the latest occasion of the follow-up survey, or 30 November 2012 (mean follow-up period, 8.5 years). These participants underwent a median of 9 (interquartile range, 6 to 11) follow-up examinations, and, among them, 231 (15.8% of the follow-up population) underwent all 10 annual OGTTs. During the follow-up, T2D occurred in 199 participants.
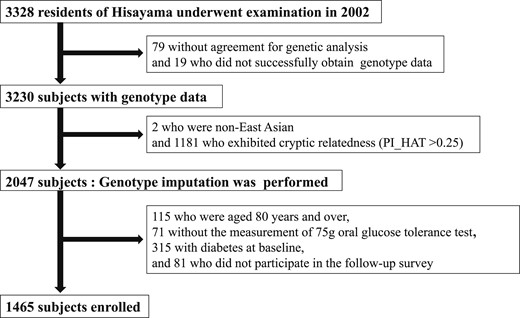
Flowchart of subjects in this study.
The current study was carried out with the approval of the Kyushu University Institutional Review Board for Clinical Research, and written informed consent was obtained from all participants.
Definition of glucose tolerance status
At the baseline survey in 2002 to 2003, participants underwent an OGTT after an overnight fast of at least 12 hours, and the glucose tolerance status, that is, normal glucose tolerance, impaired fasting glucose, impaired glucose tolerance, and diabetes, was defined based on the 2006 World Health Organization criteria (22). During the follow-up period, new onset of diabetes was determined based on either the OGTT data or the measurements of fasting or casual plasma glucose in the annual health examinations and the clinical information (i.e., medical records and the use of antidiabetic medications). Prediabetes was defined as either impaired fasting glucose or impaired glucose tolerance. When patients were newly administered insulin therapy during follow-up, they were checked to determine whether they were diagnosed as having type 1 diabetes or were positive for type 1 diabetes autoantibodies. Any such subjects would have been censored, but in fact no subjects were determined to have type 1 diabetes.
Candidate SNP selection and GRS construction
We selected one lead SNP for each locus that showed a genome-wide significant association with T2D in previous reports (12, 23, 24). However, when the T2D-associated SNPs met any of the following criteria, they were not included in the GRS: (i) monomorphic in a Japanese population (HNF1A, PAM, MTMR3B), (ii) low minor allele frequency of <0.5% in a Japanese population (JAZF1, ADCY5, LPP), (iii) X chromosomal locus (DUSP9), (iv) discovered in the imprinting region with parent-of-origin effect (DUSP8), and (v) discovered in body mass index (BMI)–stratified analysis (LAMA1). After screening, a total of 84 SNPs at 84 loci were selected as candidate SNPs for the GRS in this study (25). We generated the GRS using a literature-based coefficient (i.e., the natural log-transformed OR, hereinafter called the “Japanese coefficient”) for the aforementioned 84 SNPs from the Japanese GWAS data reported by the Biobank Japan project (12). The GRS was calculated in each participant by summing the product of the dosage of risk alleles in half and the literature-based coefficient for each SNP. In a similar manner, we also created the GRS using a literature-based coefficient from the meta-analysis of European GWAS data reported by the DIAbetes Genetics Replication And Meta-analysis Consortium (23), in which 80 SNPs were available for the GRS (hereinafter called the “European coefficient”). Proxies for three SNPs were not available, and one SNP was monomorphic in Europeans.
Clinical evaluation and laboratory measurements
Each participant completed a self-administered questionnaire pertaining to medical history, family history, antidiabetic and antihypertensive treatments, lipid-modifying medication, alcohol intake, smoking habits, and regular exercise. Diabetes mellitus in first- or second-degree relatives was regarded as a family history of diabetes. Alcohol intake and smoking habits were classified as either current use or not. Subjects engaging in sports at least three times per week during their leisure time were defined as the regular exercise group. Height and weight of the participants were measured with light clothes and no shoes, and BMI was calculated. Obesity was defined as a BMI ≥25.0 kg/m2 (26). Blood pressure was measured three times using an automated sphygmomanometer (BP-203RV III; Colin, Tokyo, Japan) in 2002 with the participant in a sitting position after rest for at least 5 minutes; the average values were used in the analyses. Hypertension was defined as a systolic blood pressure ≥140 mm Hg, a diastolic blood pressure ≥90 mm Hg, or current treatment with antihypertensive agents. Total and high-density lipoprotein (HDL) cholesterols and triglycerides were determined enzymatically. Dyslipidemia was defined as serum total cholesterol ≥5.7 mmol/L, serum HDL cholesterol <1.0 mmol/L, or serum triglycerides ≥1.7 mmol/L (15, 27).
Statistical analysis
Individual genotype dosages were derived from Minimac3, and the format of the data was altered for PLINK by means of a dosage converter. Scoring of the GRS was performed using PLINK (18). The SAS software package version 9.4 (SAS Institute, Cary, NC) was used for other statistical analyses. GRS levels were divided into quintiles. Trends in the environmental factors at baseline across quintiles of GRS were tested using a linear regression for mean values and logistic regression for frequencies, where serum triglycerides and times of received health examination were log-transformed owing to the skewed distributions. The age- and sex-adjusted incidence of T2D was calculated using the direct method with the age and sex distributions of the overall study group. The hazard ratios (HRs) and 95% CIs per 1 SD in GRS and of quintiles of GRS for the development of T2D were estimated by using Cox proportional hazard models. The heterogeneity in the magnitude of the association between subgroups of environmental risk factors was assessed by adding multiplicative interaction terms of GRS with each subgroup in the relevant model. To investigate the influence of GRS on the prediction ability of future T2D, Harrell C statistics, integrated discrimination improvement (IDI), and continuous net reclassification improvement (cNRI) for survival analyses were calculated before and after adding GRS to the statistical model including environmental risk factors (28, 29), wherein bootstrap sampling with 1000 iterations was used to estimate 95% CIs and P values (30). Categorical NRI was also calculated using cutoff values of the tertiles of predicted risk with the environmental risk model during 10 years. Sensitivity analyses were performed among participants with normal glucose tolerance at baseline to investigate (i) the association of GRS with incident diabetes (25), and (ii) the association with incident prediabetes (25). In the analysis of the association between GRS and the risk of prediabetes, prediabetes was determined by using only the data of OGTTs. The participants were censored at the time of the onset of diabetes in addition to the time of death, or the latest occasion of the follow-up survey. A P value <0.05 was considered statistically significant in all analyses.
Data availability
Sharing the data in this study cannot be permitted according to the data protection regulations of the executive committee of the cohort and of the administration that supports the cohort. No additional data are available.
Results
The baseline characteristics according to quintiles of the GRS using the Japanese coefficient are shown in Table 1. The frequencies of family history of diabetes mellitus and the mean values of fasting plasma glucose (FPG) increased with elevating quintiles of the GRS using the Japanese coefficient. Similar values and differences were observed between quintiles of the GRS using the European coefficient, except for the mean values of BMI and the frequencies of regular exercise, for which the linear associations with the GRS reached statistical significance (25).
Baseline Characteristics According to the Quintile of T2D GRS Using a Japanese Coefficient
| Environmental Factors | GRS Using a Japanese Coefficient | P for Trend | ||||
|---|---|---|---|---|---|---|
| Q1 (≤2.7448) | Q2 (2.7449–2.8970) | Q3 (2.8971–3.0140) | Q4 (3.0141–3.157) | Q5 (≥3.1578) | ||
| (N = 293) | (N = 293) | (N = 293) | (N = 293) | (N = 293) | ||
| Age, y | 57.9 (9.4) | 58.1 (9.5) | 57.4 (9.2) | 58.3 (10.5) | 56.4 (10) | 0.12 |
| Men, % | 40.6 | 38.6 | 35.8 | 32.8 | 38.2 | 0.34 |
| Family history of diabetes mellitus, % | 11.6 | 9.9 | 9.9 | 17.1 | 14.3 | 0.04 |
| FPG, mmol/L | 5.67 (0.44) | 5.69 (0.42) | 5.66 (0.44) | 5.72 (0.47) | 5.81 (0.49) | <0.001 |
| 2hPG, mmol/L | 6.74 (1.53) | 6.74 (1.63) | 6.92 (1.60) | 6.79 (1.57) | 7.02 (1.66) | 0.14 |
| Hypertension, % | 39.2 | 36.2 | 32.4 | 31.7 | 36.2 | 0.30 |
| Serum total cholesterol, mmol/L | 5.32 (0.88) | 5.32 (0.92) | 5.35 (0.90) | 5.30 (0.91) | 5.27 (0.97) | 0.88 |
| Serum HDL cholesterol, mmol/L | 1.67 (0.43) | 1.66 (0.43) | 1.67 (0.42) | 1.64 (0.40) | 1.65 (0.43) | 0.93 |
| Serum triglycerides, mmol/L | 1.08 (0.72–1.65) | 1.05 (0.76–1.54) | 1.04 (0.75–1.56) | 1.03 (0.78–1.35) | 1.04 (0.77–1.45) | 0.80 |
| Use of lipid-modifying medication, % | 7.2 | 7.2 | 6.1 | 5.5 | 6.8 | 0.90 |
| BMI, kg/m2 | 23.2 (3.2) | 23.4 (3.3) | 22.8 (3.1) | 22.8 (2.9) | 23.0 (2.9) | 0.07 |
| Smoking habits, % | 22.9 | 21.8 | 22.2 | 15.4 | 21.2 | 0.16 |
| Alcohol intake, % | 48.1 | 44.7 | 39.6 | 44.0 | 48.1 | 0.21 |
| Regular exercise, % | 13.3 | 7.8 | 12.3 | 11.6 | 10.2 | 0.26 |
| Times of received health examination during follow-up | 10 (6–11) | 9 (6–11) | 9 (5–11) | 10 (6–11) | 9 (6–11) | 0.49 |
Serum triglycerides and times of received health examination during follow-up are presented as the median (interquartile range). All other values are presented as the mean (SD) or percentages.
Age- and sex-adjusted incidence of T2D increased significantly with elevating levels of the GRS using the Japanese coefficient (P for trend <0.001) (Fig. 2). This association remained unchanged after adjusting for environmental factors, namely, age, sex, family history of diabetes mellitus, hypertension, serum total cholesterol, serum HDL cholesterol, serum triglycerides, use of lipid-modifying medication, BMI, smoking habits, alcohol intake, and regular exercise (Table 2). The multivariable-adjusted HR for T2D was significantly higher in the fifth quintile of the GRS compared with that in the first quintile (HR, 2.85; 95% CI, 1.83 to 4.44; P < 0.001). This association was modestly attenuated after additional adjustment for FPG and 2-hour postload glucose (2hPG), but the association remained significant (HR, 2.05; 95% CI, 1.31 to 3.21; P = 0.002). When the analysis was restricted to subjects with normal glucose tolerance at baseline (25), the multivariable-adjusted incidence of T2D or prediabetes also increased significantly with elevating levels of the GRS using the Japanese coefficient (both P values for trend <0.05) (25).
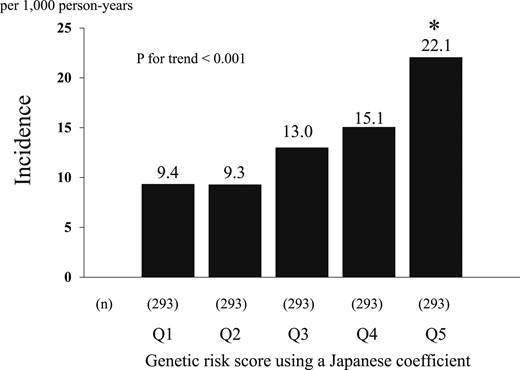
Age- and sex-adjusted incidence rate of T2D according to the quintile of the GRS using a Japanese coefficient. *P < 0.05 vs the first quintile.
The Associations of T2D GRS Using a Japanese Coefficient With Development of T2D
| GRS Levels | No. of Events/Subjects | Model 1 | Model 2 | Model 3 | ||||||
|---|---|---|---|---|---|---|---|---|---|---|
| HR (95% CI) | P | P for Trend | HR (95% CI) | P | P for Trend | HR (95% CI) | P | P for Trend | ||
| Q1 | 29/293 | 1.00 (reference) | — | <0.001 | 1.00 (reference) | — | <0.001 | 1.00 (reference) | — | <0.001 |
| Q2 | 28/293 | 1.00 (0.59, 1.68) | 0.99 | 0.99 (0.59, 1.66) | 0.96 | 0.96 (0.57, 1.62) | 0.88 | |||
| Q3 | 39/293 | 1.52 (0.94, 2.47) | 0.09 | 1.70 (1.05, 2.75) | 0.03 | 1.45 (0.89, 2.37) | 0.13 | |||
| Q4 | 41/293 | 1.57 (0.97, 2.53) | 0.06 | 1.77 (1.10, 2.87) | 0.02 | 1.52 (0.93, 2.47) | 0.09 | |||
| Q5 | 62/293 | 2.61 (1.67, 4.05) | <0.001 | 2.85 (1.83, 4.44) | <0.001 | 2.05 (1.31, 3.21) | 0.002 | |||
In model 1, adjustment was made for age and sex. In model 2, adjustment was made for age, sex, family history of diabetes mellitus, hypertension, serum total cholesterol, serum HDL cholesterol, serum triglycerides, use of lipid-modifying medication, BMI, smoking habits, alcohol intake, and regular exercise. In model 3, adjustment was made for covariates included in model 2 plus FPG and 2hPG.
Subgroup analyses were conducted to assess the difference in the association of the GRS with the incidence of T2D between groups defined by age (<65, ≥65 years), sex (male, female), serum total cholesterol (<5.7, ≥5.7 mmol/L), serum HDL cholesterol (<1.0, ≥1.0 mmol/L), serum triglycerides (<1.7, ≥1.7 mmol/L), BMI (≤25, >25 kg/m2), and the absence or presence of other environmental factors (Fig. 3). There was no evidence of significant heterogeneity in the magnitude of the association between subgroups of environmental factors (all P values >0.2 for interaction). The sensitivity analysis with the GRS using the European coefficient showed similar results (25).
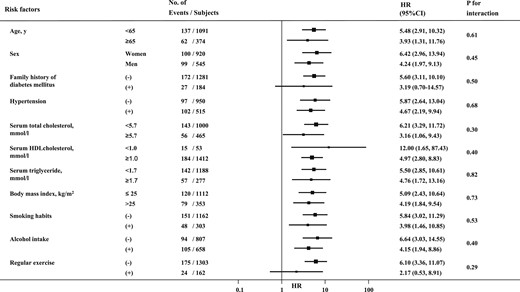
Comparisons of the influence of a GRS using a Japanese coefficient on the development of T2D between subgroups of environmental risk factors. The values are shown as HRs and their 95% CIs per 1 SD in GRS using a Japanese coefficient. The HRs were adjusted for age, sex, family history of diabetes mellitus, hypertension, serum total cholesterol, serum HDL cholesterol, serum triglycerides, use of lipid-modifying medication, BMI, smoking habits, alcohol intake, and regular exercise.
Next, we investigated whether the GRS using the Japanese coefficient would improve the prediction ability for T2D (Table 3). When the GRS using Japanese β was added to the statistical model including environmental risk factors—namely, age, sex, family history of diabetes mellitus, hypertension, serum total cholesterol, serum HDL cholesterol, serum triglycerides, use of lipid-modifying medication, BMI, smoking habits, alcohol intake, and regular exercise (i.e., the environmental risk model)—the C statistics significantly increased from 0.681 to 0.707 (P = 0.02). Furthermore, there were significant improvements in IDI and cNRI: 0.0376 (95% CI, 0.0284 to 0.0494; P < 0.001) and 0.3565 (95% CI, 0.1278 to 0.5829; P < 0.001), respectively. Significant improvements of IDI, cNRI, and categorical NRI were also observed when the GRS using the Japanese coefficient was added to the environmental risk model that also included FPG and 2hPG. A similar tendency was seen in the evaluation with the GRS using European β (25).
Improvement of the Risk Assessment Ability for the Development of T2D by Adding Contributions of GRS Using a Japanese Coefficient to the Environmental Risk Model
| Risk Model | Harrell C (95% CI) | P | IDI (95% CI) | P | cNRI (95% CI) | P | catNRI (95% CI) | P |
|---|---|---|---|---|---|---|---|---|
| Environmental risk model | 0.681 (0.645–0.717) | Ref. | Ref. | Ref. | Ref. | Ref. | Ref. | Ref. |
| Environmental risk model + GRS using a Japanese coefficient | 0.707 (0.672–0.742) | 0.02 | 0.0376 (0.0284–0.0494) | <0.001 | 0.3565 (0.1278–0.5829) | <0.001 | 0.0106 (−0.0752 to 0.0886) | 0.56 |
| Environmental risk model + FPG + 2hPG | 0.818 (0.791–0.845) | Ref. | Ref. | Ref. | Ref. | Ref. | Ref. | Ref. |
| Environmental risk model + FPG + 2hPG + GRS using a Japanese coefficient | 0.823 (0.796–0850) | 0.19 | 0.0182 (0.0082–0.0284) | <0.001 | 0.3051 (0.0815–0.5236) | 0.006 | 0.0576 (0.0178–0.0999) | 0.006 |
Categorical NRI (catNRI) was calculated using cutoff values of the tertiles of predicted risk with the environmental risk model during 10 years: 0.13 and 0.23 for the upper comparison, and 0.08 and 0.19 for the lower comparison.The environmental risk model included age, sex, family history of diabetes mellitus, hypertension, serum total cholesterol, serum HDL cholesterol, serum triglycerides, use of lipid-modifying medication, BMI, smoking habits, alcohol intake, and regular exercise.
Abbreviations: catNRI, categorical NRI; Ref., reference.
Discussion
In the current study, we demonstrated that elevated levels of the GRS developed for T2D were significantly associated with greater risk of incident T2D. There was no statistically significant interaction in the association between subgroups of environmental factors. When the analysis was restricted to subjects with normal glucose tolerance at baseline, there were no material differences in our findings. Intriguingly, the developed GRS significantly improved the prediction ability of the incidence of T2D from both the model with environmental risk factors and the model with blood glucose. This finding highlights the usefulness of the GRS for the risk assessment of T2D in the general Japanese population.
Several reports have shown a statistically significant difference in the influence of GRS between subgroups. In whites, the influence of genetic risk factors, especially the genetic risk factors for insulin secretion (31), on the development of T2D was shown to be greater in lean than in individuals who were obese/overweight (32, 33). Alternatively, the effects of the GRS on the risk of incident T2D were similar between people with and without obesity in a Japanese population (9). This finding is consistent with our results. The genetic information would be associated with the development of T2D, irrespective of environmental risk factors. Accordingly, impaired insulin secretion, which is mainly determined by genetic factors (34), might play a more important role in incident T2D in Asian populations than in their white counterparts.
A systematic review reported that the inclusion of genetic risk factors resulted in almost no improvement in the risk prediction of T2D compared with the model that just included the environmental risk factors (7). Because the number of genetic variants used in the genetic risk models ranged from 3 to 40, which is less than half of the total variants reported so far, the effects of some variants could have been lost. For example, recently, the risk allele in GIPR, which encodes the gastric inhibitory peptide receptor, was shown to diminish the effect of incretin, which is involved in a newly reported etiology associated with T2D (35, 36). The current study incorporated >80 SNPs in the GRS and achieved a significantly greater predictive ability than a model with known environmental risk factors including FPG and 2hPG. A comprehensive GRS would thus be helpful for individual assessment of the risk of T2D.
The strengths of our study include its longitudinal population-based design, longer duration of follow-up, and use of OGTT for the diagnosis of T2D. Additionally, we generated the comprehensive GRS by using >80 SNPs and coefficients reported in the Japanese population. However, some limitations should also be mentioned. First, the diagnosis of T2D was based on a single measurement, as has been the case in most other epidemiological studies. Therefore, participants with T2D might have been misdiagnosed in our study. Such misclassification could have weakened the association found in this study, biasing the results toward the null hypothesis. Second, the statistical power for detecting the significant gene–environmental interaction may have been limited by the small sample size and short duration of follow-up for incident T2D. Third, the generalizability of our findings is limited. Thus, further longitudinal studies with available genomic data using a similar methodology are needed to verify our findings.
In conclusion, the current study showed that a GRS generated for T2D was significantly associated with the risk of T2D independently of environmental risk factors. Additionally, the GRS improved the prediction of incident T2D from a model with environmental risk factors in a general Japanese population. These findings suggest that the GRS for T2D is a useful marker for predicting incident T2D in addition to environmental risk factors. Hence, the GRS may help in the risk stratification to identify Japanese individuals at a high risk of incident T2D, who are targeted for a prevention strategy. The effectiveness of the risk stratification using GRS for the prevention of T2D should be verified in further epidemiological studies and clinical trials.
Acknowledgments
The authors thank the residents of the town of Hisayama for participation in the survey and the staff of the Division of Health and Welfare of Hisayama for cooperation with this study. We also thank the staff of the Laboratory for Genotyping Development, RIKEN Center for Integrative Medical Sciences, for the genotyping and the Laboratory for Statistical Analysis, RIKEN Center for Integrative Medical Sciences, for the support of genetic analysis.
Financial Support: This work was supported by Ministry of Education, Culture, Sports, Science, and Technology of Japan Grants-in-Aid for Scientific Research (A) (JP16H02644 and JP16H02692), (B) (JP16H05850, JP16H05557, JP17H04126, and JP18H02737), (C) (JP16K09244, JP17K09114, JP17K09113, JP17K01853, JP18K07565, and JP18K09412), and (Early-Career Scientists) (JP18K17925 and JP18K17382); by Health and Labor Sciences Research Grants H29-Junkankitou-Ippan-003 and H30-Shokuhin-[Sitei]-005 of the Ministry of Health, Labor, and Welfare of Japan; and by Japan Agency for Medical Research and Development Grants JP18dk0207025, JP18ek0210082, JP18gm0610007, JP18ek0210083, JP18km0405202, JP18ek0210080, and JP18fk0108075.
Author Contributions: J.I. contributed to the data collection, data analysis, data interpretation, and drafting of the manuscript. Y.H. contributed to the study concept and design, data collection, data analysis, data interpretation, and drafting of the manuscript. M. Horikoshi, M.A., M. Higashioka, M.Y, Y.K., Y.M., N.M., and J.H. contributed to the data collection and data interpretation. M.K. and T.N. contributed to the study concept and design, data collection, and data interpretation, reviewed/edited the manuscript, and performed study supervision. All authors approved the final version of the manuscript.
Disclosure Summary: The authors have nothing to disclose.
Abbreviations:
- 2hPG
2-hour postload glucose
- BMI
body mass index
- cNRI
continuous NRI
- FPG
fasting plasma glucose
- GRS
genetic risk score
- GWAS
genome-wide association study
- HDL
high-density lipoprotein
- HR
hazard ratio
- IDI
integrated discrimination improvement
- NRI
net reclassification improvement
- OGTT
oral glucose tolerance test
- SNP
single-nucleotide polymorphism
- T2D
type 2 diabetes
References
Author notes
J.I. and Y.H. contributed equally to this study.
