


Abstract
Low testosterone levels are associated with an increased incidence of cardiovascular (CV) events, but the underlying biochemical mechanisms are not fully understood. The clinical condition of hypogonadism offers a unique model to unravel the possible role of lipoprotein-associated abnormalities in CV risk. In particular, the assessment of the functional capacities of high-density lipoproteins (HDLs) may provide insights besides traditional risk factors.
To determine whether reduced testosterone levels correlate with lipoprotein function, HDL cholesterol (HDL-C) efflux capacity (CEC) and serum cholesterol loading capacity (CLC).
Genetic and idiopathic hypogonadal patients (n = 20) and control subjects (n = 17).
Primary and secondary hypogonadal patients presented with lower HDL ATP-binding cassette transporter A1 (ABCA1)-, ATP-binding cassette transporter G1 (ABCG1)-, and aqueous diffusion-mediated CEC (−19.6%, −40.9%, and −12.9%, respectively), with a 16.2% decrement of total CEC. In the whole series, positive correlations between testosterone levels and both total HDL CEC (r2 = 0.359, P = 0.0001) and ABCG1 HDL CEC (r2 = 0.367, P = 0.0001) were observed. Conversely, serum CLC was markedly raised (+43%) in hypogonadals, increased, to a higher extent, in primary vs secondary hypogonadism (18.45 ± 2.78 vs 15.15 ± 2.10 µg cholesterol/mg protein) and inversely correlated with testosterone levels (r2 = 0.270, P = 0.001). HDL-C concentrations did not correlate with either testosterone levels, HDL CEC (total, ABCG1, and ABCA1) or serum CLC.
In hypogonadal patients, proatherogenic lipoprotein-associated changes are associated with lower cholesterol efflux and increased influx, thus offering an explanation for a potentially increased CV risk.
Cardiovascular disease (CVD) is the leading cause of death worldwide with a number of >17 million premature deaths in 2016 (1) and with a high occurrence of cardiovascular (CV) deaths before the age of 65 years in men (2). Among the possible players, the role of sex steroids is attracting increasing attention. Low levels of testosterone, the key hormone in the control of male puberty, fertility, and overall health, correlate with both CV risk and incidence of events, but whether this link reflects a causal relationship remains unclear (3). A potential explanation on the role of sex hormones in the control of CV risk can be provided by studies on lipoproteins in patients affected by hypogonadism, a clinical condition characterized by low levels of testosterone. Depending on the anatomical level where the defect occurs, hypogonadism can be classified as primary when caused by testicular failure or secondary/central when a result of hypothalamic or pituitary dysfunction (4). If not promptly diagnosed and treated, affected individuals are exposed to various comorbidities, including type 2 diabetes, which might differ according to etiopathogenesis and age of onset (5). Hypogonadal males affected by Klinefelter syndrome (the most common form of testicular failure) (6) have shown, in a limited number of studies, lower levels of high-density lipoprotein cholesterol (HDL-C) (7), which from a cross-sectional study, may be reduced after testosterone replacement (8).
HDL-C is inversely associated with both CVD and mortality across a wide range of concentrations, thus representing a well-established protective factor (9). Whereas studies conducted in hypogonadal conditions have shown a reduction of HDL-C after testosterone replacement (8, 10), observational studies have also reported that HDL-C concentrations are predominantly lowered in cases reaching supranormal testosterone concentrations (11). As pharmacological interventions aimed at raising HDL-C levels have not generally supported a beneficial effect on CV outcomes (12, 13), changes occurring after testosterone therapy still have an unclear role in CV occurrence/prevention.
Recent data have shown that HDL-C levels per se may not be a reliable indicator of CV risk. Instead, the functional capacity of HDL, i.e., the cholesterol efflux capacity (CEC), can provide an independent predictive value (14). Very recently, reduced serum CEC was shown to be associated with mortality in patients with –ST elevation myocardial infarction (15). These findings clearly underline the need to focus on HDL function, rather than on HDL-C levels (16). Indeed, the association between HDL CEC and CV risk is well maintained after adjustment for conventional risk factors (17, 18). Moreover, as lipid trafficking is a balance between cholesterol efflux and influx—the latter leading to direct cholesterol accumulation in arterial macrophages (19)—the serum cholesterol loading capacity (CLC) represents another index of atherogenicity. It is, in fact, raised in pathological conditions leading to a higher CV risk (20).
In light of present knowledge on CVD risk factors in genetic and nongenetic male hypogonadism and in particular, on the uncertain role of testosterone in these processes, the current study aimed at the evaluation of lipoprotein function, e.g., HDL CEC and serum CLC, in a series of hypogonadal men.
Methods
Study participants
Hypogonadal men (n = 20) were selected among patients admitted to our Outpatient Department, presenting with signs/symptoms of hypogonadism, associated with low testosterone levels. Specifically, seven patients were affected by primary hypogonadism, as demonstrated by high levels of gonadotropins (four with Klinefelter syndrome, one with congenital primary anorchia, and two with idiopathic acquired primary hypogonadism with testicular hypoplasia). The remaining 13 were affected by central hypogonadism (21) and low/inappropriately normal levels of gonadotropins (five with Kallmann syndrome and eight with isolated hypogonadotropic hypogonadism). None had undergone testosterone replacement therapy. Healthy men (n = 17), age and body mass index (BMI) matched, were selected as controls. The study was performed in accordance with the ethical principles in the Declaration of Helsinki for experiments involving humans. The study protocol received approval from the local Ethics Committee (CI_130). Written, informed consent was obtained from all study participants or their tutors.
Genetic analyses by targeted next-generation sequencing
Each patient with isolated hypogonadotropic hypogonadism underwent a genetic investigation, using a targeted next-generation sequencing technique, to search for rare allelic variants. We extracted the genomic DNA of each patient from peripheral blood lymphocytes using Gene Catcher genomic DNA 96 × 10 ml Automated Blood Kit (Invitrogen, Life Technologies, Carlsbad, CA). The isolated hypogonadotropic hypogonadism gene panel was designed using Illumina Design Studio (San Diego, CA) and included the following idiopathic hypogonadotropic hypogonadism (IHH) candidate genes: ANOS1(KAL1), FGFR1, PROKR2, PROK2, GNRHR, GNRH1, GNRH2, KISS1, KISS1R, TAC3, TACR3, HS6ST1, FGF8, CHD7, DUSP6, FEZF1, FGF17, FLTR3, IL17, SEMA3A, SEMA3E, SEMA7A, SOX2, SOX10, SPRY4, WDR11, HESX1, NELF. The 28 IHH genes consistently represented in all sequence capture panels were assessed for the purposes of this study. Libraries were prepared using Illumina Nextera Rapid Capture Custom Enrichment kits, according to the manufacturer’s protocols. All regions not correctly sequenced were recovered with the NexteraVR DNA Library Preparation Kit (Illumina). For subsequent analyses, we included as “rare variants” all known pathogenic or rare nonsynonymous or splicing-site variants (minor allele frequency ≤ 0.01) and novel nonsynonymous or splicing-site variants. The frequency and the functional annotation of the identified variants were checked in public and licensed databases (Ensembl, UCSC Genome Browser, 1000 Genome Project, ExAC Browser, National Center for Biotechnology Information, Human Gene Mutation Database professional, GnomAD), considering the ethnic groups (Europeans). As previously reported in de Filippis et al. (22), we excluded common nonsynonymous variants with minor allele frequency > 0.01, and synonymous, intronic, and 5′- or 3′-untranslated region variants. Each variant found was confirmed by Sanger direct sequencing using BigDyeVR Terminator v. 3.1 Cycle Sequencing Kit (Life Technologies) on a 3100 DNA Analyzer from Applied Biosystems (Foster City, CA).
Biochemical, hormonal, and anthropometric parameters
Fasting blood samples were drawn in the morning before 10 am and serum stored at −80°C for CEC and CLC assessment. Serum lipids, e.g., total cholesterol, low-density lipoprotein cholesterol (LDL-C), HDL-C, and triglycerides (TG) were determined by established methodologies, as carried out in the laboratory of the institution. LDL-C was calculated indirectly according to the Friedewald formula when the TG were <400 mg/dL. Serum luteinizing hormone (LH), follicle-stimulating hormone (FSH), and testosterone concentrations were measured by the electrochemiluminescence immunoassay “ECLIA” from Roche Diagnostics (Roche Diagnostics, Mannheim, Germany). LH and FSH assays had a lower limit of detection of 0.1 IU/L and a functional sensitivity of 0.2 IU/L. Elecsys® Testosterone II test (Calibrator Reference: 05200067 190) had a lower limit of detection of 0.087 nM and a functional sensitivity of 0.4 nM. The inter- or intra-assay coefficients of variation were <5%. Testosterone method was standardized via isotope dilution–gas chromatography/mass spectrometry (MS). BMI and waist circumference were calculated as kilograms per square meter and centimeter, respectively.
Testosterone and estradiol evaluation by MS
LC-MS/MS analysis
Testosterone was purchased from Sigma-Aldrich (Milan, Italy). 13C3-17β-Estradiol (2 ng/sample) was obtained from CDN Isotope Pointe-Claire (Pointe-Claire, QC, Canada). Solid-phase extraction cartridges (Discovery DS-C18 500 mg) were from Supelco (Milan, Italy). All solvents and reagents were HPLC grade (Sigma-Aldrich). Positive atmospheric pressure chemical ionization experiments were performed with a linear ion trap–mass spectrometer (LTQ; Thermo Fisher Scientific, Waltham, MA) using nitrogen as sheath, auxiliary, and sweep gas. The instrument was equipped with a Surveyor liquid chromatography (LC) Pump Plus and a Surveyor Autosampler Plus (Thermo Fisher Scientific). The mass spectrometer was used in a MS/MS mode using helium as collision gas. The LC mobile phases were (A) H2O/0.1% formic acid and (B) methanol (MeOH)/0.1% formic acid. The gradient (flow rate 0.5 mL/min) was as follows: T0 70% A, T1.5 70% A, T2 55% A, T3 55% A, T35 36% A, T40 25% A, T41 1% A, T45 1% A, T45.2 70% A, T55 70% A. The split valve was set at 0 to 6.99 minutes to waste, 6.99 to 43.93 minutes to source, and 43.93 to 55 to waste. The Hypersil Gold column (100 × 3 mm, 3 μm; Thermo Fisher Scientific) was maintained at 40°C. The injection volume was 25 μL, and the injector needle was washed with MeOH/water 1:1 (v/v). Peaks of the LC-MS/MS were evaluated using a Dell workstation by means of the software Excalibur® Release 2.0 SR2 (Thermo Fisher Scientific). In brief, serum samples were added with internal standards and mixed in 2 mL MeOH/acetic acid (99:1 v/v). After an overnight extraction at 4°C, samples were centrifuged at 15,300 g for 5 min, and the pellet was extracted twice with 1 mL MeOH/acetic acid (99:1 v/v). The organic phases were combined and dried with a gentle stream of nitrogen in a 40°C water bath. The samples were resuspended with 3 mL MeOH/H2O (10:90 v/v) and passed through a solid-phase extraction cartridge, previously activated with MeOH (5 mL) and MeOH/H2O 1:9 v/v (5 mL); steroids were eluted in MeOH, concentrated, and transferred in autosampler vials before the LC-MS/MS analysis. Quantitative analysis was performed on the basis of calibration curves prepared and analyzed daily: blank samples (6% albumin in PBS) were spiked with internal standard. Increasing amounts (0.05 to 5 ng/sample) of testosterone were added. Standard curves (eight concentration levels) were fitted by linear regression equation: y = ax + b. Calibration curves were extracted and analyzed, as described above, for samples. Limits of quantification, precision, and accuracy of the assays have been previously reported (23).
HDL CEC
The HDL fraction was isolated from serum by the precipitation of apoB-containing lipoproteins with polyethylene glycol (24). To avoid any lipoprotein remodeling, sera were slowly defrosted in ice immediately before this procedure (20). HDL CEC, occurring through the main pathways (25, 26), was evaluated by a standardized and a widely used radioisotopic technique, as previously described (15, 16, 27).
Total, aqueous diffusion, and ABCA1 CEC
We evaluated total CEC (tCEC) and its major contributors, aqueous diffusion and ATP-binding cassette transporter A1 (ABCA1)-mediated efflux, in the J774 murine macrophage cell model. In particular, cells in basal conditions were used to evaluate aqueous diffusion, whereas cells incubated with a cAMP analog (cpt-cAMP 0.3 mM; Sigma-Aldrich), inducing ABCA1 expression, were used to measure HDL tCEC. The specific ABCA1-mediated efflux contribution was calculated as the difference between tCEC and aqueous diffusion CEC. J774 macrophages were grown in 10% fetal calf serum (FCS) containing DMEM (both FCS and DMEM from Lonza, Verviers, Belgium) in the presence of antibiotics (penicillin–streptomycin from Thermo Fisher Scientific). Cells were then labeled with [1,2-3H] cholesterol at 2 µCi/mL (PerkinElmer, Waltham, MA) for 24 hours in the presence of 2 µg/mL of an inhibitor of the cholesterol-esterifying enzyme acyl-coenzyme A:cholesterol acyltransferase (Sandoz 58035; Sigma-Aldrich) to prevent accumulation of cholesteryl esters. J774 cells were incubated in the absence or presence of the cAMP analog in 0.2% BSA-containing medium for 18 hours (BSA from Sigma-Aldrich). Cells were then exposed for 4 hours to the HDL fraction of sera from either control or hypogonadal subjects at 2% (v/v) in medium. HDL CEC was expressed as the percentage of radiolabeled cholesterol released into the medium over total radioactivity incorporated by cells. To check for adequate cell responsiveness, lipid-free human apoA-I (Sigma-Aldrich) and the HDL fraction of a standard serum obtained from a pool of normolipidemic subjects were tested together with serum samples in each assay. The relative CEC values were used to normalize the different experiments to correct for the interassay variability. Intra-assay variation coefficients for HDL CEC assays were <10%.
ABCG1 CEC
Serum HDL CEC mediated by the ATP-binding cassette transporter G1 (ABCG1) was evaluated by using Chinese hamster ovary (CHO) cells, transfected and not transfected with the human ABCG1 gene. The specific ABCG1 contribution was calculated as the difference between CEC obtained in ABCG1-transfected cells and CEC obtained in nontransfected cells. Specifically, CHO cells were cultured in 10% FCS containing Ham’s F-12 (both from Lonza) in the presence of antibiotics (Zeocin and Geneticin from Thermo Fisher Scientific). CHO cells, after labeling with [1,2-3H] cholesterol at 1 µCi/mL, underwent an equilibration period in 0.2% BSA-containing medium for 90 minutes. Cells were successively exposed for 6 hours to the HDL fraction of sera from either control or hypogonadal subjects at 1% (v/v) in medium. HDL CEC was expressed as the percentage of radiolabeled cholesterol released to the medium over total radioactivity incorporated by cells. To check for adequate cell responsiveness, human-isolated HDL and the HDL fraction of a standard serum obtained from a pool of normolipidemic subjects were tested together with the serum samples in each assay. Human-isolated HDL (d = 1.063 − 1.21 g/mL) was purified by sequential ultracentrifugation from the plasma of healthy volunteers. The relative CEC values were used to normalize the different experiments to correct for the interassay variability. Intra-assay variation coefficients for HDL CEC assays were <10%.
Serum CLC
To avoid any lipoprotein remodeling, sera were slowly defrosted in ice immediately before CLC measurement (20). Whole-serum CLC was evaluated on human monocyte-derived macrophages THP-1 with a fluorometric technique (28). Human THP-1 monocytes were grown in 10% FCS containing RPMI (both from Lonza) in the presence of antibiotics (penicillin–streptomycin). Cells were plated in the presence of 100 ng/mL phorbol 12-myristate 13-acetate (Sigma-Aldrich) for 72 hours to allow differentiation into macrophages. Cells were then incubated with 5% lipoprotein-deficient serum (Sigma-Aldrich) for 24 hours and exposed for 24 hours to 10% (v/v) of whole serum from controls and from hypogonadal patients. At the end of incubation, cell monolayers were lysed in 1% sodium cholate solution (Sigma-Aldrich), supplemented with 10 U/mL DNase (Sigma-Aldrich). Cholesterol was then measured fluorometrically using the Amplex Red Cholesterol Assay Kit (Molecular Probes, Eugene, OR) following the manufacturer’s instructions. An aliquot of cell lysates was used to measure cell proteins by the bicinchoninic acid assay (Thermo Fisher Scientific). CLC was expressed as micrograms of cholesterol/milligram of protein. To check for adequate cell responsiveness, sera obtained from pools of normolipidemic and hypercholesterolemic subjects were tested together with serum samples in each assay. The relative CLC values were used to normalize the different experiments to correct for interassay variability. Intra-assay variation coefficients for the CLC assays were <10%.
Statistical analyses
Sample size was calculated a priori by using the G*Power software selecting two-tailed t test, the difference between two independent means, and a priori power analysis, fixing a power of 0.95 and a significance level of 0.05. Sample size was found to be at least 10 subjects per group (26). Statistical analyses were performed using GraphPad Prism version 6.0 (GraphPad Software, La Jolla, CA). Each sample was run in triplicate. Data were expressed as means ± SEM. Differences in CEC and CLC between control and hypogonadal groups were evaluated by using the unpaired two-tailed Student t test or Mann-Whitney test for parameters with normal and skewed distribution, respectively. When necessary, differences between groups were evaluated by nonparametric Kruskal-Wallis one-way ANOVA analysis. The relationship between parameters was assessed by linear-regression analysis and the correlation coefficient (r2) was reported. Significant differences were defined as P < 0.05.
Results
Hypogonadal patients show a normal lipid profile
The hypogonadal patients underwent genetic characterization by next-generation sequencing for causative genes related to isolated hypogonadotropic hypogonadism (Table 1). To assess whether hypogonadal men had an altered lipid profile, clinical and biochemical parameters were evaluated (Table 2). All hypogonadal subjects presented with average low testosterone levels (4.21 ± 0.86 nM; normal range 9.9 to 27.8) compared with controls with levels in the eugonadal range (15.96 ± 1.50 nM) (4). Testosterone quantification was confirmed by LC-MS/MS analysis (Table 2), and the direct correlation with data obtained with immunoassay was: r2 = 0.833, P < 0.0001. No differences were found in estradiol-circulating levels between hypogonadals and eugonadals, i.e., 45.4 ± 0.21 pM vs 52.9 ± 0.20 pM, respectively. Normal/low gonadotropins were detected in patients with secondary hypogonadism, such as Kallmann syndrome or isolated hypogonadotropic hypogonadism (LH 1.34 ± 0.42 IU/L, normal range 1.7 to 8.6; FSH 1.81 ± 0.50 IU/L, normal range 1.5 to 12.4; Table 3). Levels were instead high, as expected, in patients with primary hypogonadism, such as Klinefelter syndrome or other primary hypogonadisms (LH 27.8 ± 7.2 IU/L, normal range 1.7 to 8.6; FSH 41.7 ± 9.23 IU/L, normal range 1.5 to 12.4; Table 3). When the lipid profile (total cholesterol, HDL-C, LDL-C, and TG) was evaluated, no statistically significant differences were found between the hypogonadal patients and controls. When examining the primary and secondary forms (Table 3), significantly higher total (not LDL) cholesterol was noted in the former, however within normal limits. No patient had a diagnosis of diabetes (mean blood glucose 94 mg/dL); mean prostate-specific antigen was 0.52 (ng/mL) and hematocrit 44%.
Genetic Characterization of the Patient Cohort
| Diagnosis | Karyotype | Next-Generation Sequencing for IHH Known Causal Genes | ||||
|---|---|---|---|---|---|---|
| Gene | Allelic Variant | Exon | cDNA | Protein | ||
| Klinefleter | 47,XXY | n/a | ||||
| Klinefleter | 47,XXY | n/a | ||||
| Klinefleter | 47,XXY | n/a | ||||
| nIHH | 46,XY | Absence of significant allelic variants | ||||
| Kallmann | 46,XY | PROKR2 | Heterozygous | 2 | 472G>A | V158I |
| Kallmann | 46,XY | GnRHR | Homozygous | 1 | 35delA | N12IfsX11 |
| Kallmann | 46,XY | FGFR1 | Heterozygous | 16 | 2153G>A | R718H |
| Kallmann | 46,XY | FGFR1 | Heterozygous | 9 | 1203insT | G402WfsX6 |
| nIHH | 46,XY | Absence of significant allelic variants | ||||
| nIHH | 46,XY | Absence of significant allelic variants | ||||
| nIHH | 46,XY | CHD7 | Heterozygous | 3 | 2053_2058dupGCAAAA | K686_T687insAK |
| nIHH | 46,XY | SPRY4 | Heterozygous | 3 | 653A>G | N218S |
| SEMA3A | Heterozygous | 17 | 1910G>A | R637H | ||
| Kallmann | 46,XY | Absence of significant allelic variants | ||||
| CA | 46,XY | n/a | ||||
| nIHH | 46,XY | FLRT3 | Heterozygous | 3 | 1255A>T | T419S |
| nIHH | 46,XY | PROK2 | Heterozygous | 1 | 2T>G | M1R |
| nIHH | 46,XY | Absence of significant allelic variants | ||||
| IAPH | 46,XY | n/a | ||||
| Klinefleter | 47,XXY | n/a | ||||
| IAPH | 46,XY | n/a | ||||
Abbreviations: CA, congenital idiopathic anorchia; IAPH, idiopathic acquired primary hypogonadism; Kallmann, Kallmann syndrome; Klinefelter, Klinefelter syndrome; n/a, not applicable; nIHH, normosmic IHH.
Clinical and Biochemical Characteristics of Hypogonadal Patients and Control Subjects
| Control Subjects | Hypogonadal Subjects | P Value | |
|---|---|---|---|
| Age, y | 41 ± 6 | 36 ± 4 | 0.287 |
| BMI, kg/m2 | 22.8 ± 0.8 | 24.7 ± 7.8 | 0.157 |
| Waist circumference, cm | 84.04 ± 3.04 | 91.45 ± 3.52 | 0.118 |
| LH, IU/L | 5.97 ± 0.96 | 11.70 ± 4 | 0.641 |
| FSH, IU/L | 4.95 ± 0.78 | 17.10 ± 5.1 | 0.933 |
| TTe immunoassay, nM | 15.96 ± 1.50 | 4.21 ± 0.86 | <0.0001 |
| TTe LC-MS/MS, nM | 11.78 ± 1.04 | 5.00 ± 0.67 | <0.0001 |
| TC, mg/dL | 197 ± 8 | 180 ± 7 | 0.473 |
| HDL-C, mg/dL | 54 ± 12 | 63 ± 20.1 | 0.101 |
| LDL-C, mg/dL | 107 ± 28 | 89 ± 8 | 0.114 |
| TG, mg/dL | 110 ± 15 | 115 ± 13 | 0.525 |
Values are indicated as means ± SEM. Significant differences are shown in boldface.
Abbreviations: TC, total cholesterol; TTe, testosterone.
Clinical and Biochemical Characteristics of Hypogonadal Patients According to the Diagnosis and Levels of TTe
| Primary Hypogonadism, Range TTe = 0.6–11.50 nM | Secondary Hypogonadism, Range TTe = 0.15–6.90 nM | P Value | |
|---|---|---|---|
| Numerosity | 7 | 13 | |
| Age, y | 42 ± 7 | 33 ± 4 | 0.601 |
| BMI, kg/m2 | 26.30 ± 0.93 | 23.5 ± 1.5 | 0.391 |
| Waist circumference, cm | 97.57 ± 3.08 | 88.15 ± 5.01 | 0.361 |
| LH, IU/L | 27.8 ± 7.2 | 1.34 ± 0.42 | <0.0001 |
| FSH, IU/L | 41.7 ± 9.23 | 1.81 ± 0.50 | <0.0001 |
| TC, mg/dL | 191 ± 11 | 166 ± 9 | 0.044 |
| HDL-C, mg/dL | 56 ± 21 | 65 ± 20 | 0.382 |
| LDL-C, mg/dL | 109 ± 13 | 83 ± 12 | 0.118 |
| TG, mg/dL | 107 ± 16 | 116 ± 21 | 0.832 |
Values are indicated as means ± SEM. Significant differences are shown in boldface.
Hypogonadism reduces CEC
To assess whether hypogonadism compromises HDL function, despite the normal lipid profile, HDL tCEC of sera from hypogonadal patients vs eugonadal controls was evaluated by using a model of cAMP-stimulated J774 macrophages. The presence of hypogonadism was associated with 16.2% lower HDL tCEC (P < 0.0001; Fig. 1A). Accordingly, when the two main contributors to tCEC, i.e., ABCA1 and aqueous diffusion, were considered, the hypogonadal status induced a significant −19.6% drop in ABCA1-mediated CEC (P = 0.0012; Fig. 1B) and a −12.9% reduction in aqueous diffusion CEC (P = 0.0128; Fig. 1D). Moreover, hypogonadal patients showed a marked impairment in the ABCG1-mediated CEC compared with controls (−40.9%, P < 0.0001; Fig. 1C), as evaluated in CHO cells overexpressing or not expressing the ABCG1 transporter. With the separate analysis of controls and primary and secondary hypogonadal patients, CEC values in both cases were significantly reduced (Fig. 2A–2C), except for aqueous-diffusion CEC. A comparison of CECs between primary and secondary hypogonadal patients did not show any significant difference (Fig. 2A–2D).
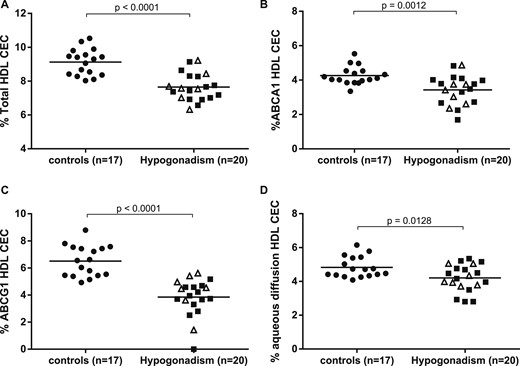
HDL CEC was reduced in hypogonadal patients. In control subjects and in patients with hypogonadism, (A) total HDL CEC, (B) ABCA1-mediated CEC, (C) ABCG1-mediated CEC, and (D) aqueous diffusion CEC have been assessed by using (A, B, and D) J774 murine macrophages and (C) CHO cells. Each point of the scatter plot represents the mean of triplicate analyses of each serum sample. Empty triangles (∆) and solid squares (■) refer to CEC values of primary and secondary hypogonadisms, respectively. The horizontal, solid line is the mean of each group. Differences in CEC between control and hypogonadal groups were evaluated by use of the unpaired two-tailed Student t test or Mann-Whitney test for parameters with normal and skewed distribution, respectively. Significant differences were defined as P < 0.05.
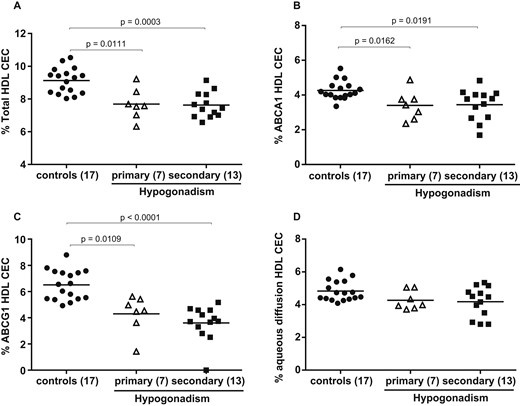
HDL CEC by separate analysis of controls and primary and secondary hypogonadal patients. In control subjects and in patients with hypogonadism, (A) total HDL CEC, (B) ABCA1-mediated CEC, (C) ABCG1-mediated CEC, and (D) aqueous diffusion CEC have been assessed by use of (A, B, and D) J774 murine macrophages and (C) CHO cells. Empty triangles (∆) and solid squares (■) refer to CEC values of primary and secondary hypogonadism, respectively. The horizontal solid line is the mean of each group. Each point of the scatter plot represents the mean of triplicate analysis of each sample. Differences between groups were evaluated by nonparametric Kruskal-Wallis one-way ANOVA analysis. Significant differences were defined as P < 0.05.
Hypogonadism raises CLC
As cell cholesterol content is the end result of cholesterol efflux and influx, evaluation of the proatherogenic potential of whole serum was evaluated by the determination of CLC in human monocyte-derived macrophages THP-1. CLC was found to be markedly and significantly raised (+43%, P < 0.0001) in patients with hypogonadism compared with controls (Fig. 3A). Then, with the separate analysis of CLC in controls and primary and secondary hypogonadisms, we found a significant increase in both cases compared with controls (Fig. 3B). Furthermore, sera from patients with primary hypogonadisms had a significantly higher CLC compared with patients with secondary hypogonadisms (18.45 ± 2.78 vs 15.15 ± 2.10 µg cholesterol/mg protein, respectively, P = 0.019; Fig. 3B).

CLC was increased in hypogonadal patients. In control subjects and in patients with hypogonadism, CLC was evaluated by using human monocyte-derived macrophages THP-1. Each point of the scatter plot represents the mean of triplicate analyses of each serum sample. Empty triangles (∆) and solid squares (■) refer to CLC values of primary and secondary hypogonadisms, respectively. The horizontal solid line is the mean of each group. (A) Differences in CLC between control and hypogonadal groups were evaluated by use of the unpaired two-tailed Student t test. Significant differences were defined as P < 0.05. (B) Differences between groups were evaluated by nonparametric Kruskal-Wallis one-way ANOVA analysis. Significant differences were defined as P < 0.05.
Testosterone levels correlate with HDL CEC and CLC
To evaluate a possible relationship between lipoprotein function and testosterone levels, a comparative analysis of the two groups, i.e., controls and hypogonadal men, was performed. A direct correlation between testosterone and both HDL tCEC and ABCG1 CEC (tCEC: r2 = 0.359, P = 0.0001; ABCG1 CEC: r2 = 0.367, P = 0.0001) was observed (Fig. 4A and 4B). HDL-C concentrations did not instead correlate either with tCEC (r2 = 0.017, P = 0.439), ABCA1 CEC (r2 = 0.065, P = 0.138), ABCG1 CEC (r2 = 0.007, P = 0.872), and testosterone (r2 = 0.074; P = 0.113) levels or CLC (r2 = 0.009, P = 0.565). Conversely, HDL levels correlated with aqueous diffusion CEC (r2 = 0.269, P = 0.001). Finally, the raised serum CLC appeared to be inversely correlated with testosterone (r2 = 0.270, P = 0.001; Fig. 4C) but not with LDL-C (r2 = 0.015; P = 0.487) levels. Similar results were found when testosterone levels were determined by LC-MS/MS analysis (Fig. 4D–4F).

Testosterone serum levels correlate with HDL CEC and CLC. Results of linear regression analyses of (A–C) total and ABCG1 HDL CEC and serum CLC with testosterone serum levels evaluated by immunoassay and (D–F) LC-MS/MS are reported in controls and patients with hypogonadisms (●, control subjects; ○, Klinefelter syndrome patients; □, other primary hypogonadal patients; ■, secondary hypogonadal patients). The relationship between serum lipoprotein functions and testosterone levels was assessed by linear-regression analysis, and the correlation coefficient (r2) is reported. Significance was defined as P < 0.05.
Discussion
Aimed at the evaluation of possible differences in HDL function between genetic and idiopathic hypogonadism and healthy controls, the current study showed marked alterations in the efflux/loading capacities, i.e., HDL CEC and serum CLC. The HDL ABCA1-, ABCG1-, and aqueous diffusion-mediated CECs were reduced by 19.6%, 40.9%, and 12.9%, respectively, and tCEC by 16.2%. CEC is a measure of the HDL antiatherogenic activity, generally identified as a CV-risk biomarker, independent of HDL-C concentrations (29). CLC, a marker of the serum CLC of macrophages, linked to an enhanced atherosclerosis risk, was instead raised by 43% (19, 20).
Our studied population of hypogonadal patients had a lipoprotein profile within the range of normality, similar to controls; indeed, hypogonadal males presented with nonstatistically higher HDL-C levels. These findings are in contrast with previous cross-sectional and prospective observational studies, showing that hypogonadism or low testosterone levels are accompanied by a proatherogenic lipid profile, with higher LDL-C and lower HDL-C compared with healthy controls (30). The lipid profile within normal limits observed in our patients may be related to the absence of clear-cut obesity (Table 2). Obesity, in itself, can, in fact, reduce circulating testosterone, because of raised adipose tissue aromatase activity, leading to an enhanced conversion of testosterone to estradiol (31). In this series of patients with Kallmann and Klinefelter syndromes, anorchia, and other acquired primary hypogonadism, the absence of obese individuals was associated with nonimportant differences in estrogen levels, ruling out any substantial influence of raised aromatase (31). In this series, abdominal circumferences were also within normal limits.
Low HDL-C levels are an established CV-risk marker, as reported in the major CV guidelines (9, 32). However, the nonimportant CV-preventive efficacy of treatments raising HDL-C levels (33), in spite of multiple drug effects involving not only HDL-C raising but also pleiotropic effects on fibrinolysis (34, 35), inflammation, and others (36), has clearly indicated that HDL-C per se may not be a major determinant of CV risk. HDL function is now rated as a more meaningful approach to risk evaluation (16). Our hypogonadal patients, characterized by very low testosterone, with HDL-C levels in the normal range, showed a marked reduction in HDL CEC, as well as raised serum CLC.
Impairment of tCEC has been associated with the highest inverse correlation with incidence and prevalence of CVD (16). Hypogonadal patients showed lower HDL CEC by both the ABCA1 and ABCG1 pathways, despite HDL-C levels in the normal range, thus confirming that a mere measurement of HDL-C levels has clear limitations in assessing function. In a previous report from hypogonadal men, testosterone replacement did not alter total HDL-C but clearly modified the HDL proteome, raising paroxonase-1 and fibrinogen-α-chain, as well as reducing apolipoprotein A-IV—this last, a change of unclear significance (37). The impairment of HDL CEC in our population may therefore be related to specific hypogonadism-associated compositional changes in the protein or phospholipid cargo of HDL, known to affect HDL CEC (38).
The controversial correlation between testosterone deficiency and lipoprotein-associated CV risk, reported in epidemiological studies, is not well supported by deprivation findings (39). Middle-aged subjects, medically castrated by the gonadotropin-releasing hormone antagonist acyline, had important HDL-C rises, without changes in efflux capacity (40); the same procedure, instead, increased both HDL-C and CEC in young healthy men (41). Our findings, from naïf hypogonadal patients, indicate a reduction in HDL CEC in a clearly different experimental setting, i.e., a natural model of hypogonadism vs pharmacological castration. This implies a different timing of exposure to low testosterone (chronic exposure vs a relatively acute exposure in pharmacological castration) with a consequently different impact on the lipoprotein profile. Moreover, mean levels of circulating testosterone in our hypogonadal patients were markedly reduced compared with the pharmacological deprivation study (4.2 nM compared with 7.7 nM). The observed impairment of ABCA1 and ABCG1 CEC could also reflect a relative reduction of the amounts and/or efficiency of either small or large HDL (42, 43). The important decrement in HDL function may thus suggest that an additional HDL remodeling (44) may occur in hypogonadism. Indeed, testosterone treatment is associated with a specific increase in the mature subfraction of HDL, i.e., mostly HDL2 (45, 46), responsible for the CEC mainly through ABCG1 (43). As macrophage cholesterol accumulation is the end result of efflux-influx processes, determination of CLC is essential to evaluate the net impact of hypogonadism on the overall serum atherogenic properties. The observed substantial increase in CLC from hypogonadal patients clearly indicates that the likely rise of arterial wall foam-cell formation may contribute to a higher CV risk (19, 20).
Hypogonadisms can be classified into primary or secondary, caused by either testicular failure or hypothalamic/pituitary dysfunction, respectively (4). Despite no differences in HDL CEC between the two hypogonadisms, sera from the primary hypogonadal patients were associated with a higher proatherogenic potential compared with sera from secondary hypogonadal patients. The higher CLC levels in Klinefelter patients are most likely associated with a proatherogenic lipoprotein pattern, as also supported by a recent review (47), indicating that these patients have an increased risk of developing leg thrombosis or ulcers, even in the absence of any triggering factor. In a larger cohort of Klinefelter syndrome (832 subjects), a more frequent incidence of ischemic heart disease, peripheral vascular disease, pulmonary embolism, and even intestinal thrombosis was reported (48). There is, conversely, no increased CV risk in Kallmann patients (49), although a late diagnosis might expose patients to comorbidities related to chronic hypogonadism, leading to the need of rehabilitation programs (50).
The well-established impact of nondrug-related hypogonadism on HDL CEC and serum CLC, shown in the current study, provides an important indication for further confirmatory evaluations, also in other populations. Whereas it is reasonable to hypothesize that structural changes in HDL might be responsible for the alterations of HDL function, our study had the limit of not having tested HDL structure/composition. The evaluated patients are now undergoing testosterone-replacement therapy, and cholesterol fluxes will be re-evaluated after hormonal normalization.
In conclusion, these findings demonstrate that both central and primary hypogonadisms are associated with an impaired HDL function, measured as CEC, and with an increased proatherogenic potential of serum, as witnessed by a raised CLC. These effects occurred in the absence of any evident change in the serum lipoprotein profile. Derangements in lipoprotein function may translate into an increased atherogenic risk, adding important insights into possible preventive strategies aimed at reducing CV risk in hypogonadal patients, at least in those of genetic and idiopathic origins.
Acknowledgments
Financial Support: This work was partially supported by IRCCS Istituto Auxologico Italiano (Ricerca Corrente funds; Grant Number O5C202_2012) to M.B.; Fondazione Cariplo (Grant Number 2015-0552) to M.R.; Intramural Grant Piano Sostegno alla Ricerca (Università degli Studi di Milano) to A.C. (PSR2015-1716GRACA02_14_M) and M.R. (PSR 2018 M RUSCICA); and Fondazione Carlo Sirtori (Milan, Italy; 2019) to C.R.S.
Disclosure Summary: The authors have nothing to disclose.
Abbreviations:
- ABCA1
ATP-binding cassette transporter A1
- ABCG1
ATP-binding cassette transporter G1
- BMI
body mass index
- CEC
cholesterol efflux capacity
- CHO
Chinese hamster ovary
- CLC
cholesterol loading capacity
- CV
cardiovascular
- CVD
cardiovascular disease
- FCS
fetal calf serum
- FSH
follicle-stimulating hormone
- HDL
high-density lipoprotein
- HDL-C
high-density lipoprotein cholesterol
- IHH
idiopathic hypogonadotropic hypogonadism
- LC
liquid chromatography
- LDL
low-density lipoprotein
- LDL-C
low-density lipoprotein cholesterol
- LH
luteinizing hormone
- MS
mass spectrometry
- tCEC
total cholesterol efflux capacity
- TG
triglycerides
References
Author notes
M.P.A. and F.Z. contributed equally to this study.
M.B. and M.R. are co-last authors.
