


Abstract
HbA1c levels are higher in blacks than non-Hispanic whites (NHWs). We investigated whether genetics could explain this difference in Diabetes Prevention Program (DPP) participants.
We tested (i) genetic variants causing hemoglobinopathies, (ii) a genetic risk score (GRS) based on 60 variants associated with HbA1c from genome-wide association meta-analysis, and (iii) principal component (PC) factors that capture continental ancestry derived from genetic markers distributed across the genome.
Of 2658 eligible DPP participants, 537 (20%) self-identified as black and 1476 (56%) as NHW. Despite comparable fasting and 2-hour glucose levels, blacks had higher HbA1c (mean ± SD = 6.2 ± 0.6%) compared with NHWs (5.8 ± 0.4%; P < 0.001). In blacks, the genetic variant causing sickle cell trait was associated with higher HbA1c [β (SE) = +0.44 (0.08)%; P = 2.1 × 10⁻⁴]. The GRS was associated with HbA1c in both blacks and NHWs. Self-identified blacks were distributed along the first PC axis, as expected in mixed ancestry populations. The first PC explained 60% of the 0.4% difference in HbA1c between blacks and NHWs, whereas the sickle cell variant explained 16% and GRS explained 14%.
A large proportion of HbA1c difference between blacks and NHWs was associated with the first PC factor, suggesting that unidentified genetic markers influence HbA1c in blacks in addition to nongenetic factors.
Studies that have compared HbA1c levels by race have consistently found higher HbA1c levels in blacks than non-Hispanic whites (NHWs) (1). Until recently, the observed differences in HbA1c by race were generally attributed to health disparities. In the late 2000s, differences in HbA1c were recognized to persist in black adults selected to have the same access to medical care as NHW adults (1). Moreover, differences seem to persist despite adjustments for multiple glycemic and nonglycemic covariates, including measured socioeconomic variables (2). In several clinical trials that recruited subjects based on glucose criteria, HbA1c levels were found to be higher in blacks than NHWs (3–5). In the Diabetes Prevention Program (DPP), eligibility was based on both fasting plasma glucose of 95 to 125 mg/dL and 2-hour plasma glucose level of 140 to 199 mg/dL. Despite having comparable glucose levels, blacks had significantly higher HbA1c levels than NHWs (6.2 ± 0.6% or 44 ± 6.6 mmol/mol vs 5.8 ± 0.4% or 40 ± 4.4 mmol/mol, P < 0.0001) that persisted after adjusting for age, sex, body mass index (BMI), blood pressure, fasting glucose, glucose area under the curve during the oral glucose tolerance test, corrected insulin response, and insulin sensitivity (4). These observations suggest that nonglycemic patient-level factors associated with race might independently affect HbA1c. So far, there have been limited investigations of genetics as potential factors explaining these HbA1c racial differences.
Some hemoglobinopathies such as sickle cell trait are more common in individuals from African ancestry. Hemoglobinopathies as well as erythrocyte disorders interfere with some HbA1c assays, yet these issues are of less concern with most modern assays (6). To date, there are no definitive studies comparing genetic determinants of erythrocyte biology and their potential effect on HbA1c between blacks and NHWs.
A recent large, multiethnic, meta-analysis of genome-wide association studies (GWASs) of 159,940 individuals from 82 cohorts (7) revealed 60 independent loci robustly associated with HbA1c (at genome-wide significance level), substantially adding to the number of loci identified in previous studies (8–10). Among these 60 loci, 22 genetic variants were located near genes that likely influence erythrocyte biology, including a genetic variant near G6PD that is common in individuals of African descent but essentially monomorphic in individuals of European descent.
Principal component analysis (PCA) has been used to find evidence for substructure in genetic datasets and to determine if individuals in a dataset are drawn from a homogeneous population or from a population containing genetically distinct subgroups. The method can determine whether admixed populations have different proportional contributions from different ancestral populations or continents of origin, such as those coming from Africa, Europe, or the Americas.
In this study, we aimed to explain difference in HbA1c levels between black and NHW DPP participants using three types of genetic markers: (i) genetic variants known to cause hemoglobinopathies or erythrocyte disorders; (ii) genetic variants robustly associated with HbA1c discovered in the most recent multiethnic GWAS meta-analysis; and (iii) PCA factors derived from genetic variants distributed across the genome.
Materials and Methods
Description of participants
The DPP design and baseline characteristics of the study participants have been described in detail elsewhere (11, 12). Each clinical center and the coordinating center–obtained institutional review board approval. The 2658 participants included in this report provided written informed consent for genetic investigations.
Measures
At baseline, trained research staff administered the 1990 US Census questionnaire to obtain self-reported information about race/ethnicity (13). Self-reported information was also obtained on demographics and medical history. Trained research staff measured anthropometry using standardized protocols and drew blood from all eligible participants at baseline (11). Whole-blood samples were shipped on ice to a central biochemistry laboratory by overnight express mail within 24 hours of sample collection. HbA1c was measured by a dedicated ion-exchange high-performance liquid chromatography instrument (Variant; BioRad, Hercules, CA) (14). We used baseline HbA1c levels before implementation of the DPP interventions because the difference in HbA1c levels between racial/ethnic groups were apparent at baseline and to avoid treatment effects that might have differed between the racial/ethnic groups.
Genotyping
We extracted DNA from peripheral blood leukocytes. The genotypes included in this report came from three different waves of genotyping (using Sequenom iPLEX, Metabochip, and HumanCore Exome arrays). First, we selected genetic variants known to be associated with erythrocyte disorders including hemoglobinopathies, red cell membrane and enzymes disorders, and iron metabolism that are common [minor allele frequency (MAF) > 1%] in European and/or African descent populations. These genetic variants were genotyped by allele-specific primer extension of single-plex amplified products, with detection by matrix-assisted laser desorption ionization time-of-flight mass spectroscopy on a Sequenom iPLEX platform (genotyping success rate = 99.3%). Allele frequencies were in Hardy-Weinberg equilibrium (P > 0.05) in each ethnic group. The exception to this methodology was the genetic variant encoding for sickle cell trait (rs334), which was derived from imputation data based on our genome-wide arrays (described in the following section) because of incapacity of genotyping on Sequenom.
Most of the genotypes included in the genetic risk score (GRS) came from genotyping performed using the Metabochip [35 of 60 single-nucleotide polymorphisms (SNPs)] or the HumanCore Exome (20 of 60 SNPs) genome-wide arrays (Illumina, San Diego, CA). The Metabochip is a custom array containing ∼200,000 SNPs chosen based on previous GWAS meta-analyses of metabolic traits related to type 2 diabetes, obesity, and/or cardiovascular disease. For Metabochip quality control process, we excluded samples with sex mismatch or familial relatedness and excluded SNPs with a call rate <95% or if they failed Hardy-Weinberg equilibrium (P < 1.0 × 10⁻⁷) within each ethnic group (overall genotyping success rate, >99.85%). For the HumanCore Exome arrays quality control process, we excluded samples for sex mismatch, call rate <98%, inbreeding coefficient <−1, identity by state with PI_hat∼1, and discordance with Metabochip genotyping. We excluded SNPs if the call rate was <95%, if the SNP failed Hardy-Weinberg equilibrium at P < 10−8 in any ethnic group, and if it was not concordant with Metabochip data. Imputation was performed using the 1000 Genomes phase 3 reference panel (15) and imputed probabilities were transformed into “hard calls” using GTOOL (16) resulting in 9,276,901 SNPs with MAF >0.01 and info >0.882 (r2 > 0.8). Five SNPs required for the GRS had been previously genotyped using oligonucleotide pool array for the Illumina BeadArray platform or were genotyped (as a rescue step) on Sequenom iPLEX described previously.
Statistical analyses
Continuous variables are presented as mean ± SD and categorical variables as frequency (%). Baseline characteristics were compared among self-reported race/ethnicity groups with ANOVA tests for quantitative variables and χ2 tests for qualitative variables.
For genetic variants related to hemoglobinopathies and erythrocyte disorders, we used linear regression models assuming a genetic additive effect. We tested associations between each causal genetic variant and HbA1c levels in black and NHW DPP participants separately. Basic models were adjusted for age and sex; we further adjusted for adiposity (waist or BMI), fasting glucose, or first PCA factor in sensitivity models.
Using 60 independent loci associated with HbA1c levels that had reached genome-wide level of significance in the latest multiethnic GWAS meta-analysis (7), we constructed GRS using weighted effect alleles specific to the effect size and direction of effect discovered in individuals of European and African descent, respectively, resulting in two GRS (Eur-GRS and A-GRS). We built GRS assuming a genetic additive effect, and the regression models provided the association per additional (weighted) risk allele on HbA1c levels. We conducted analyses separately for black and NHW participants. Basic models were adjusted for age and sex. We conducted sensitivity analyses further adjusting for BMI (or waist) and fasting glucose.
Using genetic variants across the genome (from HumanCore Exome arrays and derived from 1000 Genomes imputation), we derived PCA factors using DPP participants from all ancestries. PCA factors are generated by a statistical procedure that uses a linear transformation to convert a set of observations of correlated genetic markers into a set of values of linearly uncorrelated variables regarded as continuous axes of variation reflecting genetic variation resulting from continental ancestry. The first PCA factor accounts for the most variation in genetic ancestry markers and describes the gradient between African and European ancestries. PCA factors account for population-specific variation in alleles distributed on SNPs arising as a consequence of varying frequencies of alleles in genetically distant ancestries and highlights groups of individuals differing at the level of allele frequency, in summary, capturing genetic substructure admixture.
To investigate what proportion of the difference in HbA1c levels seen between blacks and NHWs could be explained by genetic markers, we analyzed linear regression models with self-reported ethnicity (black or NHW only) as primary exposure and HbA1c levels as the outcome (basic model and all subsequent models were adjusted for age and sex). We then included the sets of genetic markers one at a time and assessed what proportion of the difference in HbA1c between blacks and NHWs was explained by each set of genetic markers. All analyses were performed using SAS 9.3 (SAS Inc, Cary, NC), and all tests were two-sided with P < 0.05 set as the level of significance.
Results
We presented the baseline characteristics of DPP participants eligible for this study by race/ethnicity in Table 1. Two-thirds of the DPP participants were women; they had a mean ± SD age of 50.7 ± 10.7 years. blacks were more likely to be women and were slightly younger than NHWs (Table 1). As reported previously, blacks had a higher HbA1c (6.2 ± 0.6% or 44 ± 6.6 mmol/mol) compared with NHWs (5.8 ± 0.4% or 40 ± 4.4 mmol/mol; P < 0.001) at baseline, despite similar levels of fasting and 2-hour glucose (Table 1).
Baseline Characteristics of Eligible DPP Participants by Self-Reported Race/Ethnicity
| All Ethnicities (N = 2658) | NHW (N = 1476) | Black (N = 537) | Hispanic (N = 451) | Asian (N = 118) | American Indian (N = 76) | P | |
|---|---|---|---|---|---|---|---|
| Sex, % female | 1789 (67) | 964 (65) | 397 (74) | 307 (68) | 54 (46) | 67 (88) | <0.001 |
| Age, y | 50.7 ± 10.7 | 52.1 ± 10.8 | 50.1 ± 10.2 | 48.3 ± 10.2 | 50.4 ± 9.6 | 42.4 ± 10.4 | <0.001 |
| HbA1c, % | 5.9 ± 0.5 | 5.8 ± 0.4 | 6.2 ± 0.6 | 5.9 ± 0.5 | 6.0 ± 0.4 | 5.9 ± 0.5 | <0.001 |
| BMI, kg/m2 | 34.1 ± 6.6 | 34.2 ± 6.7 | 35.5 ± 6.9 | 33.3 ± 5.8 | 29.6 ± 5.4 | 35.2 ± 5.9 | <0.001 |
| Waist, cm | 105 ± 15 | 106 ± 15 | 107 ± 15 | 102 ± 13 | 96 ± 12 | 108 ± 13 | <0.001 |
| Fasting glucose, mg/dL | 107 ± 8 | 107 ± 8 | 108 ± 8 | 106 ± 8 | 108 ± 8 | 102 ± 8 | <0.001 |
| 2-h glucose, mg/dL | 165 ± 17 | 165 ± 17 | 164 ± 18 | 163 ± 17 | 167 ± 17 | 165 ± 17 | 0.140 |
| Eur-GRS, 60 SNPs | 61.3 ± 4.9 | 61.7 ± 4.8 | 62.4 ± 4.5 | 58.6 ± 4.5 | 61.5 ± 5.2 | 58.9 ± 4.3 | <0.001 |
| A-GRS, 60 SNPs | 62.4 ± 5.1 | 60.4 ± 4.5 | 64.6 ± 4.6 | 65.3 ± 4.7 | 66.3 ± 4.3 | 64.0 ± 3.9 | <0.001 |
All values are N (%) or mean ± SD.
Eligibility based on self-report of race/ethnicity and consent to participate in genetic studies.
Association of HbA1c levels with genetic variants known to cause hemoglobinopathies and erythrocytes disorders in black and NHW DPP participants
We investigated 13 genetic variants known to cause hemoglobinopathies or erythrocyte disorders (Table 2). In blacks the sickle cell trait variant (rs334; MAF = 6.5%) was associated with higher HbA1c [β (SE) = +0.44 (0.08)% or +4.8 (0.9) mmol/mol per risk allele; P = 2.1 × 10⁻⁸]. Because the sickle cell trait variant at rs334 was nominally associated with higher fasting glucose [β (SE) = 2.28 (1.12) mg/dL or 0.13 (0.06) mmol/L per risk allele; P = 0.04], we further adjusted for fasting glucose and found similar association in blacks [β (SE) = +0.40 (0.08)% or +4.4 (0.9) mmol/mol per risk allele; P = 1.9 × 10⁻⁷]. The association also remained essentially the same when further adjusted for BMI or waist circumference and with additional adjustment for the first PCA factor.
Genetic Variants for Hemoglobinopathies and Factors Known to Influence Red Blood Cell Biology and Their Associations With HbA1c Levels (in NGSP %-unit) in NHW and Black DPP Participants
| NHW | Black | ||||||||||
|---|---|---|---|---|---|---|---|---|---|---|---|
| Gene | SNP | MAF CEU | MAF in DPP Whites | N | β (SE) | P | MAF YRI | MAF in DPP Blacks | N | β (SE) | P |
| Hemoglobin | |||||||||||
| HBB (SCT) | rs334a | 0 | A (0.07%) | 1473 | 0.88 (0.61) | 0.15 | 0.114 | A (6.5%) | 537 | 0.44 (0.08) | 2.14 × 10⁻⁸ |
| HBB (common) | rs10128556 | 0.317 | T (31.9%) | 1587 | −0.038 (0.016) | 0.02 | 0.067 | T (16.0%) | 586 | −0.064 (0.046) | 0.17 |
| Hemoglobin F | |||||||||||
| BCL11A | rs7599488 | 0.392 | T (43.5%) | 1606 | −0.017 (0.015) | 0.28 | 0.305 | T (33.3%) | 582 | 0.035 (0.036) | 0.33 |
| BCL11A | rs4671393 | 0.142 | A (16.0%) | 1561 | −0.037 (0.021) | 0.07 | 0.250 | A (22.7%) | 560 | −0.085 (0.039) | 0.03 |
| HBS1L-MYB | rs28384513 | 0.3 | G (35.5%) | 1617 | −0.067 (0.015) | 0.000015 | 0.144 | G (23.5%) | 593 | 0.038 (0.040) | 0.34 |
| HBS1L-MYB | rs114398597 | NA | G (0.1%) | 1627 | −0.053 (0.306) | 0.86 | 0.042 | G (1.3%) | 594 | −0.319 (0.154) | 0.04 |
| HBS1L-MYB | rs9402686 | 0.217 | A (25.9%) | 1612 | −0.091 (0.017) | 9.19 × 10⁻⁸ | 0.058 | A (8.6%) | 590 | −0.077 (0.061) | 0.21 |
| Enzymes implicated in red cell biology | |||||||||||
| G6PD | rs1050828 | 0 | T (0.1%) | 1625 | — | — | 0.221 | T (11.6%) | 594 | −0.605 (0.039) | 4.45 × 10−45 |
| HK1 | rs16926246 | 0.11 | T (12.1%) | 1616 | −0.071 (0.023) | 0.002 | 0.183 | T (14.1%) | 589 | −0.035 (0.050) | 0.48 |
| Red cell membrane | |||||||||||
| SPTA1 | rs7418956 | 0 | T (0.1%) | 1623 | 0.211 (0.306) | 0.49 | 0.083 | T (5.9%) | 594 | 0.003 (0.074) | 0.96 |
| SPTA1 | rs35948326 | 0.042 | T (4.4%) | 1563 | −0.061 (0.038) | 0.11 | N/A | T (1.4%) | 560 | 0.111 (0.152) | 0.47 |
| SLC4A1 | rs5036 | 0.033 | C (2.0%) | 1624 | 0.006 (0.054) | 0.91 | 0.076 | C (8.0%) | 593 | 0.063 (0.061) | 0.30 |
| Iron metabolism | |||||||||||
| HFE | rs1799945 | 0.179 | G (15.2%) | 1619 | −0.006 (0.021) | 0.77 | 0 | G (3.6%) | 591 | −0.041 (0.088) | 0.64 |
Each model is adjusted for age at randomization and sex.
rs334 was imputed using GWImp-COMPS (17).
Abbreviations: CEU, reference European population; NA, not applicable; YRI: reference African population.
In blacks the G6PD variant rs1050828 (MAF = 11.6%) was associated with lower HbA1c [β (SE) = −0.61 (0.04)% or −6.7 (0.4) mmol/mol per risk allele; P = 4.4 × 10−45]. The G6PD variant was not associated with fasting glucose, and the association remained the same after adjustments for fasting glucose, BMI/waist, or first PCA factor. We also found that two variants known to influence fetal hemoglobin were nominally associated with lower HbA1c levels in blacks (rs4671393 in BCL11A and rs114398597 in HBS1L-MYB; Table 2).
In NHWs, the minor allele at rs16926246 [a common variant (MAF = 32%) in the hemoglobin gene (HBB) not associated with sickle cell trait] was nominally associated with lower HbA1c [β = −0.038 (0.016)% or −0.4 (0.2) mmol/mol per risk allele; P = 0.02]. The minor alleles at common variants in HBS1L-MYB (rs28384513 and rs9402686) known to influence fetal hemoglobin and at rs16926246 in HK1 were associated with lower HbA1c levels in NHWs (Table 2). Associations with HbA1c remained the same with further adjustments for fasting glucose, BMI or waist circumference, and for first PCA factor.
Association of HbA1c levels with known HbA1c-associated common variants
We tested associations between GRS built on 60 SNPs shown to be robustly associated with HbA1c in a large multiethnic GWAS (7). In DPP participants, the mean A-GRS was greater in blacks (64.6 ± 4.6) than in NHWs (60.4 ± 4.5; P < 0.001; Table 1). In blacks HbA1c was higher for each additional risk allele included in the A-GRS (age- and sex-adjusted β = 0.017, SE = 0.006%-unit of HbA1c per risk allele; P = 0.003); this association remained about the same when adjusted for fasting glucose and was slightly stronger when adjusted for adiposity (17). The mean Eur-GRS was slightly greater in blacks (62.4 ± 4.5) than in NHWs (61.7 ± 4.8; Table 1). In NHWs, HbA1c was higher for each additional risk allele included in the Eur-GRS (age- and sex-adjusted β = 0.017, SE = 0.002%-unit of HbA1c per risk allele; P = 1.4 × 10⁻¹²). This association remained similar when adjusted for adiposity and fasting glucose (17).
Genetically-derived PCA factors and HbA1c levels
The first 10 PCA factors explained 10.3% of the variance (R2) in HbA1c in DPP participants (all ethnicities as in Table 1). As expected from prior studies of mixed populations, the first PCA factor described the contrast between participants of self-reported European or African descent, illustrating the degree of African ancestry (Fig. 1). The first PCA factor was associated with HbA1c levels in the overall group of DPP participants comprising all ethnicities (R2 = 9.79%; P < 0.0001), as well as in race-stratified analyses in black (R2 = 0.74%; P = 0.047) and in Hispanic (R2 = 7.90%; P < 0.001) but not in white participants (R2 = 0.02%; P = 0.59).
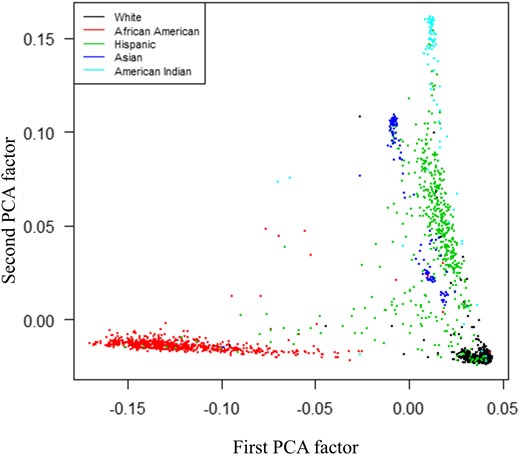
Principal component analyses factors derived from DPP participants’ GWAS data (MAF ≥0.05, no HLA regions), illustrating distribution along first and second PCA factor axes and color-coded for self-identified race/ethnicity. PCA, Principal Component Analyses.
Genetic markers and difference in HbA1c levels between blacks and NHWs (Table 3)
Models Testing Genetic Markers as Potential Determinants of Difference in HbA1c Levels in Self-Reported Black vs NHW DPP Participants
| Effect of Self-Reported Black (vs NHW) | Effect of rs334 (Per Minor Allele) | Effect of GRS (Per Weighted Risk Allele) | Effect of First PC (Per Unit Increase) | |||||
|---|---|---|---|---|---|---|---|---|
| Models Predicting Difference in HbA1c Levels (in NGSP %-unit) | β (SE) | P | β (SE) | P | β (SE) | P | β (SE) | P |
| Basic (age-/sex-adjusted) | 0.414 (0.0221) | 4.4 × 10−73 | ||||||
| SCT (rs334) (age-/sex-adjusted) | 0.347 (0.0257) | 5.9 × 10−40 | 0.445 (0.0654) | 1.0 × 10⁻¹¹ | ||||
| Multiple hemoglobinopathies and red blood cell biology SNPs (age-/sex-adjusted)a | 0.426 (0.0283) | 2.9 × 10−48 | ||||||
| GRS (60 SNPs) (age-/sex-adjusted)b | 0.356 (0.0247) | 5.7 × 10−45 | 0.016 (0.0022) | 3.0 × 10⁻¹³ | ||||
| First PC factor (age-/sex-adjusted) | 0.171 (0.1009) | 0.090 | 1.465 (0.6185) | 0.02 | ||||
Including rs334; rs10128556; rs4671393; rs28384513; rs114398597; rs9402686; rs1050828; rs16926246.
GRS ethnic-specific (i.e., A-GRS for self-reported black and Eur-GRS for self-reported European descent).
In age- and sex-adjusted models, self-identification as being black compared with NHW predicted higher HbA1c levels [β (SE)= +0.41 (0.02)% or +4.5 (0.2) mmol/mol for being black P = 4.4 × 10−73]. Adding sickle cell trait variant rs334 in the model reduced the effect size of self-reported black race as a determinant of higher HbA1c and explained about 16% of the difference, but being black still predicted having higher HbA1c levels [β (SE)= +0.35 (0.04)% or +3.8 (0.4) mmol/mol; P = 5.9 × 10−40]. Including all eight hemoglobinopathy variants found to be associated with HbA1c in black or NHW DPP participants (Table 2) in the model did not explain the difference between the two groups. Including ethnic-specific GRS based on all 60 HbA1c-associated SNPs attenuated the effect of being black on HbA1c and explained about 14% of the difference between the two groups, but being black still predicted higher HbA1c levels by 0.36 (0.03)% [or 3.9 (0.3) mmol/mol] (Table 3). Finally, we added the first PCA factor and found that it accounted for about 60% of the difference in HbA1c found between blacks and NHWs, such that the difference was no longer statistically significant [β (SE)= +0.17 (0.10)% or +1.9 (1.1) mmol/mol for being black; P = 0.09]. The components of this PCA factor therefore accounted for an important proportion of the black-associated effect on HbA1c.
Discussion
In this analysis of a racially and ethnically diverse population of DPP participants with HbA1c and genetic markers measured at baseline, we observed that the 537 black participants had approximately 0.4%-unit (or 4.4 mmol/mol) higher HbA1c levels than the 1476 NHW participants, despite entering DPP with similar levels of glycemia (18). In our attempt to explain this ethnic difference by different genetic markers, we found that a large proportion of the difference in HbA1c between black and NHW participants is accounted by the first PCA factor of genetic ancestry derived from common variants across the genome, confirming, by genetic estimation of ancestry, an association based on self-reported race/ethnicity. In contrast, relatively smaller proportions of the difference in HbA1c levels between blacks and NHWs were explained by known genetic variants leading to hemoglobinopathies/erythrocytes disorders or by the 60 HbA1c-associated variants that had reached genome-wide level significance in the most recent multiethnic GWAS meta-analyses, including those that are more common in individuals of African descent.
Previous studies have been unable to explain the racial difference in HbA1c levels based on demographic, socioeconomic, health care access, and/or biologic factors (1, 3–5). As shown in a previous report from the DPP, this difference in HbA1c persisted even after adjusting for fasting glucose and multiple other glycemic markers such as glucose area under the curve, corrected insulin response, and insulin sensitivity (4). Based on National Health and Nutrition Examination Survey data, the difference in HbA1c between blacks and NHWs is apparent early in life (as young as 5 years of age), which supports a possible underlying genetic explanation (19). We found that the first genomic PCA factor explained a significant proportion of HbA1c variance (almost 10%) in DPP participants, but a fairly small proportion of the HbA1c variance among blacks alone (R2 < 1%). The latter proportion is similar to the 0.5% of explained variance reported by Maruthur et al. (20) using 1350 genetic ancestry-informative markers capturing the proportion of European ancestry. Maruthur et al. (20) concluded that ancestry markers were unlikely to explain the difference in HbA1c between blacks and NHWs, but the hypothesis was not formally tested because only blacks were included in their report. Meigs et al. (21) used 62 ancestry-informative markers from genetic variants discriminating the proportion of West African, European, and Native American ancestry and found that 100% African ancestry was associated with 0.27% (or 3.0 mmol/mol) higher HbA1c levels compared with 100% European ancestry, a difference that persisted after adjustment for age, sex, BMI, and socioeconomic status. However, they did not report whether these 62 ancestry-informative markers explained the difference in HbA1c between self-reported race/ethnicities.
Our finding that the first PCA factor derived from genetic markers across the genome, and not the other targeted genetic variants that we investigated, accounts for the higher HbA1c in black compared with NHW DPP participants has several possible explanations. First, there may be additional genetic markers influencing HbA1c that are specific and/or more common in individuals of African descent that are not yet identified (and thus not included in the 60 SNPs included in the tested GRS). Indeed, the large multiethnic GWAS meta-analysis from which we derived the HbA1c GRS identified only two loci that were specific to individuals of African descent. Many of the 60 identified loci were driven by the large sample of individuals of European descent included in the meta-analysis (7).
On the other hand, the relatively large proportion of the difference in HbA1c levels between blacks and NHWs explained by inclusion of the first PCA factor in the model may simply be due to the first PCA capturing African ancestry and the self-identification as black. Including it in the model may be equivalent to self-reported black ethnicity or simply reflect other nongenetic factors associated with being black. We formally tested and did not find collinearity in our models that included PCA and self-reported race and are confident that our findings are not driven by simple collinearity. Yet, nongenetic factors could confound our findings, as illustrated by previous genetic association studies (22, 23). For example, in a type 2 diabetes genetic association study in an American Indian population in Arizona, a Gm haplotype was strongly and inversely associated with type 2 diabetes (23). The association of HbA1c with PCA factors that distinguish blacks from NHWs in the current study confirms an association with race/ethnicity, but does not indicate the cause of that association (i.e., the extent to which it is genetic, environmental, behavioral, or socioeconomic). However, multiple previous rigorous efforts to identify nongenetic factors to explain racial difference in HbA1c have not been fruitful.
Other investigators in the field have proposed that the difference in HbA1c between blacks and NHWs may be due to genetic variants that affect hemoglobin or erythrocyte function, given that the variants affecting erythrocyte biology are enriched in individuals of African descent (due in part to selective pressure to resist malaria). For this reason, we specifically investigated many known variants associated with hemoglobinopathies and erythrocyte disorders. We found that black individuals carrying the A risk allele at rs334, also known as sickle cell trait (SCT) or hemoglobin S, had higher HbA1c levels. This contrasts with the results of an analysis from Coronary Artery Risk Development in Young Adults and the Jackson Heart Study that found that blacks with SCT had lower HbA1c levels than blacks with non-SCT (24). In contrast, Sumner et al. (25) found no difference in A1c comparing SCT with non-SCT in a cohort of recent African immigrants to the United States. Bleyer et al. (26) found slightly higher HbA1c in blacks with SCT (7.4 ± 1.1% or 57 ± 12 mmol/mol) compared with blacks without SCT (7.2 ± 1.1% or 55 ± 12 mmol/mol), but this difference was not statistically significant. Based on a potentially shorter erythrocytes lifespan, the expectation might be that the carriers of the A allele at rs334 could have lower HbA1c levels, but it is unclear if individuals with SCT have shorter erythrocyte lifespans (27–30). It is also possible that different instruments used to measure HbA1c may have contributed to the inconsistencies between our study and the previous ones. The BioRad Variant instrument that was used to measure HbA1c in the DPP has been reported to have minimal interference with most hemoglobin variants (31), but one study showed that it overestimates HbA1c levels in carriers of the SCT by 0.66% (or 7.2 mmol/mol) when HbA1c levels are approximately 6% (or 42 mmol/mol) (32). In the study from Coronary Artery Risk Development in Young Adults/Jackson Heart Study, Lacy et al. used Tosoh 2.2 and Tosoh G7 instruments that have not been reported to have clinically important interferences with SCT (www.ngsp.org). Nevertheless, the higher HbA1c levels in blacks with the rs334 variant in DPP participants explained only about 16% of the proportion of the higher HbA1c detected in blacks compared with NHWs. Moreover, adding other known hemoglobinopathies or erythrocyte disorders genetic variants to the model did not explain the difference in HbA1c levels between blacks and NHWs (Table 3).
Strength and limitations
Strengths of our study include the diverse ethnic/racial composition of the DPP, recruited to represent the US population of individuals at higher risk of developing diabetes, and including a large number of blacks. All participants were well phenotyped using standardized protocols and central laboratories. Genetic variants were measured based on direct genotyping, microarrays, and genome imputation using the highest standards. One limitation of our study is that power was limited for some analyses given the low frequency of specific variants, primarily those selected to assess erythrocyte biology. Also, we assume similar glucose levels in blacks and NHWs based on oral glucose tolerance test at one point in time, yet HbA1c reflects the previous 3 months of glycemic exposure.
Conclusions
A substantial proportion (about 60%) of the difference in HbA1c between black and NHW DPP participants with the same level of glycemia is explained by the first genomic PCA factor capturing the degree of African ancestry. Our ability to explain a large proportion of this difference with the first PCA factor in contrast to a relatively small proportion with 60 genetic variants known to be robustly associated with HbA1c suggests that more genetic variants influencing HbA1c in individuals of African descent and possible nongenetic factors remain to be discovered. Although the recent GWAS meta-analysis investigating the genetics of HbA1c included 7564 individuals of African descent, it revealed only two variants specific to that population. To reveal additional genetic determinants of HbA1c, future studies need larger samples size to investigate both rare and common variants across whole genome.
Abbreviations:
- A-GRS
African genetic risk score
- BMI
body mass index
- DPP
Diabetes Prevention Program
- Eur-GRS
European genetic risk score
- GRS
genetic risk score
- GWAS
genome-wide association study
- MAF
minor allele frequency
- NHW
non-Hispanic white
- PC
principal component
- PCA
principal component analysis
- SCT
sickle cell trait
- SNP
single-nucleotide polymorphism
Acknowledgments
The Research Group gratefully acknowledges the commitment and dedication of the participants of the Diabetes Prevention Program and Diabetes Prevention Program Outcomes Study.
Financial Support: During the Diabetes Prevention Program (DPP) and Diabetes Prevention Program Outcomes Study (DPPOS), the National Institute of Diabetes and Digestive and Kidney Diseases (NIDDK) of the National Institutes of Health provided funding to the clinical centers and the coordinating center for the design and conduct of the study, and collection, management, analysis, and interpretation of the data (U01 DK048489). The Southwestern American Indian Centers were supported directly by the NIDDK, including its Intramural Research Program and the Indian Health Service. The General Clinical Research Center Program, National Center for Research Resources, and the Department of Veterans Affairs supported data collection at many of the clinical centers. Funding was also provided by the National Institute of Child Health and Human Development, the National Institute on Aging, the National Eye Institute, the National Heart Lung and Blood Institute, the National Cancer Institute, the Office of Research on Women’s Health, the National Institute on Minority Health and Health Disparities, the Centers for Disease Control and Prevention, and the American Diabetes Association. Bristol-Myers Squibb and Parke-Davis provided additional funding and material support during the DPP, Lipha (Merck-Sante) provided medication, and LifeScan Inc. donated materials during the DPP and DPPOS. This research was also supported, in part, by the intramural research program of the NIDDK. LifeScan Inc., Health O Meter, Hoechst Marion Roussel Inc., Merck-Medco Managed Care Inc., Merck and Co., Nike Sports Marketing, Slim Fast Foods Co., and Quaker Oats Co. donated materials, equipment, or medicines for concomitant conditions. McKesson BioServices Corp., Matthews Media Group, Inc., and the Henry M. Jackson Foundation provided support services under subcontract with the coordinating center. The sponsor of this study was represented on the Steering Committee and played a part in study design, how the study was done, and publication. The funding agency was not represented on the writing group, although all members of the Steering Committee had input into the report’s contents. All authors in the writing group had access to all data. The opinions expressed are those of the investigators and do not necessarily reflect the views of the funding agencies. A complete list of centers, investigators, and staff can be found in the Appendix posted on the DPPOS public Web site at https://dppos.bsc.gwu.edu/web/dppos/appendix. The funders had no role in study design, data collection and analysis, decision to publish, or preparation of the manuscript. The funding sources had no role in analyses, interpretation, or writing of this report.
Clinical Trial Information: ClinicalTrials.gov no. NCT00004992 (registered 20 March 2000).
Author Contributions: M.-F.H. designed the study, interpreted the data, and wrote the manuscript. C.A.C. and K.A.J. performed the analyses. W.C.K., J.C.F., and W.H.H. participated in study design and contributed to manuscript writing. All authors contributed to interpretation of the data and revised the manuscript critically for important intellectual content. All authors approved the final version to be published, and agreed to be accountable for all aspects of the work for its accuracy and integrity.
Disclosure Summary: The authors have nothing to disclose.
References
Sánchez F, Bonàs S, Guindo M, Díaz C, Tejedor E, Badia R, Mercader JM, Torrents D. GWImp-COMPSs: an integrated framework for large-scale genome-wide imputation and association testing on parallel computing platforms. Available at: http://cg.bsc.es/guidance/. Accessed 20 November 2018.
GTOOL. Available at: http://www.well.ox.ac.uk/~cfreeman/software/gwas/gtool.html. Accessed 24 October 2018.
