


Abstract
Monitoring of hormonal control represents a key part of the management of congenital adrenal hyperplasia (CAH). Monitoring strategies remain suboptimal because they rely on frequent blood tests and are not specific for adrenal-derived hormones. Recent evidence suggests the crucial role of adrenal-specific 11-oxygenated-C19 androgens in the pathogenesis of CAH.
To establish a correlation between plasma and salivary adrenal-specific androgens in CAH as a noninvasive monitoring strategy.
This prospective cross-sectional study recruited patients between 2015 and 2018.
Multicenter study including 13 tertiary centers in the United Kingdom.
Seventy-eight children with CAH and 62 matched healthy controls.
Using liquid chromatography–tandem mass spectrometry, plasma and salivary concentrations of five steroids were measured: 17-hydroxyprogesterone (17OHP), androstenedione (A4), testosterone (T), 11-hydroxyandrostenedione (11OHA4), and 11-ketotestosterone (11KT). The correlation between plasma and salivary steroids was analyzed to assess their use in clinical practice.
Strong correlations between plasma and salivary steroid concentrations in patients with CAH were detected: 17OHP (rs = 0.871; P < 0.001), A4 (rs = 0.931; P < 0.001), T (rs = 0.867; P < 0.001), 11OH4A (rs = 0.876; P < 0.001), and 11KT (rs = 0.944; P < 0.001). These results were consistent for patient subgroups based on sex and age. Analysis of patient subgroups based on 17OHP concentrations established clear correlations between plasma and salivary concentrations of the adrenal-specific androgen 11KT.
The current study identified tight correlations between plasma and saliva for the adrenal-derived 11-oxygenated C19 androgen 11KT, as well as 17OHP and A4, which are widely used for monitoring treatment in CAH. This combination of steroid hormones will serve as an improved noninvasive salivary test for disease monitoring in patients with CAH.
Steroid 21-hydroxylase deficiency (21OHD) represents the most common form of congenital adrenal hyperplasia (CAH) and occurs in ∼1 in 10,000 to 1 in 15,000 live births (1). 21OHD results in impaired cortisol synthesis and therefore absence of negative feedback toward the anterior pituitary and hypothalamus. Consequently, excessive ACTH secretion leads to adrenal hyperplasia and further androgen excess. In addition, two-thirds of patients experience clinically apparent mineralocorticoid deficiency, resulting in renal salt loss. Thus, management of CAH entails lifelong glucocorticoid replacement, as well as mineralocorticoid replacement in patients with additional salt loss. Treatment with glucocorticoids is required not only to replace deficient cortisol but also to reduce the ACTH drive and subsequent androgen excess (1, 2). Meeting the balance between under treatment leading to androgen excess and overtreatment leading to glucocorticoid overexposure remains challenging. Thus, CAH is associated overall with significantly increased mortality and morbidity (3).
Monitoring of hormonal control represents one of the most important cornerstones of clinical care provided to individuals with CAH (3). Different approaches and combinations of steroid hormones are currently used. However, most clinicians rely on the measurement of 17-hydroxyprogesterone (17OHP), androstenedione (A4), and testosterone (T) concentrations in plasma at single or multiple time points (4). Blood tests are invasive and distressing for children and young people, as accurate monitoring requires frequent measurements adding up to approximately 50 to 70 blood tests from birth to the age of 18 years. In addition, some of the steroid hormones routinely measured are derived from both the gonad and the adrenal, which makes interpretation of results from puberty onward challenging.
In recent years, analytical methods in steroid hormone biochemistry have remarkably advanced, allowing for more reliable measurement of hormonal concentrations in saliva using liquid chromatography–tandem mass spectrometry (LC-MS/MS) (5). LC-MS/MS was validated for measuring saliva concentrations for a number of steroid hormones, including cortisol, cortisone, T, A4, dehydroepiandrosterone, and 17OHP (5–7). Studies showed reliable correlations between saliva and serum concentrations for these hormones (8–10). In particular, it has been suggested that salivary A4 and 17OHP are of clinical use in monitoring therapy in 21OHD (9, 11, 12).
Recent evidence indicates a key role for adrenal-derived 11-oxygenated-C19 androgens in the pathogenesis of CAH (13, 14, 15). These 11-oxygenated-C19 androgens are derived from the adrenal gland and require 11-hydroxylation by 11-hydroxylase as well as 11-dehydrogenation by 11-hydroxysteroid dehydrogenase type 2. Some of these androgens, such as 11-hydroxyandrostenedione (11OHA4), are weak hormones serving as precursors for more potent androgens. However, 11-hydroxytestosterone and 11-ketotestosterone (11KT) have strong androgenic activity of a magnitude similar to that of dihydrotestosterone (16). A recent study suggested that patients with 21OHD have significantly higher concentrations of 11-oxygenated-C19 androgens than healthy controls (13). Furthermore, 11OHA4 and 11KT appear to correlate with adrenal volume in patients with CAH (17). Consequently, it was suggested that they might have clinical value as biomarkers of androgen excess in patients with CAH due to 21OHD (18).
The current study explored the measurements of adrenal-specific androgens in saliva as effective noninvasive methods of monitoring therapy control in patients with 21OHD. Therefore, we aimed to establish a correlation between plasma and salivary concentrations for adrenal-specific androgens that are relevant to monitoring disease control in 21OHD.
Materials and Methods
Study design and participants
The study was conducted in compliance with the NHS Research Ethics Committee [YH/0537 (15)], the International Conference for Harmonization of Good Clinical Practice, and the Research Governance Framework for Health and Social Care (second edition).
The participants included patients with CAH who were aged between 8 and 18 years and came from across the United Kingdom. Patients were recruited as part of a prospective cross-sectional multicenter study of the health status of children and young people with CAH (CAH-UK; Integrated Research Application System ID 191301). Patients were recruited through 13 participating UK regional centers (15) that were providing care and long-term follow-up for CAH. The following inclusion criteria were used in the recruitment process: (i) patients with known CAH due to 21OHD confirmed by hormonal and/or genetic testing, (ii) age between 8 and 18 years, and (iii) capacity to assent/consent and provide signed and dated informed consent. The only exclusion criterion was pregnancy.
A control group of healthy children and young people matched for age, sex, and body mass index were recruited by a local advertisement placed with the associated universities, NHS Trusts, and General Practitioner surgeries. The following inclusion criteria were used for the control group: (i) age between 8 and 18 years and (ii) capacity to assent/consent and provide signed and dated informed consent. Exclusion criteria consisted of the following: (i) history of or current endocrinopathy (all stages); (ii) type 1 or 2 diabetes mellitus, insulin resistance; (iii) known condition of lipid/cholesterol metabolism; (iv) presence of any psychiatric disorder; (v) current or past use of psychiatric medication; (vi) glucocorticoid use within the last 6 months; (vii) diagnosis of learning difficulties and/or full-scale IQ <70; (viii) medication known to affect steroid metabolism; and (ix) pregnancy.
Paired blood and saliva samples were collected from both patients and controls. Samples were collected in the morning between 8:00 and 9:00 am using standardized collection methods [sample collection protocols available (15)]. For patients with CAH, the samples were collected after the morning glucocorticoid dose. The samples were obtained locally in participating centers and then sent for centralized steroid hormone analysis by LC-MS/MS.
Steroid hormone analysis
The samples were analyzed using LC-MS/MS to measure plasma and salivary concentrations for three parameters commonly used in monitoring CAH control and two 11-oxygenated-C19 androgens: 17OHP, A4, T, 11OHA4, and 11KT. In addition, concentrations of plasma cortisol, salivary cortisol, and salivary cortisone were measured.
Salivary methods
The LC-MS/MS assay used for the measurement of salivary hormone concentrations and its validation were recently described in another paper (19). Samples (300 μL of unstimulated whole saliva) and internal standard (20 μL) were prepared by supported liquid extraction with dichloromethane and were reconstituted in 40% methanol. The internal standard mixture contained [13C3]-(2,3,4)–17α-OHP, D7-(2,2,4,6,6,16,16)-4-androstene-3,17-dione, [13C3]-(2,3,4)-T, D7-2,2,4,6,6,16,16-4-androsten-11β-ol-3,17-dione, and D3-16,16,17-11-ketotestosterone. After on-line solid-phase extraction with C18 cartridges, liquid chromatography was performed on a C8 column using a water/methanol gradient containing 0.1% formic acid and 2 mmol/L ammonium acetate. A Waters TQ-S mass spectrometer operating in positive ion mode was used for quantification. Total run time was 6.4 minutes. The full validation of the assay was published previously (19). In brief, recovery was between 89% and 109%, with ion suppression between 86% and 105% for all analytes. Intra-assay and interassay comparisons showed a coefficient of variation (CV) <10%, and the bias between measured and nominal concentrations was between −8% and 10%. Interference with a large set of natural and synthetic steroids was excluded. The lower limits of quantification, defined as the lowest concentrations with a CV and a bias of <20% for 10 replicates, was 12.5 pmol/L for 17OHP, 6.25 pmol/L for A4, 5 pmol/L for T, 50 pmol/L for 11OHA4, and 5 pmol/L for 11KT. Postextraction stability was tested for an overnight period at 10°C (17OHP, A4, and T) or at 4°C (11OHA4 and 11KT). The bias between the direct and poststorage analysis was between −8.4% and 8.8% for 17OHP, −14.9% and 4.9% for A4, −30.6% and 19.9% for T, −8.8% and 4.8% for 11OHA4, and −8.3% and −0.5% for 11KT. Carryover was 0.15% for 17OHP, 0.62% for A4, 0.65% for T, 0.075% for 11OHA4, and 0.036% for 11KT (19).
Plasma methods
Plasma samples (50 µL) and internal standard were prepared by supported liquid extraction with methyl-tert-butyl ether and were reconstituted in 55% methanol. The internal standard mixture was similar to that of the saliva method. Liquid chromatography was performed on a Waters Acquity UPLC® HSS T3 1.8-µm 50 × 2.1‒mm analytical column using a water/methanol gradient containing 0.1% formic acid and 2 mmol/L ammonium acetate. A Waters TQ-S mass spectrometer operating in positive ion mode was used for quantification. Total run time was 4 minutes per sample. For all analytes, recovery was between 96% and 109%, and matrix effects were negligible (<10%). Intra-assay and interassay comparisons showed CV < 8%, and the bias between measured and nominal concentration was <3% for 11OHA4 and 11KT and <7% for T, A4, and 17OHP. Interference with a large set of natural and synthetic steroids was excluded. The limit of quantitation was 0.1 nmol/L for T, A4, 11KT, and 11OHA4 and 0.2 nmol/L for 17OHP. A rapid assay was conducted for plasma cortisol analysis as previously described (20).
Statistical analysis
Data were tested for normality using the Shapiro-Wilk test, and nonparametric tests were used for data that were not normally distributed. The χ2 test was used to compare patients and controls in relation to age groups, sex, and pubertal stage. Steroid hormone concentrations between groups were compared using the Mann Whitney U test. To explore the relationship between plasma and salivary hormone concentrations, we used Spearman correlations. A P value <0.05 was considered statistically significant. For both patients and controls, the plasma-saliva pairs were excluded from the analysis if hormone concentrations were undetectable or could not be reported because of sample inadequacy. Statistical analysis and computation were carried out using SPSS Statistics Software version 25 and GraphPad Prism 7.
Results
Characteristics of participants
The studied cohort consisted of 78 patients (35 males, 43 females) and 62 controls (26 males, 36 females). The median age in the patient group was 12.8 years, and the interquartile range was 10.4 to 15.6 years; for controls, the median age was 13.3 years, and the interquartile range was 10.5 to 16.3 years. The patients were statistically similar to the controls regarding sex and age distribution [χ2(1, N = 140) = 0.121; P = 0.72 for sex; χ2(1, N = 140) = 0.025; P = 0.87 for age]. However, as expected, there were significant differences between the two groups in relation to pubertal status, with more patients with CAH presenting at an advanced pubertal stage compared with controls (χ2(1, N = 140) = 11.81; P = 0.008) (Table 1).
Group Characteristics
| Patients | Controls | Statistical Difference | |
|---|---|---|---|
| Number | 78 | 62 | |
| Age, y | 12.8 (10.4–15.6) | 13.3 (10.5–16.3) | P = 0.36 |
| <12 | 35 (44.9%) | 27 (43.5%) | P = 0.87 |
| 12–18 | 43 (55.1%) | 35 (56.5%) | |
| Girls | 43 (55.1%) | 36 (58.1%) | P = 0.72 |
| Boys | 35 (44.9%) | 26 (41.9%) | |
| Tanner stage | P = 0.008 | ||
| 1–2 | 17 (21.7%) | 25 (40.3%) | |
| 3–4 | 33 (42.3%) | 29 (46.7%) | |
| 5 | 22 (28.2%) | 5 (8%) | |
| Not known | 6 (7.6%) | 3 (4.8%) |
Age is expressed as median with interquartile range in parentheses. The statistical difference was explored using the χ2 test. The statistics are expressed as numbers with the percentages indicated in parentheses.
In the patient group, 13 saliva samples (16.6%) were reported as insufficient or unsuitable. In the control group, four saliva samples (6.4%) were insufficient.
Regarding glucocorticoid treatment, 72 patients were treated with hydrocortisone, with daily doses ranging from 4 to 27 mg/m2; six patients were treated with prednisolone, with daily doses between 3 and 4 mg/m2 (hydrocortisone equivalent of 15 to 20 mg/m2 per day).
There was wide variability in the time elapsed from the administration of the glucocorticoid dose to the collection of the blood and saliva samples, ranging from 0 hours to 15 hours 15 minutes, with a median of 2 hours 29 minutes. For most patients treated with hydrocortisone (41.4%), samples were collected between 2 and 3 hours after the glucocorticoid dose, with samples collected within 1 hour for 5.7% patients, 1 to 2 hours for 25.7%, and 3 to 4 hours for 18.5%. For the rest of the patients (8.7%), samples were collected after 5 hours from the last dose of hydrocortisone.
Plasma and salivary hormone concentrations
Plasma and salivary hormone concentrations were significantly higher in patients than in controls (P < 0.001) for four of the measured steroid hormones (A4, 17OHP, 11OHA4, and 11KT). Significant differences were maintained for these hormones when subgroups of participants were compared on the basis of sex and age. No significant differences for plasma and salivary T were found when patients were compared with controls (P = 0.143 for plasma, and P = 0.681 for saliva). However, when differences between subgroups were analyzed on the basis of age and sex, plasma testosterone was significantly higher in female patients (P < 0.001) and in patients younger than 12 years (P = 0.008) than in matched controls. In contrast, in male participants, significantly higher plasma T concentrations were found in controls than in patients (P = 0.01). In pubertal boys, the plasma T level was significantly higher in controls than in patients (P = 0.001) [Fig. 1;(15)].
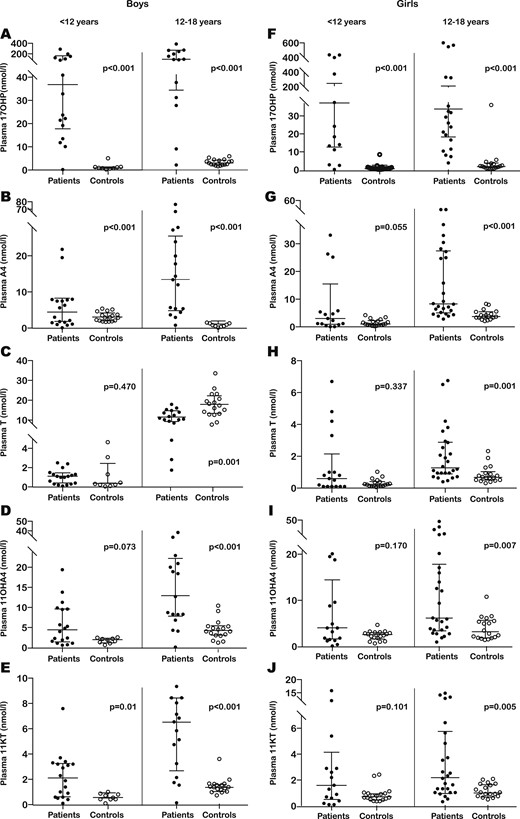
Comparison of plasma steroid concentrations between patients (dark dots) and controls (clear dots). (A–E) Results obtained for boys aged <12 y (left pair of scatter columns) and 12 to 18 y (right pair of scatter columns) for (A) 17OHP, (B) A4, (C) T, (D) 11OHA4, and (E) 11KT. (F–J) Results obtained for girls aged <12 years of age (left pair of scatter columns) and 12 to 18 y (right pair of scatter columns) for (F) 17OHP, (G) A4, (H) T, (I) 11OHA4, and (J) 11KT. The horizontal bars within all scatter columns correspond to the median and interquartile range. Statistical analysis was performed with the Mann Whitney U test.
Correlations between plasma and saliva steroid concentrations in patients with CAH
In patients with CAH due to 21OHD, strong correlations were detected between plasma and salivary steroid concentrations for all five hormones analyzed. The strongest correlations were found for A4 (rs = 0.931; P < 0.001) and 11KT (rs = 0.944; P < 0.001). Weaker correlations between plasma and salivary hormone concentrations were detected for T (rs= 0.867; P < 0.001), 17OHP (rs = 0.871; P < 0.001), and 11OHA4 (rs = 0.876; P < 0.001) (Fig. 2). We obtained very similar results when investigating partial correlations between plasma and salivary steroid concentrations, controlling for time elapsed from glucocorticoid dose to sample collection and for glucocorticoid dose for body surface area: 17OHP (rs = 0.809; P < 0.001), A4 (rs = 0.909; P < 0.001), T (rs = 0.897; P < 0.001), 11OHA4 (rs = 0.875; P < 0.001), and 11KT (rs = 0.915; P < 0.001) (15).
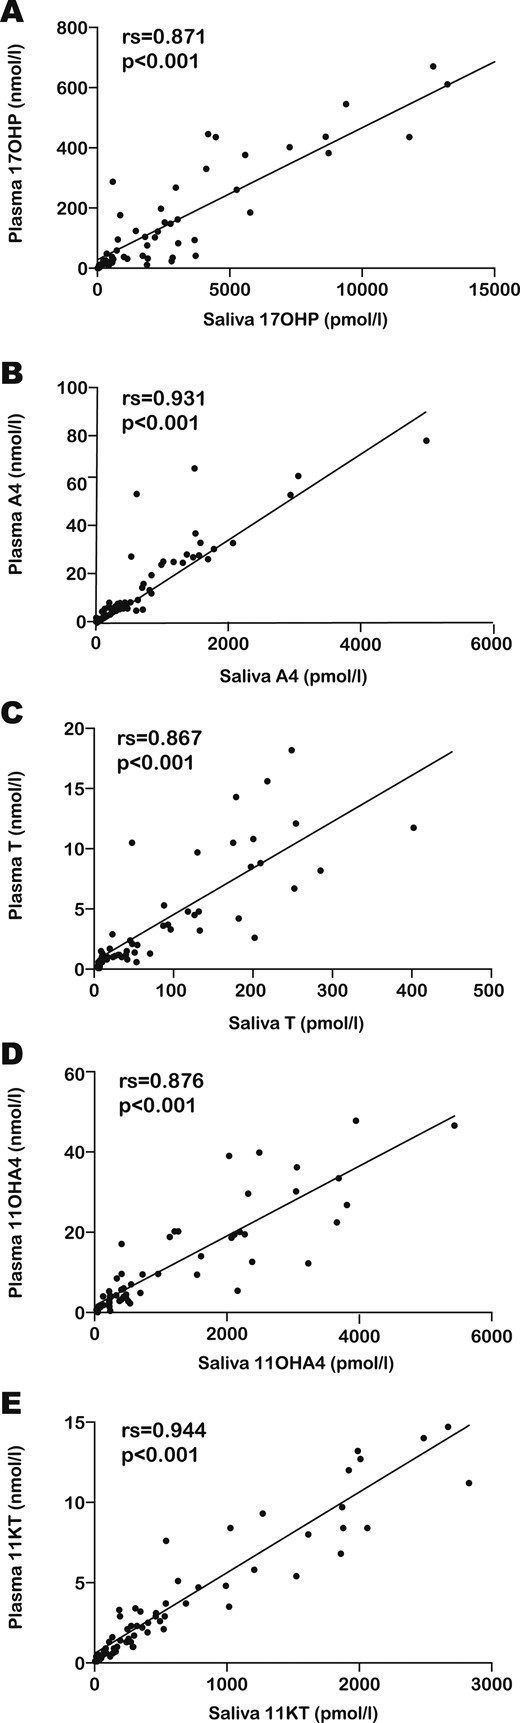
The scatter graphs show the relation between plasma (vertical axis) and salivary (horizontal axis) steroid concentrations in patients with CAH for (A) 17OHP, (B) A4, (C) T, (D) 11OHA4, and (E) 11KT. The upper left corner of each scatter graph depicts the results of the Spearman correlations (rs and P value).
In addition, strong correlations were observed in patients with 21OHD when we analyzed subgroups on the basis of sex and age. In patients younger than 12 years, the strongest relationship between plasma and saliva was found for 17OHP (rs = 0.923; P < 0.001), whereas in patients aged 12 to 18 years, 11KT (rs = 0.962; P < 0.001) showed the best correlation between plasma and saliva. In male patients, the strongest correlation was noted for A4 and 11KT (rs = 0.932; P < 0.001 for both hormones), whereas in girls, the correlation found for 11KT (rs = 0.940; P < 0.001) was slightly superior to that for A4 (rs = 0.918; P < 0.001). For all subgroups of patients, the weakest correlation between plasma and saliva was detected for T, with the exception of female patients, for whom the correlation between plasma and saliva for T was comparable to that of A4 (15).
Acknowledging the markedly elevated concentrations of plasma 17OHP that were recorded in the patient group, we analyzed correlations between plasma and salivary steroid hormones separately for the 40 patients found to have 17OHP concentrations within the clinically relevant range (0 to 60 nmol/L). We found significant correlations for all five steroid hormones, albeit weaker than those obtained when all patients were included in the analysis: 17OHP (rs= 0.768; P < 0.001), A4 (rs = 0.896; P < 0.001), T (rs = 0.729; P < 0.001), 11OHA4 (rs = 0.770; P < 0.001), and 11KT (rs = 0.896; P < 0.001) (15). Of note, of all the assessed steroid hormones, 11KT maintained the highest correlation between plasma and saliva.
Correlations between plasma and saliva steroid concentrations in the control group
In the control group, correlations between plasma and salivary steroids were generally weaker than those in the patient group: 17OHP (rs = 0.641; P < 0.001), A4 (rs = 0.925; P < 0.001), T (rs = 0.787; P < 0.001), 11OHA4 (rs = 0.828; P < 0.001), and 11KT (rs = 0.842; P < 0.001) (15). This may be explained by the fact that both plasma and salivary steroid concentrations were significantly lower in controls than in patients (15). When analyzing control subgroups, we did not find a correlation between plasma and saliva T in girls, whereas in children under 12 years, we did not find correlations for 17OHP and T (15).
Cortisol and cortisone concentrations
In patients with CAH, plasma cortisol concentrations ranged from 14.7 to 827.3 nmol/L, with a median of 287.3 nmol/L; salivary cortisol ranged from 0.5 to 2410 nmol/L, with a median 15.7 nmol/L; and salivary cortisone ranged from 0.8 to 134 nmol/L, with a median of 24.6 nmol/L. In 13 patients, salivary cortisol exceeded plasma cortisol concentrations. For these samples, the collection time in relation to the previous hydrocortisone dose ranged from 90 to 205 minutes, which was similar in all other collected samples. The control group was statistically similar to patients with regard to plasma cortisol and salivary cortisone concentrations, whereas salivary cortisol concentrations were significantly lower in controls (P < 0.001) (15).
We obtained similar results when limiting the analysis to patients treated with hydrocortisone (n = 72). As expected, we found a negative correlation between the time elapsed from hydrocortisone dose to sample collection and plasma cortisol (rs = −0.328; P = 0.005), salivary cortisol (rs = −0.282; P = 0.027), and salivary cortisone (rs = −0.262; P = 0.031) concentrations. Plasma cortisol concentrations correlated well with salivary cortisone (rs = 0.701; P < 0.001) but not with salivary cortisol. However, after excluding from the analysis samples in which salivary cortisol exceeded plasma cortisol, we found a weak correlation between plasma and salivary cortisol concentrations (rs = 0.468; P = 0.002). By comparison, in healthy controls, plasma cortisol correlated well with both salivary cortisone (rs = 0.672; P < 0.001) and salivary cortisol (rs = 0.677; P < 0.001). In patients with CAH, no correlation was detected for plasma or saliva between either cortisol or cortisone concentration and any of the five adrenal steroids measured (15). This was maintained after excluding patients with suppressed 17OHP concentrations and controlling for the collection time.
After excluding patient samples with a salivary cortisol concentration greater than the plasma cortisol concentration from the analysis, we detected weak negative correlations between plasma T and plasma cortisol (rs = −0.270; P = 0.044), salivary cortisol (rs = −0.305; P = 0.049), and salivary cortisone (rs = −0.305; P = 0.047), plasma A4 and salivary cortisol (rs = −0.318; P = 0.043). No additional significant relationships were found between cortisol or cortisone and any of the other androgens. In contrast, in healthy controls we found that levels of plasma cortisol, salivary cortisol, salivary cortisone, and the five adrenal steroids correlated in plasma and saliva, especially in the case of 11OHA4 (15).
Patient classification in relation to plasma 17OHP concentrations
We classified patients according to plasma 17OHP concentration, defining concentrations within the range of 12 to 36 nmol/L as “normal,” concentrations <12 nmol/L as “low,” and concentrations >36 nmol/L as “high.” Only 18 patients (23.1%) were found to have 17OHP concentrations within the target range; 17OHP concentration was high in 46 patients (59%) and low in 14 patients (17.9%). There were no significant differences between patient subgroups based on 17OHP concentration with respect to the time elapsed from glucocorticoid administration to sample collection. Hormonal concentrations in the three subgroups showed that 11OHA4 and 11KT levels were significantly higher in the subgroup with high 17OHP than in the subgroup within the target range in both plasma (P < 0.001 for both 11OHA4 and 11KT) and saliva (P < 0.001 for 11OHA4, and P = 0.001 for 11KT).
Comparing the subgroup with low 17OHP concentration against those with normal 17OHP concentration, we found that both the 11-oxygenated steroids were significantly lower in the suppressed group, although the difference was more significant in plasma (P = 0.006 for 11OHA4 and P = 0.005 for 11KT) than in saliva (P = 0.021 for 11OHA4 and P = 0.043 for 11kT). We found consistent statistical differences between the groups with low and high 17OHP concentrations for the two 11-oxygenated steroids in both plasma and saliva (P < 0.001) (Figs. 3 and 4) (15). When comparing age and sex subgroups of patients with their control counterparts in relation to plasma 11-oxygenated androgen concentrations, we found that in most cases control values overlapped with those of patients who had been classified by plasma 17OHP as either suppressed or within the target range (15).
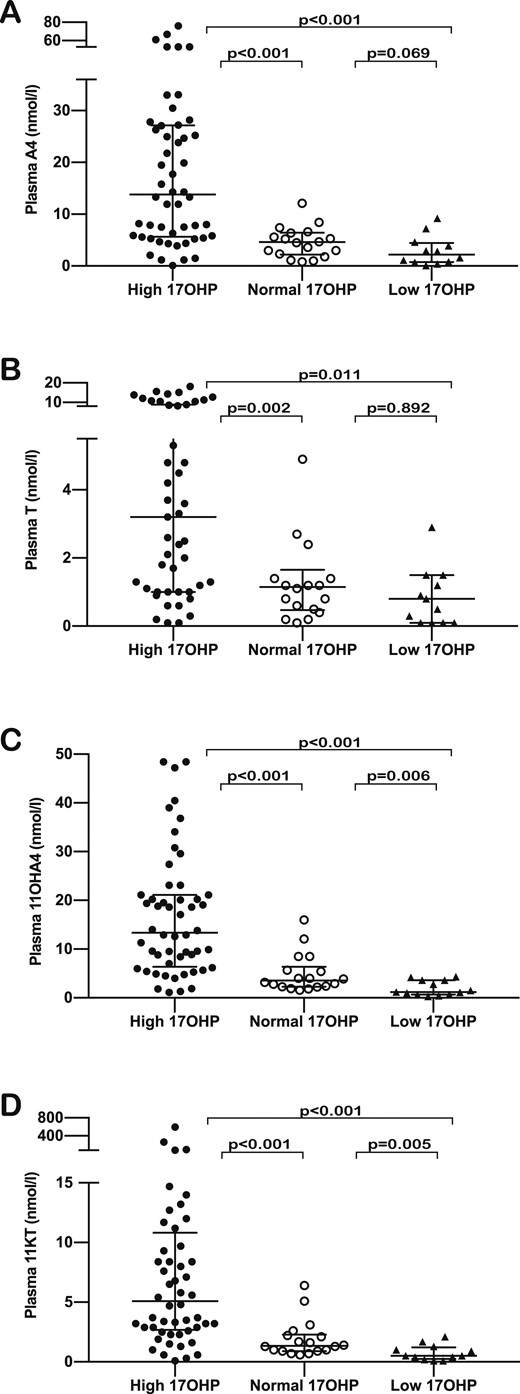
Comparison of plasma steroid concentrations between patient subgroups based on plasma 17OHP concentrations—high (dark dots), normal (clear dots), and low (dark triangles)—for (A) A4, (B) T, (C) 11OHA4, and (D) 11KT. The horizontal bars within the scatter columns correspond to the median and interquartile range. The P values are the results of the Mann Whitney U test.
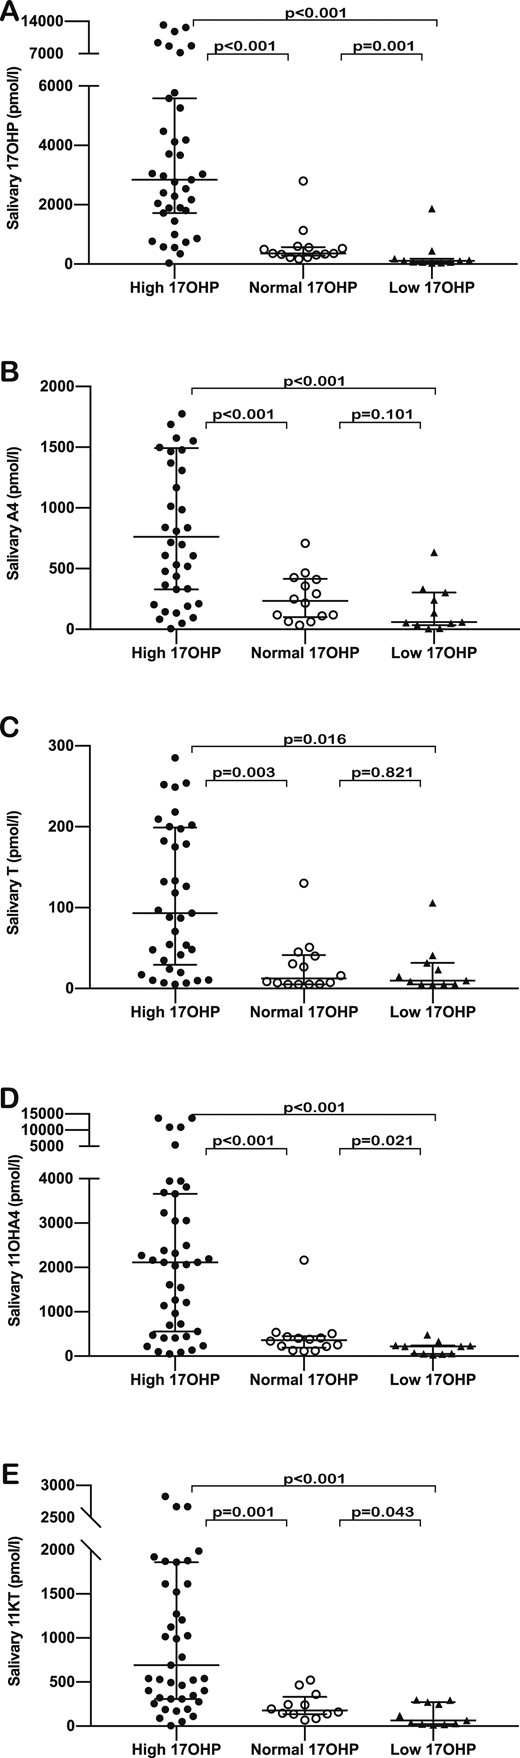
Comparison of salivary steroid concentrations between patient subgroups classified according to plasma 17OHP concentrations—high (dark dots), normal (clear dots), and low (dark triangles)—for (A) 17OHP, (B) A4, (C) T, (D) 11OHA4 , and (E) 11KT. The horizontal bars within the scatter columns correspond to the median and interquartile range. The P values are derived from analysis using the Mann Whitney U test.
As a next step, we analyzed correlations between plasma and salivary 11KT for patient subgroups based on 17OHP concentrations. We found strong correlations in all three subgroups (low 17OHP group: rs = 0.792; P = 0.004; within target range group: rs = 0.763; P = 0.002; and high 17OHP group: rs = 0915; P < 0.001).
Correlations of plasma 11KT with T and 17OHP in patients with CAH
In patients with CAH, we found correlations between plasma 11KT and T in the patient group (rs = 0.691; P < 0.001) as well as in subgroups of age and sex, with the exception of boys 12 to 18 years of age (rs = 0.520; P = 0.039). Of note, in pubertal boys with 21OHD, we found that 11KT and T correlated strongly in saliva (rs = 0.811; P < 0.001). We found strong correlations between plasma 11KT and 17OHP for all subgroups of age and sex (Fig. 5).
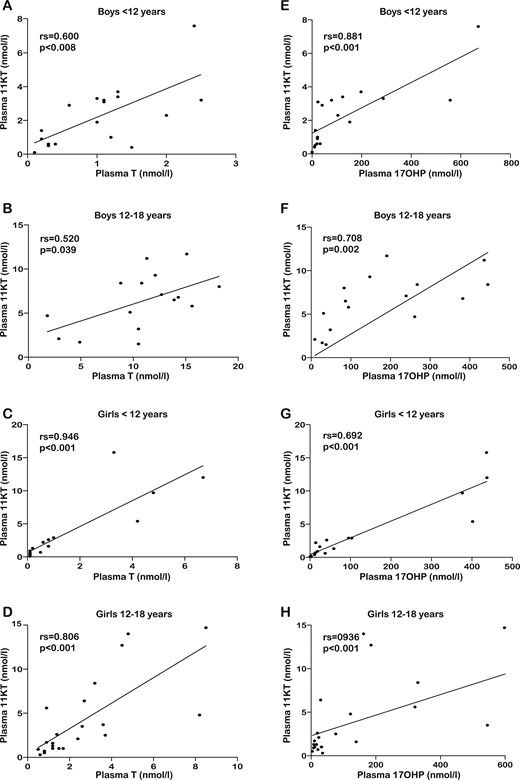
The scatter graphs in the left column present the relation between plasma 11KT (vertical axis) and plasma T (horizontal axis) in (A) boys aged <12 y, (B) boys 12 to 18 y, (C) girls <12 y, and (D) girls 12 to 18 y. The scatter graphs in the right column present the relation between plasma 11KT (vertical axis) and plasma 17OHP (horizontal axis) in (E) boys aged <12 y, (F) boys between 12 and 18 y, (G) girls <12 y, and (H) girls between 12 and 18 y. The results of the Spearman correlations (rs and P value) are shown in in the upper left corner of each scatter plot.
Discussion
This study analyzed the correlation of adrenal-specific 11-oxygenated-C19 androgens between plasma and salivary concentrations in children and young people with CAH. It was performed to explore the measurement of salivary steroid hormones, including 11-oxygenated-C19 androgens, in assessing disease control in patients with CAH.
Currently, 17OHP, A4, and T are used for this purpose. However, they all have limitations as indicators of adrenal excess: 17OHP concentrations fluctuate widely in relation to glucocorticoid dose (21), whereas A4 and T are also synthesized by the gonads, which reduces their specificity and relevance as biomarkers of adrenal androgen excess during puberty (18). Recent studies exploring 11-oxygenated-C19 steroids have proven their adrenal origin and suggested that they can serve as biomarkers of adrenal androgen excess in CAH (13) and in women with polycystic ovary syndrome (22). Biochemical assessment of patients with 21OHD demonstrated increased concentrations of 11-OHA4, 11-hydroxytestosterone, 11-ketoandrostenedione, and 11KT compared with concentrations in healthy controls (13, 14). Moreover, in adults with CAH, 11-oxygenated-C19 androgens were found to correlate with adrenal volume as a marker of adrenal hyperplasia (17). Our data confirm raised concentrations of 11OHA4 and 11KT in children and young people with CAH and also suggest that measurements of these adrenal-specific androgens are valuable biomarkers for adrenal androgen excess and disease control in patients with CAH.
Because of fluctuations in levels of adrenal steroid precursors and hormones in relation to treatment, single measurement of hormonal concentrations is of limited use in CAH; in addition, it was shown that hormonal profiles are needed to effectively monitor and adjust glucocorticoid treatment (23). From this perspective, CAH is similar to type 1 diabetes mellitus, in that studies involving continuous glucose monitoring have demonstrated better patient outcomes associated with number of self-managed blood glucose measurements throughout the day (24, 25). Thus, we are tempted to speculate that there is a need for more suitable tests allowing for more frequent measurement of more specific adrenal steroid hormone levels in patients with CAH and that such an approach may improve health outcomes if it leads to more frequent adjustments of treatment or more accurate glucocorticoid treatment. Because of their noninvasive nature, salivary tests are likely to be more acceptable for patients, allowing for repeated measurements and daily hormonal profiles, including classic measured parameters (17OHP, A4, and T) and 11-oxygenated-C19 steroids (11OHA4 and 11KT).
Our data clearly demonstrated a very tight correlation between plasma and salivary concentrations of these five steroid hormones. Of note, the best correlations were found for 11KT, an adrenal-derived 11-oxygenated-C19 androgen, as well as 17OHP and A4, which are widely used for CAH monitoring (4). These results were consistent across subgroups of patients according to age and sex. Correlations between plasma and salivary steroid concentrations were also found in controls. However, the correlations in controls were generally not as strong as in those in patients with CAH. This is likely linked to the significantly lower steroid concentrations in controls. However, this appears to be of minor relevance to monitoring of disease control in patients with CAH, for whom raised 17OHP concentrations have been suggested as treatment targets (4, 26).
The correlations between plasma and salivary steroids observed in our study are generally consistent with the findings of previous research on this topic. Even before the use of LC-MS/MS in hormonal assays, good correlations were found between salivary and serum 17OHP and A4 concentrations using RIAs in patients with CAH (27). More recent research measuring plasma and salivary steroid concentrations in 19 healthy adults using LC-MS/MS at four times during one day showed strong serum to salivary correlations for T, A4, dehydroepiandrosterone, and 17OHP. The authors also reported diurnal fluctuations of these hormones in saliva, consistent with their fluctuations in plasma (7). Other studies that focused on measuring salivary 17OHP and A4 levels in patients with CAH confirmed correlations between plasma and salivary concentrations for both hormones (9). Further evidence showed that their combined use increased the accuracy of the interpretation when glucocorticoid treatment was monitored in patients with 21OHD (12). Of note, another study involving patients with CAH also found a strong correlation between salivary and serum 17OHP concentrations and described a dynamic response to glucocorticoid treatment in salivary 17OHP concentration (8). Our findings support this concept, as the strength of plasma-salivary correlations was maintained when time elapsed between glucocorticoid dose and sample collection was taken into account. Furthermore, using daily profiles of salivary 17OHP was an effective method for monitoring glucocorticoid treatment in patients with 21OHD (23). However, no data exist regarding the use of salivary measurements of adrenal-specific 11-oxygenated-C19 steroids as a meaningful test to assess adrenal androgen excess.
We compared patient subgroups on the basis of a previously suggested target range for plasma 17OHP (26) to explore whether 11KT and 11OHA4 can differentiate between patients who are undertreated or overtreated with glucocorticoids. A range of 12 to 36 nmol/L for plasma 17OHP concentration, as previously suggested cutoffs for good control, was chosen for this analysis. Admittedly, although it provides a convenient biochemical tool for classifying disease control, 17OHP has recognized limitations that challenge clinical interpretation, especially in relation to low or normal values. This is supported by evidence suggesting that the recommended target range for 17OHP results in overtreatment (2). Moreover, we acknowledge that our results were based on hormone measurements conducted at variable times after the morning glucocorticoid dose, which further limited the clinical relevance of plasma 17OHP concentrations. Nevertheless, the strong correlations between plasma and salivary 11KT and 11OHA4 in the subgroups with low, normal, and high 17OHP concentrations are promising with regard to their potential as a marker of treatment control. Of note, we found consistent overlapping of both plasma and salivary concentrations for 11KT and 11OHA4 between these subgroups, despite significant differences in the overall concentrations expressed by the median with interquartile range. This finding may well be attributable to the limited value of 17OHP as a marker of treatment control when samples are not strictly timed, which is difficult to achieve in clinical practice. The widespread individual variation of 17OHP concentration, in relation to the time of day and glucocorticoid dose, is well established, and clinical parameters remain the gold standard for adequate control in practice (2). In our clinical practice, the relevance of 17OHP as a biochemical marker is limited to highlighting overtreatment, whereas A4 and T are better biomarkers for undertreatment. Moreover, we acknowledge that the time of sample collection in relation to the glucocorticoid dose varied among patients in our study, further limiting the reliability of androgen concentrations in establishing treatment control. Such reflections emphasize the need to identify more reliable biochemical markers of disease control that are less prone to fluctuations.
Although plasma concentrations of 17OHP, A4, 11OHA4, and 11KT overall were significantly higher in patients than in controls, when we analyzed the scatterplots for the distribution of individual values, we identified consistent overlap between patients and controls. This was especially pronounced in the case of the two 11-oxygenated androgens and was much less noticeable for 17OHP. On closer examination, we found that in most cases, the overlap with control values corresponded to patients identified as having plasma 17OHP concentrations either in the target range or in the suppressed range. This finding supports the potential clinical usefulness of 11-oxygenated androgens in defining undertreatment in patients with CAH. In addition, this further highlights the need to use profiles of several steroid hormones for reliable biochemical monitoring when assessing disease control.
Although higher plasma concentrations were detected in patients for most of the measured hormones, this was not the case for T. Plasma T level was significantly higher in male controls than in male patients. In contrast, girls and children of prepubertal age had significantly higher T concentrations than their controls. This is very likely due to the dual origin of T from the adrenals and gonads, with a physiological rise in healthy pubertal males. In male patients with 21OHD, the suppression of testicular-derived T by adrenal androgen excess explains the differences noted between patients and controls and confirms observations in adult males with CAH (18, 28). The increased concentration of T in females and prepubertal individuals is likely linked to adrenal androgen excess.
By contrast, 11KT plasma and salivary concentrations were significantly higher for all patient subgroups. These findings are consistent with those reported by other studies that explored androgen profiles in patients with CAH (13, 14), supporting the notion that 11KT is a superior marker of adrenal androgen excess in CAH. Of note, we found that in the overall group of CAH patients, 11KT correlated with T in both plasma and saliva, with the correlation being consistently stronger in saliva. In pubertal boys, we found no correlation between plasma 11KT and T concentrations in patients and controls. Another recent study demonstrated a negative correlation between 11KT and T in pubertal males and a positive correlation in pubertal females, attributing these findings to the suppression of testicular T synthesis by adrenal androgen excess in 21OHD (13).
Of note, in the subgroup of pubertal male patients, we found strong correlations between T and 11KT concentrations in saliva, despite the absence of a correlation in plasma. This suggests that salivary T is a poor indicator of plasma T, which has been suggested in previous studies (29, 30). Possible explanations for the discrepancies between plasma and salivary T concentrations relate to the different protein content between plasma and saliva, affecting the binding and availability of T (29) as well as the conversion of T to A4 in the salivary glands (31). Moreover, when our results are interpreted, consideration must be given to the risk of measurement errors related to sample storage that was reported for T when analyzed by LC-MS/MS (19).
Our findings related to the correlation between plasma cortisol and salivary cortisone concentrations are consistent with recently published evidence (21, 32) demonstrating that salivary cortisone provides a good reflection of plasma cortisol. In contrast, we found that salivary cortisol was very high for a substantial number of patients, which limited its usefulness as a marker for plasma cortisol. We believe that the most likely explanation for the dramatically raised salivary cortisol level was sample contamination following administration of oral hydrocortisone. Applying our findings to clinical practice, we would recommend that salivary cortisol should be collected before the glucocorticoid dose, whereas samples taken randomly or after the glucocorticoid dose should be tested for both cortisone and cortisol concentrations to allow differentiation between overexposure to cortisol and sample contamination.
Of note, although we found consistent correlations between plasma cortisol/salivary cortisone and the five adrenal steroids measured in plasma and saliva in controls, this was not the case in the CAH group, even when we controlled for sample collection time and excluded cases of excessively high salivary cortisol. Previous research exploring the pharmacokinetics of oral cortisol in children with CAH in relation to 17OHP and A4 profiles yielded contradictory results. An earlier study using RIA for steroid assays found a negative correlation between plasma cortisol and 17OHP concentrations, but not A4 concentration, in 19 patients with nonsuppressed 17OHP (33). However, a more recent study involving 34 children with CAH and using LC-MS/MS for hormone measurements did not identify a relationship between either 17OHP or A4 and cortisol (34). The authors attributed their results to major interindividual variability in cortisol pharmacokinetics and in the response of the hypothalamo-pituitary-adrenal axis to treatment.
A limiting factor in our study was the substantial number of insufficient/unsuitable salivary samples, which in turn reduced the number of paired samples available for correlations to 65 for patients and 58 for controls. We also acknowledge that our study involved single time-point hormonal measurements and did not explore the aspect of salivary hormonal variations throughout the day. Moreover, the Endocrine Society recommendation for monitoring treatment in CAH states that hormonal measurements should be timed in relation to medication (2). This was not feasible in our study, as the timing of glucocorticoid doses varied widely among participants; thus, our results were based on random hormonal measurements, limiting their clinical relevance. However, there is evidence indicating that in patients with CAH, adrenal androgen secretion follows a circadian rhythm that is influenced by glucocorticoid medication (21). In our study, although there was no standardization of sample collection in relation to glucocorticoid dose, the plasma and saliva specimens were obtained between 8:00 and 9:00 am, when androgen concentrations are expected to be higher. A study conducted on healthy adults undergoing the Synacthen® test identified a 60-minute lag in the rise of salivary concentrations compared with plasma concentrations for cortisol and cortisone (32). This finding highlights another important aspect—namely, that the correlation between salivary and plasma androgen hormone concentrations may be time sensitive. Thus, further research exploring fluctuations in salivary androgens in relation to replacement therapy may yield more accurate information regarding their potential use in monitoring therapy control.
In summary, we demonstrated a strong correlation between plasma and salivary concentrations of androgen hormones in patients with CAH. Our study also demonstrated correlations between plasma and salivary concentrations for 11-oxygenated-C19 androgens in children with CAH. Our findings suggest that the combination of salivary steroid hormones can serve as a noninvasive monitoring tool in CAH, one that will provide a major amount of additional information and will ultimately improve management and outcomes in CAH.
Acknowledgments
During the final stage of writing our report, we were saddened to learn of the death of our colleague and co-investigator Dr. Carlo L. Acerini, of the Department of Paediatrics, University of Cambridge, Cambridge, United Kingdom. Dr Acerini made important contributions to the design and data analysis in this article. We value his contributions to the field and will miss him as a colleague and friend. We dedicate this paper to his memory.
Financial Support: This study was supported by the National Institutes of Health Research Rare Disease Translational Research Collaboration (NIHR RD TRC; to N.P.K.), the Chief Scientist Office of Scotland, and Diurnal Ltd.
Clinical Trial Information: Clinical Trials Registration Number: SCH/15/088 (approved 27 January 2016).
Additional Information
Disclosure Summary: The NIHR RD TRC grant scheme included an industry collaborator and received financial support from Diurnal Ltd.
Data Availability: The datasets generated and/or analyzed during the current study are not publicly available but are available from the corresponding author on reasonable request.
Abbreviations:
- 11KT
11-ketotestosterone
- 11OHA4
11-hydroxyandrostenedione
- 17OHP
17-hydroxyprogesterone
- 21OHD
21-hydroxylase deficiency
- A4
androstenedione
- CAH
congenital adrenal hyperplasia
- CV
coefficient of variation
- LC-MS/MS
liquid chromatography–tandem mass spectrometry
- T
testosterone
