


Abstract
Polycystic ovary syndrome (PCOS) is a chronic disease affecting reproductive function and whole-body metabolism. Although the etiology is unclear, emerging evidence indicates that the epigenetics may be a contributing factor.
To determine the role of global and genome-wide epigenetic modifications in specific immune cells in PCOS compared with controls and whether these could be related to clinical features of PCOS.
Cross-sectional study.
Women with (n = 17) or without PCOS (n = 17).
Recruited from the general community.
Isolated peripheral blood mononuclear cells were analyzed using multicolor flow cytometry methods to determine global DNA methylation levels in a cell-specific fashion. Transcriptomic and genome-wide DNA methylation analyses were performed on T helper cells using RNA sequencing and reduced representation bisulfite sequencing.
Women with PCOS had lower global DNA methylation in monocytes (P = 0.006) and in T helper (P = 0.004), T cytotoxic (P = 0.004), and B cells (P = 0.03). Specific genome-wide DNA methylation analysis of T helper cells from women with PCOS identified 5581 differentially methylated CpG sites. Functional gene ontology enrichment analysis showed that genes located at the proximity of differentially methylated CpG sites belong to pathways related to reproductive function and immune cell function. However, these genes were not altered at the transcriptomic level.
It was shown that PCOS is associated with global and gene-specific DNA methylation remodeling in a cell type–specific manner. Further investigation is warranted to determine whether epigenetic reprogramming of immune cells is important in determining the different phenotypes of PCOS.
Polycystic ovary syndrome (PCOS) is a metabolic and reproductive disorder with a complex and ill-defined etiology. It is commonly characterized by increased levels of androgens, inflammatory cytokines, insulin resistance, and an increased prevalence of subfertility (1–3). Familial clustering of PCOS is well documented, providing evidence for a heritable component of the syndrome (4, 5). However, investigations to identify the single-nucleotide polymorphisms that may underpin the genetic basis of PCOS have been inconclusive despite recent advances in the field from genome-wide association studies (6–9).
Emerging evidence suggests a role for altered epigenetic programming in the etiology of PCOS (10–14). Genome-wide analysis of transcriptomic and DNA methylation status have been conducted in adipose tissue and skeletal muscle revealing tissue-specific epigenetic, as well as transcriptomic differences between women with and without PCOS (13, 14). In adipose tissue, DNA methylation analysis revealed aberrant patterns in pathways involved in adipogenesis, inflammation, glucose regulation, and energy metabolism, and these DNA methylation sites corresponded with 30 differentially expressed genes (13). Similarly, in skeletal muscle, transcriptomic analysis found significantly enriched pathways in immune function and disease (14). Finally, both adipose tissue and skeletal muscle showed inflammation as a significantly enriched pathway. This is important because immune cells play a critical role in metabolism and reproductive function, are the main source of inflammatory cytokines, and are known to be epigenetically regulated (15–19). These studies provide important insights into the potential contribution of epigenetic changes to the development of PCOS and rationale for further investigation into epigenetic changes in other cell types that may be affected in PCOS, such as immune cells. In both animal PCOS models, and in women with PCOS, altered immune responses and inflammatory markers have been found in various ovarian tissues, suggesting a role in the pathophysiology of the reproductive features of PCOS (20–22). Impairment of immune cell function and the infiltration of these cells in insulin-sensitive tissues have been shown to cause metabolic impairment and contribute to the onset of type 2 diabetes mellitus (T2DM) (23, 24). Thus, epigenetic remodeling of immune cells can be associated with impaired immune function and contribute to metabolic dysfunction in PCOS (15, 25, 26).
Only one study has investigated the contribution of global epigenetic changes in immune cells from women with PCOS (27). In that study, the authors measured global DNA methylation (i.e., total, non–site-specific methyl-cytosine abundance) in a mixed population of immune cells known as peripheral blood mononuclear cells (PBMCs) from women with or without PCOS and failed to find any difference (27). There is increasing evidence supporting that epigenetic changes that occur within specific cell subtypes could be masked by analyses of whole blood (28). Therefore, cell type–specific global and genome-wide methylation analyses may reveal a potential role of epigenetics in the immune system, especially in PCOS (28–30). In the current study we hypothesized that specific immune cell populations will present a different DNA methylation profile in women with PCOS compared with women without PCOS (25, 28). Using global and genome-wide DNA methylation analyses, we aimed to explore epigenetic remodeling in specific immune cell subtypes, most notably in T helper cells.
Materials and Methods
Study population
Premenopausal women (n = 34) aged between 18 and 45 years with or without PCOS were recruited from the local community (i.e., a nonclinical population). All participants provided informed written consent. Women with PCOS were confirmed by an endocrinologist (Dr. S. Shorakae or Dr. A. Joham) to have features consistent with the Rotterdam diagnostic criteria based on participants’ previous medical records. The Rotterdam criteria were used for confirmation of PCOS with two of the following: (i) oligoovulation or anovulation, (ii) clinical (hirsutism and acne) and/or biochemical hyperandrogenism, and (iii) polycystic ovaries on ultrasound and exclusion of other causes of hyperandrogenism (31, 32). Women without PCOS had no features of PCOS. Exclusion criteria were pregnancy, smoking, T2DM, known cardiovascular disease, asthma, and medications affecting endpoint measures, including hormonal contraceptives, insulin-sensitizing drugs, anti-inflammatories, and antiandrogens. This study was approved by the Victoria University Human Research Ethics Committee (HRE 14-138).
Clinical measures
All clinical measures were collected in the morning after an overnight fast. For women without PCOS, testing was conducted in the early follicular phase of the menstrual cycle (2 to 7 days after beginning menses). All women with PCOS had irregular cycles, and therefore the testing was conducted in early follicular phase when possible.
Lifestyle monitoring
In the 7 days preceding the trial, participants recorded their dietary intake via a 7-day food diary. Food diaries were analyzed by FoodWorks® (Xyris) for the major food groups (grains, fruit, vegetables, protein, and dairy), total energy (macronutrients), and fat ratios. Moderate-to-vigorous physical activity was measured via an ActiGraph (GTX3+) accelerometer. Participants wore the monitor on their right hip during waking hours for 7 days, except for bathing and swimming. Data were downloaded in 1-minute epochs, and nonwear time was defined as at least 20 minutes of zero counts. Daily moderate-to-vigorous physical activity was defined as all wear-time minutes and was calculated based on the Freedson accelerometer age cut-points (33). Self-reporting physical activity was measured via the International Physical Activity Questionnaire.
Anthropometric assessment
Height and weight were measured to calculate body mass index (BMI): [body weight (kg)/ height (m2)]. Waist and hip circumference measurements were recorded (34). Fat mass, abdominal fat mass, and fat free mass were measured by dual-energy x-ray absorptiometry (GE Lunar iDXA) and analyzed by a qualified dual-energy x-ray absorptiometry operator (D.H.).
Fasting blood samples
A sterile polyethylene catheter was inserted into the antecubital vein and baseline blood samples were collected. Plasma and serum were collected in the appropriate blood tubes via centrifugation and stored at −80°C until analysis. Blood for PBMCs isolation was collected in three acid citrate dextrose tubes (BD Biosciences) and left at room temperature until Ficoll gradient separation on the same day as described below (28).
Oral glucose tolerance test
After collecting fasting baseline blood samples, participants then underwent an oral glucose tolerance test (OGTT) via ingestion of a 75-g glucose drink during a 5-minute period with blood samples collected at 30, 60, 90, and 120 minutes (35). Blood glucose in plasma was measured by using an automated analyzer (YSI 2300 STAT Plus). Blood cell counts were measured by a hematology automated analyzer (Sysmex).
Biochemical analysis
The following assays were completed in-house at Victoria University. Plasma insulin concentration was determined by RIA according to the manufacturer’s instructions with an intravariability and intervariability of 4.2% and 3.8%, respectively (HI-14K, EMD Merck Millipore). Results from the OGTT were used to determine both insulin sensitivity and resistance using area under the curve for plasma insulin and glucose concentrations and the homeostatic assessment indices of insulin sensitivity calculated as (fasting insulin × fasting glucose/22.5) (35). IL-6 was measured using a high-sensitivity ELISA with an intraassay variability of 7.6% (ab46042, Abcam). S-Adenosylmethionine (SAM) was determined by competitive enzyme immunoassay and had an intraassay variability of 8.8% (STA-672, Cell Biolabs).
The following assays were completed in the accredited pathology laboratory at Monash Health, Australia. Lipid profiles (cholesterol, triglycerides, low-density lipoprotein, and high-density lipoprotein) were quantified by automated enzymatic methods (Architect C18000 analyzer), and high-sensitivity C-reactive protein was quantified by a highly sensitive near-infrared particle immunoassay using the Synchron LX system chemistry analyzer (Beckman Coulter). Folate was determined by the Access/Dxi folate assay, which is a competitive binding receptor assay performed on the Unicel DXI 800 system (Beckman Coulter). Homocysteine was measured using a Synchron DXC800 system chemistry analyzer (Beckman Coulter). Anti-Müllerian hormone (AMH) was analyzed using an ELISA (A16507, Immunotech/Beckman Coulter). The SHBG assay was performed using a sequential two-step immunoenzymatic (“sandwich”) assay carried out on a Unicel DXI 800 (Beckman Coulter). Testosterone was measured using the HPLC–tandem mass spectrometry method using a liquid sample extraction (AB Sciex Triple Quad 5500 liquid chromatography–tandem mass spectrometry). Free androgen index was calculated as (total testosterone × 100)/SHBG. Free testosterone (fT) was calculated by the Södergard fT calculation (36).
PBMC isolation
PBMCs were isolated by Ficoll gradient as previously described in Simar et al. (28) with some modifications. After centrifugation (1200 × g for 20 minutes, brake off) and removal of plasma, the cell suspension was diluted in RPMI 1640 (Thermo Fisher), supplemented with penicillin/streptomycin and l-glutamine, and carefully layered on Ficoll in Sepmate™ tubes (Stem Cell eTchnologies) in equal volumes and centrifuged. The buffy coat containing PBMCs was collected, washed with RPMI 1640, and resuspended in autologous plasma. Cells were counted on an automated cell counter (TC20™ automated cell counter, Bio-Rad Laboratories) before being frozen in 10% cyropreservant dimethyl sulfoxide in RPMI 1640 overnight in a controlled rate freezing container (CoolCell®, BioCision) and transferred to liquid nitrogen the following day for long-term storage.
Global DNA methylation
Global methylation in PBMCs was quantified as previously described (28). Briefly, the cells were stained with an antibody cocktail of phycoerythrin-conjugated anti-CD3, peridinin chlorophyll–conjugated anti-CD8 and anti-CD14, and allophycocyanin-conjugated anti-CD4 and anti-CD19 (Becton Dickinson). Cells were then further stained with anti–5-methylcytosine (AbD Serotec, Bio-Rad Laboratories) or with its associated isotope control (mouse IgG1, BD Biosciences) labeled with Alexa Fluor 488 according to the manufacturer’s instructions (Zenon Alexa Fluor 488 mouse IgG1, Molecular Probes, Life Technologies). Cells were incubated (20 minutes in the dark at room temperature) and then run immediately on the flow cytometer (FACSCalibur, BD Biosciences). A specific gating strategy (37) was used to separate the different cell populations and the median fluorescence intensity was measured and normalized by the median fluorescence intensity from the isotope controls for each cell population. Data were analyzed using FlowJo version 10 (Tree Star) and Cytobank.
Cell sorting
Cryopreserved PBMCs were thawed and immediately resuspended in RPMI 1640 before being washed and stained with anti-CD3 (allophycocyanin), anti-CD4 (phycoerythrin), anti-CD8 (Brilliant Violet 510), anti-CD19 (Brilliant Violet 421), anti-CD20 (phycoerythrin-cyanine or Cy7), and anti-CD14 (allophycocyanin). All antibodies were sourced from BD Biosciences (37). The stained PBMCs were washed twice in sort buffer [PBS 1% BSA, 25 mM HEPES (pH 7.0), 1 mM EDTA] before being sorted into four populations (monocytes and T helper, T cytotoxic, and B cells) using the FACSAria (BD Biosciences).
RNA sequencing
Total RNA from T helper cells was extracted using the Qiagen AllPrep DNA/RNA/miRNA universal kit (no. 80224, Qiagen) following the manufacturer’s instructions. Quality of RNA was established using the Agilent RNA 600 Nano kit and Bioanalyzer instrument (Agilent Technologies). RNA sequencing was performed according to Illumina TruSeq stranded total RNA with the Ribo-Zero Gold protocol (Illumina) as previously described (38). Each library was quantified to ensure optimum cluster densities across every lane of the flow cell using the Qubit double-stranded DNA HS assay kit (Invitrogen). Quality control for base pair size and purity was assessed using an Agilent high-sensitivity DNA chip and Bioanalyzer instrument (Agilent Technologies). Each library was diluted to 1 nM before being pooled and measured on the Illumina NextSeq 500 (Illumina).
Reduced representation bisulfite sequencing
Genomic DNA was extracted from T helper cells using the Qiagen AllPrep DNA/RNA/miRNA universal kit (no. 80224, Qiagen) following the manufacturer’s instructions. Reduced representation bisulfite sequencing (RRBS) was performed using a premium RRBS kit (no. C02030033, Diagenode) following the manufacturer’s instructions. Each library was quantified using the Qubit double-stranded DNA HS assay kit (Invitrogen) and quality controlled for base pair size and purity using the an Agilent high-sensitivity DNA chip and Bioanalyzer instrument (Agilent Technologies). Genome-wide DNA methylation of T helper cells was measured on the Illumina NextSeq 500 (Illumina).
Transcriptomic analysis
RNA sequencing raw reads were aligned to human genome (hg38) using STAR (39), and gene coverages were computed by featureCounts (40) using Gencode annotation (41). The ribosomal RNA counts were excluded from the downstream analysis. Libraries with <15 million assigned reads were removed from analysis. A generalized linear model (y ∼ 0 + disease) was fitted for disease factor by using DESeq2 pipeline (42). Genes with a false discovery rate <0.1 were considered differentially expressed.
Approximately 15 million reads per sample were assigned to genes, with 38 genes surviving the expression threshold (q < 0.1). Molecular functions and biological processes were established from the Universal Protein Resource (UniProt), which is a comprehensive resource for protein sequence and annotation data. The Kyoto Encyclopedia of Genes and Genomes (KEGG) database investigated the interaction of molecular pathways that were associated with the identified differentially expressed genes. This provided an in silico indication of the molecular pathways that may be affected in the T helper cells of women with PCOS.
RRBS analysis
RRBS reads were processed with the “rrbs” setting of Trim Galore v0.3.7 and Cutadapt v1.4.2. Processed reads were mapped to hg38 followed by derivation of CpG methylation using Bismark (43). Mappings to Y chromosome were removed for the differential methylation analysis. Differential methylation analysis was conducted on site and region level according to the sample groups (PCOS vs control) by using RnBeads pipeline (44). For each library, single-nucleotide polymorphism–enriched sites were removed and sites with <10 counts were masked. Gene ontology (GO) enrichment analysis was conducted to determine significant GO terms using a hypergeometric test and a rank cutoff applied for the top 100 best ranking regions in RnBeads pipeline.
Statistical analysis
Data were analyzed using IBM SPSS Statistics version 22. Baseline characteristics are presented as mean ± SD or median (interquartile range), when data were skewed. The baseline characteristics between PCOS and control groups were compared using Student t tests when data were normally distributed. Data were tested for normality using the Shapiro–Wilk test and when deemed nonnormal the Mann–Whitney test was used to compare the baseline characteristics. Student t tests were used to examine the difference in global DNA methylation between women with and without PCOS. Statistical significance was accepted at P < 0.05. To get insight into the relationship between clinical perturbations and DNA methylation in blood, we performed Spearman correlation analyses in women with or without PCOS for each population of PBMCs, assessing the association between body composition, physical activity, dietary intake, and hormones with global DNA methylation. After adjusting for multiple comparisons, statistical significance was accepted when false discovery rate q was ≤0.1. The data sets generated and/or analyzed during the current study are available in the National Center for Biotechnology Information’s Gene Expression Omnibus database through the Gene Expression Omnibus series accession number GSE130582 (45).
Results
Clinical and biochemical characteristics
All 17 women with PCOS had irregular cycles or amenorrhea; 14 had clinical or biochemical hyperandrogenism, and 15 had polycystic ovaries on ultrasound. Women without PCOS did not display any of the three clinical features detailed by the Rotterdam criteria (32, 46). Detailed clinical characteristics of the 34 women (n = 17 PCOS; n = 17 without PCOS) who participated in study are reported in Table 1. There were no differences in age, height, weight, BMI, markers of body composition, physical activity, energy, and macronutrient intake between women with or without PCOS (Table 1). There were also no differences in the lipid profile, circulating methyl donors (SAM or homocysteine), cytokines (IL or IL-6 and high-sensitivity C-reactive protein), or a difference in the fasting and the postprandial response to the OGTT and homeostatic model assessment for assessing insulin resistance (Table 2). There was a tendency for folate to be higher in women with PCOS (P = 0.08). Women with PCOS showed a higher area under the glucose curve (P = 0.02) during the OGTT compared with women without PCOS, but there was no difference observed for the area under the insulin curve between groups (Table 2). Women with PCOS had higher levels of fT (P < 0.01), free androgen index (P < 0.01), and AMH (P < 0.01) (Table 2).
Anthropometric Data and Lifestyle Characteristics
| Clinical Features | Sample Size (n) | Without PCOS [Mean ± SD or Median (IQR)] | With PCOS [Mean ± SD or Median (IQR)] | P Value |
|---|---|---|---|---|
| General characteristics | ||||
| Age, y | 34 | 30.1 ± 6.6 | 28.9 ± 4.8 | 0.6 |
| Height, cm | 34 | 165 ± 7.2 | 162 ± 4.7 | 0.3 |
| Weight, kg | 34 | 70.5 ± 16.8 | 71.5 ± 18.2 | 0.9 |
| BMI, kg/m2 | 34 | 25.5 ± 5.4 | 26.6 ± 6.9 | 0.6 |
| WHR | 32 | 0.85 (0.8, 1.0) | 0.80 (0.8, 0.9) | 0.2 |
| Body fat, % | 31 | 32.3 (25.9, 40.5) | 37.7 (31.8, 41.8) | 0.3 |
| Physical activity | ||||
| PA (IPAQ), min⋅wk | 31 | 172 (15.0, 427.5) | 165 (40.0, 255.0) | 0.6 |
| PA (accel), min⋅d | 30 | 47.0 (45.5, 48.5) | 47.0 (46.0, 50.5) | 0.6 |
| Food intake | ||||
| Energy, g | 31 | 8269 (7033, 11,402) | 7744 (5509, 8885) | 0.2 |
| Saturated fats, g | 31 | 28.0 (23.0, 50.0) | 21.5 (17.2, 30.3) | 0.07 |
| Carbohydrates, g | 31 | 198 (157, 278) | 171 (144, 220) | 0.2 |
| Sugar, g | 31 | 70.0 (56.5, 118) | 67.5 (51.0, 123) | 0.6 |
Abbreviations: Accel, Accelerometer; IPAQ, International Physical Activity Questionnaire; IQR, interquartile range; PA, physical activity; WHR, waist-to-hip ratio.
Metabolic and Reproductive Profile of Participating Women With and Without PCOS
| Clinical Features | Sample Size (n) | Without PCOS [Mean ± SD or Median (IQR)] | With PCOS [Mean ± SD or Median (IQR)] | P |
|---|---|---|---|---|
| Lipid profile | ||||
| Cholesterol, mmol/L | 30 | 4.2 ± 0.7 | 4.4 ± 0.7 | 0.5 |
| Triglycerides, mmol/L | 30 | 0.6 (0.6, 0.9) | 0.8 (0.5, 1.0) | 0.6 |
| HDL, mmol/L | 30 | 1.5 ± 0.3 | 1.5 ± 0.3 | 1.0 |
| LDL, mmol/L | 30 | 2.5 ± 0.6 | 2.4 ± 0.7 | 0.6 |
| OGTT | ||||
| Fasting glucose, mmol/L | 34 | 4.9 (4.8, 5.4) | 4.9 (4.6, 5.3) | 0.4 |
| Fasting insulin, pmol/L | 34 | 72.8 (56.2, 89.4) | 68.5 (47.2, 102.4) | 0.9 |
| 2-h Glucose, mmol/L | 34 | 4.75 (4.5, 5.4) | 5.5 (4.6, 5.8) | 0.2 |
| 2-h Insulin, pmol/L | 34 | 278 (207, 399) | 309 (165, 737) | 0.5 |
| AUC glucose, mmol/L | 33 | 665.8 ± 75.4 | 783.7 ± 167.8 | 0.02 |
| AUC insulin, mmol/L | 33 | 48,012 ± 18,367 | 66,180 ± 40,350 | 0.11 |
| HOMA | 34 | 2.65 (2.0, 3.2) | 2.41 (1.7, 4.4) | 0.9 |
| Reproductive markers | ||||
| fT, pM | 34 | 23.2 (17.7, 31.2) | 10.80 (10.3, 14.1) | <0.001 |
| SHBG, nmol/L | 34 | 62.1 ± 21.5 | 63.4 ± 38.4 | 0.9 |
| FAI | 34 | 1.42 (1.4, 2.2) | 3.17 (2.2, 5.3) | <0.001 |
| AMH, pmol/L | 33 | 18.9 (10.8, 31.1) | 48.6 (37.7, 74.6) | <0.001 |
| Systemic methyl substrate/donors | ||||
| SAM, µg/mL | 32 | 7.7 (5.4, 8.3) | 6.9 (6.0, 12.8) | 0.7 |
| Folate, nmol/L | 33 | 29.9 (23.2, 37.5) | 37.3 (23.4, 45.8) | 0.08 |
| Homocysteine | 33 | 9.0 (6.9, 10.1) | 7.1 (6.4, 9.7) | 0.3 |
| Cytokines | ||||
| HsCRP, mg/L | 30 | 1.3 (0.5, 3.3) | 1.4 (0.6, 4.5) | 0.7 |
| IL-6, pg/ml | 31 | 1.8 (1.3, 3.0) | 2.1 (1.5, 2.9) | 0.3 |
| Cell counts | ||||
| WBC, µL | 31 | 5335 ± 1229 | 5750 ± 1497 | 0.4 |
Abbreviations: AUC, area under the curve; HDL, high-density lipoprotein; HOMA, homeostatic model assessment; HsCRP, high-sensitivity C-reactive protein; FAI, Free Androgen Index; IQR, interquartile range; LDL, low-density lipoprotein; WBC, white blood cell.
Global DNA methylation
Global DNA methylation analysis of the individual immune cell populations was performed using an antibody that detects methylated cytosine bases coupled with FACS detection (28). We identified hypomethylation in monocytes (P = 0.006) and T helper (P = 0.004), T cytotoxic (P = 0.004), and B cells (P = 0.03) in women with PCOS compared with women without PCOS (Fig. 1). Furthermore, systemic AMH concentration was associated with global DNA hypo-methylation in T helper cells (rs = −0.428, q = 0.078), but not in T cytotoxic cells, B cells, or monocytes (Table 3). Subset analysis revealed that the AMH-associated hypomethylation in T helper cells was only observed in women with PCOS (P = 0.035). fT was also associated with DNA hypomethylation in T helper cells (rs = −0.381, q < 0.087), but not T cytotoxic cells, B cells, or monocytes (Table 3). Collectively, our results show a cell type–specific alteration of global DNA methylation in immune cells in PCOS and suggest a correlation with the dysregulated ovarian hormone and hyperandrogenism as indicated by associations with AMH and fT, respectively.
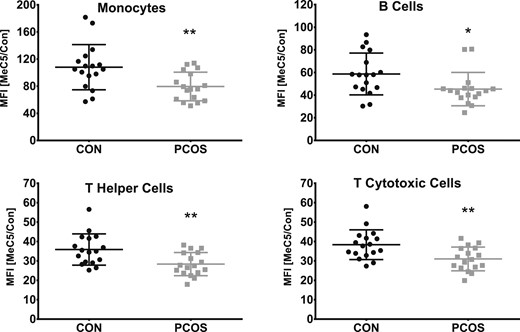
Lower 5-methylcytosine levels in monocytes and T helper, T cytotoxic, and B cells in women with PCOS. Comparison of 5-methylcytosine median fluorescence intensity (MFI) between women with PCOS (square) and women without PCOS (circle). MFI was normalized by the MFI from the isotope control (CON). *P < 0.05, **P < 0.01, vs control.
Spearman Correlations of a priori Covariates With Global DNA Methylation in T Helper Cells, T Cytotoxic Cells, Monocytes, and B Cells Across All Participants
| Covariate | Spearman Correlation | ||||
|---|---|---|---|---|---|
| T Helper Cells | T Cytotoxic Cells | Monocytes | B Cells | ||
| BMI, kg/m2 | rs | 0.007 | 0.021 | 0.140 | 0.143 |
| P value | 0.967 | 0.905 | 0.430 | 0.420 | |
| FDR q value | 0.967 | 0.900 | 0.516 | 0.504 | |
| PA (MVPA), min⋅d | rs | −0.139 | −0.166 | −0.165 | −0.213 |
| P value | 0.463 | 0.380 | 0.383 | 0.259 | |
| FDR q value | 0.694 | 0.735 | 0.5164 | 0.504 | |
| Energy, g | rs | 0.070 | −0.068 | −0.069 | −0.095 |
| P value | 0.708 | 0.716 | 0.712 | 0.612 | |
| FDR q value | 0.846 | 0.852 | 0.8546 | 0.612 | |
| AMH, pmol/L | rs | −0.428 | −0.317 | −0.286 | −0.191 |
| P value | 0.013 | 0.072 | 0.106 | 0.288 | |
| FDR q value | 0.078 | 0.432 | 0.351 | 0.504 | |
| fT, pM | rs | −0.381 | −0.237 | −0.278 | −0.175 |
| P value | 0.029 | 0.183 | 0.117 | 0.330 | |
| FDR q value | 0.087 | 0.549 | 0.351 | 0.504 | |
| AUC glucose, mmol/L | rs | −0.160 | −0.124 | −0.152 | −0.154 |
| P value | 0.373 | 0.493 | 0.399 | 0.393 | |
| FDR q value | 0.694 | 0.735 | 0.516 | 0.504 | |
Significance was considered with a false discovery rate q of <0.1. Bold text indicates statistical significance.
Abbreviations: AUC, area under the curve; FDR, false discovery rate; MVPA, moderate vigorous physical activity; PA; physical activity; rs, Spearman Rho.
DNA methylome of T helper cells
To further explore the changes in the methylome of immune cells from women with PCOS, we investigated genome-wide methylation levels in sorted T helper cells. We identified 5581 CpG sites differentially methylated in women with PCOS in T helper cells. Of these sites, only 13 were located within promoter regions or gene bodies (8 promoters and 5 gene bodies, Table 4). Gene enrichment analysis of the genes harboring differentially methylated cytosines identified GO terms related to T cell function, as well as reproductive function, including female pregnancy, response to prolactin, regulation of ovarian follicle development, progesterone receptor signaling pathway, male sex determination, and response to steroid hormone (37). Thus, our results indicate that genes regulating reproductive function are epigenetically remodeled at in specific immune cells.
Genes and Promoters Carrying Differentially Methylated CpGs in T Helper Cells From Women With PCOS Compared With Women Without PCOS
| Gene Symbol | Gene Name | ENSEMBL Gene ID | Chromosome | Function and Gene Type |
|---|---|---|---|---|
| Genes | ||||
| COX6CP15 | Cytochrome c oxidase subunit 6C pseudogene 15 | ENSG00000228092 | chr10 | Pseudogene |
| SCGB1D4 | Secretoglobin family 1D member 4 | ENSG00000197745 | chr11 | Regulation of chemotactic cell migration and invasion |
| AC025678.3 | N/A | ENSG00000279092 | chr15 | To be experimentally confirmed protein tyrosine kinase involved in T cell signaling and activation |
| APP006565.1 | N/A | ENSG00000279092 | chr18 | Antisense RNA |
| AC104301.2 | N/A | N/A | chr20 | Noncoding RNA |
| Promoter of genes | ||||
| WBP11P1 | WW domain binding protein 11 pseudogene 1 | ENSG00000260389 | chr2 | Pseudogene |
| SCGB3A2 | Secretoglobin family 3A member 2 | ENSG00000164265 | chr5 | Receptor-mediated endocytosis |
| COX6CP15 | Cytochrome c oxidase subunit 6C pseudogene 15 | ENSG00000228092 | chr10 | Pseudogene |
| SCGB1D4 | Secretoglobin family 1D member 4 | ENSG00000197745 | chr11 | Regulation of chemotactic cell migration and invasion |
| OVCH1 | Ovochymase 1 | ENSG00000187950 | chr12 | Serine-type endopeptidase activity, hydrolase activity, metal ion binding, proteolysis |
| AP006565.1 | N/A | ENSG00000265737 | chr18 | Antisense RNA |
| AC104301.2 | N/A | N/A | chr20 | Noncoding RNA |
| IGLJ2 | Immunoglobulin lambda joining 2 | ENSG00000211676 | chr22 | Immunoglobin |
Abbreviation: N/A, not applicable.
Transcriptomic analysis of T helper cells
To determine whether the specific DNA methylation signature we identified in T helper cells is linked to transcriptional changes, we investigated gene expression via RNA sequencing. We found 37 genes differentially expressed between women with PCOS (Fig. 2) compared with those without PCOS, with 33 downregulated and 4 upregulated (Table 5). Surprisingly, none of the differentially expressed genes showed changes in DNA methylation as identified by RRBS analysis. Interestingly a large portion of the differentially expressed transcripts (n = 17) were long noncoding RNAs (lncRNA), including pseudogenes, long intergenic noncoding RNA, and Y RNA. The remaining 20 transcripts were protein coding and related to inflammatory and immune cell function. KEGG analysis revealed that the cyclic guanosine monophosphate (cGMP) signaling pathway and bone morphogenetic pathway (BMP) signaling pathway were functionally enriched. BMP signaling was upregulated, whereas cGMP signaling was downregulated, in women with PCOS. Taken together, our results indicate that epigenetic remodeling of genes related to reproductive function in T helper cells does not seem to be functional at the transcriptomic level in women with PCOS.
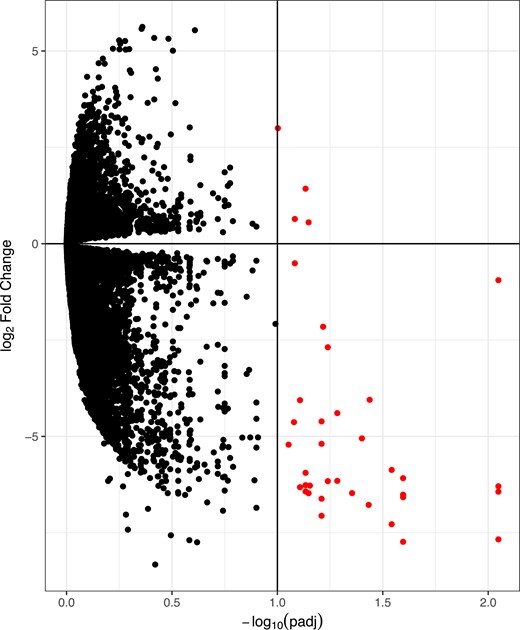
Volcano plots representing differentially expressed genes in T helper cells of women with PCOS compared with women without PCOS. Red circles highlight differentially expressed genes. False discovery rate q of <0.1. padj, adjusted P value.
Differentially Expressed Genes in T Helper Cells From Women With PCOS Compared With Women Without PCOS
| Gene Name | Gene Symbol | ENSEMBL Gene ID | Log2 Fold Change | Padj | Gene Type | Molecular Function | Molecular Process |
|---|---|---|---|---|---|---|---|
| Downregulated genes in women with PCOS | |||||||
| N/A | AC138969.2 | ENSG00000277920 | −7.7 | 0.025 | Pseudogene | Unknown | Unknown |
| Ring finger protein 217 | RNF217 | ENSG00000146373 | −7.7 | 0.009 | Protein coding | Metal ion binding, ubiquitin-protein transferase activity | Unknown |
| FKBP prolyl isomerase 1B | FKBP1B | ENSG00000119782 | −7.3 | 0.029 | Protein coding | Peptidyl-prolyl cis-trans isomerase activity | Unknown |
| Guanylate cyclase 1 soluble subunit alpha 2 | GUCY1A2 | ENSG00000152402 | −7.1 | 0.062 | Protein coding | GTP binding, phosphorus-oxygen lyase activity guanylate cyclase activity, heme binding | Intracellular signal transduction, cyclic nucleotide biosynthetic process, positive regulation of cGMP biosynthetic process, adenylate cyclase activity |
| Caveolae associated protein 2 | CAVIN2 | ENSG00000168497 | −6.8 | 0.037 | Protein coding | Phosphatidylserine binding, phospholipid binding, protein kinase C binding | Plasma membrane tubulation |
| Alcohol dehydrogenase 4 (class II), pi polypeptide | ADH4 | ENSG00000198099 | −6.6 | 0.062 | Protein coding | Alcohol dehydrogenase (NAD) activity, all-trans retinal binding, ethanol binding, NAD binding | Alcohol catabolic process, cellular aldehyde metabolic process, ethanol oxidation |
| Solute carrier family 5 member 11 | SLC5A11 | ENSG00000158865 | −6.6 | 0.025 | Protein coding | Transporter activity | Transmembrane transport |
| VWA8 antisense RNA 1 (head to head) | VWA8-AS1 | ENSG00000278338 | −6.5 | 0.025 | lncRNA | Unknown | Unknown |
| N/A | Z98752.2 | ENSG00000234271 | −6.5 | 0.071 | Processed pseudogene | Unknown | Unknown |
| N/A | AC034102.3 | ENSG00000257449 | −6.5 | 0.044 | lncRNA | Unknown | Unknown |
| N/A | AC253536.6 | ENSG00000272787.1 | −6.4 | 0.009 | lincRNA | Unknown | Unknown |
| Atypical chemokine receptor 2 | ACKR2 | ENSG00000144648 | −6.4 | 0.074 | Protein coding | C-C chemokine receptor activity, scavenger receptor activity, G-protein–coupled receptor activity | Chemotaxis, inflammatory response, receptor-mediated endocytosis |
| Keratin 74 | KRT74 | ENSG00000170484 | −6.3 | 0.078 | Protein coding | Keratin filament binding, structural molecule activity | Intermediate filament cytoskeleton organization, cornification, keratinization |
| N/A | RF00019 | ENSG00000252652.1 | −6.3 | 0.009 | Y RNA | Unknown | Unknown |
| Protocadherin gamma subfamily B, 8 pseudogene | PCDHGB8P | ENSG00000248449 | −6.3 | 0.070 | Transcribed pseudogene | Unknown | Unknown |
| N/A | LOC101928238 | ENSG00000278611 | −6.3 | 0.074 | lincRNA | Unknown | Unknown |
| Transmembrane and coiled-coil domains 2 | TMCO2 | ENSG00000188800 | −6.2 | 0.058 | Protein coding | Unknown | Unknown |
| CELF2 antisense RNA 2 | CELF2-AS2 | ENSG00000237986 | −6.2 | 0.052 | lncRNA | Unknown | Unknown |
| N/A | AC013476.1 | ENSG00000234193.1 | −6.1 | 0.025 | lncRNA | Unknown | Unknown |
| Pannexin 3 | PANX3 | ENSG00000154143 | −5.9 | 0.074 | Protein coding | Wide pore channel activity, gap junction hemichannel activity | Cell–cell signaling, transmembrane transport, cation transport |
| N/A | RF00019 | ENSG00000202222.1 | −5.9 | 0.029 | Y RNA | Unknown | Unknown |
| N/A | LOC101927851 | ENSG00000238005 | −5.2 | 0.088 | lincRNA | Unknown | Unknown |
| Leucine-rich repeat containing 9 | LRRC9 | ENSG00000131951 | −5.2 | 0.062 | Protein coding | Unknown | Unknown |
| EXTL3 antisense RNA 1 | EXTL3-AS1 | ENSG00000246339 | −5.1 | 0.040 | incRNA | Unknown | Unknown |
| KIAA2012 | KIAA2012 | ENSG00000182329 | −4.6 | 0.083 | Protein coding | Unknown | Unknown |
| N/A | AC013643.2 | ENSG00000253875 | −4.6 | 0.062 | lncRNA | Unknown | Unknown |
| Cytochrome b reductase 1 | CYBRD1 | ENSG00000071967 | −4.4 | 0.052 | Protein coding | Ferric-chelate reductase activity, protein binding, oxidoreductase activity, oxidizing metal ions | Cellular iron ion homeostasis, response to iron ion, oxidation-reduction process |
| N/A | AC068620.2 | ENSG00000270147 | −4.1 | 0.078 | lincRNA | Unknown | Unknown |
| N/A | AC243428.1 | ENSG00000229979 | −4.1 | 0.037 | Processed pseudogene | Unknown | Unknown |
| Stearoyl-CoA desaturase | SCD | ENSG00000099194 | −2.7 | 0.058 | Protein coding | Stearoyl-CoA 9-desaturase activity, iron ion binding, oxidoreductase activity | Lipid metabolic process, fatty acid biosynthetic process, regulation of cholesterol biosynthetic process, oxidation-reduction process |
| NIMA related kinase 10 | NEK10 | ENSG00000163491 | −2.2 | 0.061 | Protein coding | Nucleotide binding, protein serine/threonine kinase activity, ATP binding, transferase activity | Protein phosphorylation, positive regulation of protein autophosphorylation, positive regulation of MAPK activity, regulation of ERK1 and ERK2 cascade, regulation of cell cycle G2/M phase transition |
| Thymocyte selection associated family member 2 | THEMIS2 | ENSG00000130775 | −0.9 | 0.009 | Protein coding | Protein binding | Immune system process, inflammatory response, cell adhesion, T cell receptor signaling pathway |
| cAMP-dependent protein kinase inhibitor alpha | PKIA | ENSG00000171033 | −0.5 | 0.083 | Protein coding | Protein kinase inhibitor activity, cAMP-dependent protein kinase inhibitor activity, | Negative regulation of transcription by RNA polymerase II, negative regulation of protein kinase activity, regulation of G2/M transition of mitotic cell cycle, negative regulation of protein import into nucleus, negative regulation of catalytic activity |
| Upregulated genes in women with PCOS | |||||||
| MX dynamin like GTPase 2 | MX2 | ENSG00000183486 | 0.6 | 0.0711 | Protein coding | Nucleotide binding, GTPase activity, protein binding, microtubule binding | Mitochondrial fission, immune system process, defense response, response to virus, response to interferon-α, innate immune response, mRNA transport |
| Small Cajal body–specific RNA 21 | SCARNA21 | ENSG00000252835 | 0.6 | 0.082652 | scaRNA | Unknown | Unknown |
| Histone cluster 1 H3 family member c | HIST1H3C | ENSG00000278272 | 1.4 | 0.073504 | Protein coding | DNA binding, protein binding, cadherin binding, protein heterodimerization activity | Chromatin silencing at rDNA, nucleosome assembly, telomere organization, IL-7–mediated signaling pathway, negative regulation of gene expression, epigenetic, regulation of hematopoietic stem cell differentiation, regulation of gene silencing |
| SMAD family member 1 | SMAD1 | ENSG00000170365 | 3.0 | 0.099453 | Protein coding | RNA polymerase II proximal promoter sequence-specific DNA binding, signal transducer activity, downstream of receptor, TGF-β receptor, pathway-specific cytoplasmic mediator activity, protein homodimerization activity, co-SMAD binding, I-SMAD binding, primary miRNA binding | MAPK cascade, mesodermal cell fate commitment, osteoblast fate commitment, inflammatory response, TGF-β receptor signaling pathway, SMAD protein complex assembly, gamete generation, embryonic pattern specification, BMP signaling pathway |
Molecular functions and biological processes were established from the Universal Protein Resource (UniProt). False discovery rate q <0.1.
Abbreviations: CoA, conenzyme A; lincRNA, long intergenic noncoding RNA; N/A, not applicable; Padj, adjusted P value; scaRNA, small Cajal body–specific RNA.
Discussion
In this study, we report that immune cells from women with PCOS have a distinct epigenetic profile at both the global and gene-specific levels. On the global level, we found hypomethylation in all PBMC subtypes. In the specific T-lymphocyte population, the differentially methylated genes that we identified were enriched for GO terms related to T cell function, but also reproductive function, suggesting a role of epigenetic reprogramming in the reproductive defects associated with PCOS.
Global DNA methylation
At the cell type–specific level, PBMCs from women with PCOS display distinct global DNA methylation levels compared with women without PCOS. Only one previous study reported that global DNA methylation levels were not different in the total PBMC fraction from women with PCOS (27). Although we have not measured the global methylation of the total PBMC fraction in the current study, differences at the cell type–specific level may not be detected when investigating global DNA methylation at the whole PBMC level. This would be consistent with a previous study showing no difference in global DNA methylation in total blood fractions from subjects with type 2 diabetes whereas global DNA methylation was altered in specific immune cell populations (28), further consolidating the importance of measuring global DNA methylation in immune cells in a cell type–specific manner.
Methylation of DNA is under the control of the one-carbon metabolism, notably the methyl donor SAM, which is a cofactor necessary for the transfer of a methyl group to a cytosine base in DNA (47). To gain insight into the potential relationship between altered global DNA methylation levels in immune cells in PCOS and folate metabolism, we measured key one-carbon metabolites, that is, SAM, homocysteine, and folate, but found no differences. The lack of association between circulating one-carbon metabolites and global DNA methylation levels in immune cells from women with PCOS suggests that methyl donors may not be the primary driver of the global DNA hypomethylation observed in PCOS. Alternatively, it would be interesting to investigate whether the enzymes DNA methyltransferases or ten-eleven translocation, which are responsible for the transfer of the methyl group to the cytosine base or removal of the methyl group, respectively, may play a role in the hypomethylation observed in the immune cell populations (48).
Lifestyle factors such as physical activity and diet have been previously associated with both global and gene-specific DNA methylation changes (49–51). Obesity, as measured by BMI, is also associated with distinct DNA methylation patterns (25, 28, 52, 53). In the current study, we did not find any associations between global methylation and BMI, habitual physical activity, or diet (total energy) in any of the cell subsets. These data do not support a role of adiposity, physical activity, or caloric intake on the altered global DNA methylation in PBMCs from women with PCOS. Interestingly, we found a negative association between global methylation in T helper cells and circulating levels of AMH. This relationship is only present in women with PCOS who have elevated circulating levels of AMH, suggesting a mechanistic association of this hormone in PCOS and DNA methylation changes in T helper cells. AMH is a member of the TGF-β ligand superfamily that is predominantly present in ovaries in healthy women but released into the circulation at elevated levels in PCOS (2, 54–59), although there is little literature available indicating whether it is a cause or consequence. AMH has been found to cluster with many clinical markers of PCOS, including positive correlations with LH and androgens and negative correlations with FSH and glucose levels (58, 59). Furthermore, in women with PCOS, it has been shown that AMH disrupts folliculogenesis by decreasing sensitivity to FSH and thereby inhibiting follicle recruitment and growth, which can result in increased numbers of preantral and antral follicles and the PCO morphology (60, 61). It has also been suggested that circulating AMH may have a functional role outside of the reproductive system (62). Interestingly, in immune cells, members of the TGF-β ligand superfamily are potent regulators of T cell activation and differentiation and control a variety of regulatory epigenetic signals such as chromatin remodeling, histone modification, and DNA methylation (63–65). Based on our observations and considering the literature, we hypothesize that AMH participates in the epigenetic reprogramming of some subpopulations of PBMCs in women with PCOS, warranting further research.
In this study, we identified a negative correlation between global methylation in T helper cells and fT. In women with PCOS, fT is elevated and is used to diagnose hyperandrogenism in the syndrome (31). Elevated androgens in animal models are associated with reproductive dysfunction (oligo-anovulation, menstrual disturbances, and subfertility) that is observed in PCOS (60, 66–69). Androgens have immunomodulatory effects, and elevated androgens are associated with altered immune function that likely impacts reproductive function (70, 71). Medawar (72) identified the importance of the immune system in reproduction with further studies identifying the importance in the frequencies of T helper (Th)1, Th2, Th17, and regulatory T (Treg) cells in maintenance of normal ovarian function and menstrual cycles (72–75). Interestingly, Th1/Th2/Th17 imbalances have been identified in women with PCOS (75–77). The differentiation of T cells and the ratios of Th1/Th2/Th17/Treg cells appear to be modulated by androgens (71, 78–80). Furthermore, the differentiation of T cells are also modulated by epigenetic mechanisms (15, 81, 82), and this may be the case in PCOS (71). Collectively, our data complements previous studies indicating that the elevated fT was associated with differences in the methylome profile in T helper cells in women with PCOS. Whether hyperandrogenism modulates the epigenome of T helper cells and result in changes to frequency of Th1/Th2/Th17/Treg cells and the reproductive dysfunction in PCOS would be an interesting avenue to explore.
DNA methylome and transcriptomic analysis of T helper cells
We also investigated genome-wide DNA methylation in T helper cells at the single nucleotide resolution and identified differentially methylated cytosine bases at the proximity of genes controlling reproductive function. Specifically, our gene ontology analysis returned terms such as female pregnancy, regulation of ovarian follicle development, and male sex determination.
As the altered DNA methylation was present at genes controlling reproductive function in immune cells, this suggests that epigenetic changes may not be tissue specific. Instead, these methylation patterns may occur in multiple tissue types that are exposed to specific extracellular stimuli (possibly elevated AMH levels or elevated androgens), with such exposure potentially occurring in utero or as a result of the development of PCOS during the lifespan (83–85). With epigenetic reprogramming of genes being related to reproductive function, it would be worthwhile investigating other tissues, such as the ovary or neuroendocrine tissues, where the appropriate transcriptional activators and coactivators are expressed (86, 87). This would provide insights into the role of epigenetic reprogramming at genes controlling reproductive function on ovarian function and sex hormone imbalances in women with PCOS.
We found no overlap between the transcriptomic and DNA methylation data. This suggests that the shift in epigenetic signature could be related to differences in the proportions of T helper subpopulations (Th1, Th2, Th9, Th17, follicular T helper, regulatory, naive, effector, and memory T cells) (88–90). Previous literature has shown in women with PCOS an increased frequency of the proinflammatory Th1 population and a reduced frequency of the anti-inflammatory Th2 population (75, 77, 78). Although we were unable to confirm the frequency of T helper subpopulations, the gene ontology pathway analysis identified differential methylation in the activation and proliferation of different T helper subpopulations, suggesting that women with PCOS may indeed have different proportions of the T helper subtypes (37).
To further consolidate this hypothesis, the transcriptomic analysis of the differentially expressed genes in T helper cells identified pathways that relate to T cell activation and differentiation. Of interest, KEGG analysis revealed that the BMP signaling pathway was upregulated in women with PCOS, and BMP, similar to AMH, is a member of the TGF-β ligand superfamily (91). The elevated circulating AMH found in our women with PCOS may explain the upregulation of BMP signaling in T helper cells via activation of the BMP receptors. AMH intracellular signaling works via the BMP receptor through the Smad1/5/8 pathway, which assembles into a complex with Smad4 and translocates into the nucleus, activating a range of genes dependent on the cellular context (92–94). In T cells, BMP signaling generally regulates activation and differentiation of circulating naive immune cells, as well as proliferation of Th9, Th17, and memory T cells (94, 95). Despite the lack of quantification of T helper cell frequency in women with and without PCOS, our data provide a potential mechanism by which the upregulated BMP signaling pathway could impact the Th1/Th2 balance, but further studies are warranted (92, 96).
Several differentially expressed genes were associated with inflammation/inflammatory status (Table 5) in women with PCOS compared with those without. This supports the role of inflammation/inflammatory status consistent with previous studies (97), where ovulation requires an appropriate inflammatory reaction (18). Additionally, circulating immune cells and the cytokines they produce are also involved in ovarian function (16, 98, 99), suggesting that the epigenetic marks in our study can alter the transcriptome toward a proinflammatory T helper phenotype and suppress ovarian function.
Many of the differentially expressed genes identified from our transcriptomic analysis were noncoding, with most being lncRNAs, including pseudogenes, antisense RNA, and long intergenic noncoding RNAs. lncRNAs are widely expressed and regulate gene expression, particularly during development, differentiation, and activation of immune cells (100), and have been implicated in the comorbidities associated with PCOS, including T2DM (101, 102) and inflammatory disorders (103). There is also evidence to suggest that lncRNAs can act as a molecular scaffold for epigenetic modifications, including DNA methylation and histone modifications (104, 105). Indeed, the lack of overlap in our analysis between DNA methylation and gene expression suggests that other mechanisms, such as lncRNA, modulate the transcriptome in PCOS.
The strength of this study is that this cohort was a well-characterized, community-recruited group of women with and without PCOS, who were otherwise healthy. We were adequately powered to answer our a priori aims, with post hoc analysis revealing that we were powered on average 93% for all immune cell populations and had large effect sizes of ∼0.90 (106). We acknowledge that there is a need for more definitive research into the molecular mechanisms behind each of the different the phenotypes of PCOS. Although in the current study we were unable to confidently address the potential epigenetic differences between phenotypes in PCOS, we were able to explore the heterogeneous immune cell population and the unique role that these may play in PCOS. These findings provide novel avenues for future research in PCOS, including studying the role of methylation in specific immune cells in determining the different phenotypes in PCOS.
In conclusion, our study in a small, yet well-characterized cohort of women with and without PCOS demonstrates novel epigenomic insights into PCOS. The specific epigenetic reprogramming of genes involved in reproductive function in immune cells from women with PCOS is intriguing and may indicate a role for epigenetic factors in the reproductive dysfunction and sex hormone imbalance associated with PCOS. Finally, we found that global DNA methylation in T helper cells is negatively associated with circulating levels of AMH and fT, suggesting the importance of the cellular milieu (elevated circulating androgens and AMH) in the programming of T helper cells in PCOS and warranting further investigation.
Acknowledgments
We acknowledge Dr. Anju Joham and Dr. Soulmaz Shorakae for confirming diagnosis of women with PCOS, Prof. Helena Teede for critical review of the study design and expertise, and Dr. Sarah Voisin for assistance with statistical analysis.
Financial Support: This work was supported by the Novo Nordisk Foundation Center for Basic Metabolic Research, an independent research center at the University of Copenhagen partially funded by an unrestricted donation from the Novo Nordisk Foundation and by the National Health and Medical Research Council Centre for Research Excellence in PCOS. These funding bodies did not have a role in study design and have no role in the implementation of the study.
Additional Information
Disclosure Summary: The authors have nothing to disclose.
Data Availability: All data generated or analyzed during this study are included in this published article or in the data repositories listed in References.
Abbreviations:
- AMH
anti-Müllerian hormone
- BMI
body mass index
- BMP
bone morphogenic protein
- cGMP
cyclic guanosine monophosphate
- fT
free testosterone
- GO
gene ontology
- KEGG
Kyoto Encyclopedia of Genes and Genomes
- lncRNA
long noncoding RNA
- OGTT
oral glucose tolerance test
- PBMC
peripheral blood mononuclear cell
- PCOS
polycystic ovary syndrome
- RRBS
reduced representation bisulfite sequencing
- SAM
S-adenosylmethionine
- T2DM
type 2 diabetes mellitus
- Treg
T regulatory
References and Notes
Author notes
R.B. and N.K.S. are joint senior authors.
