


Abstract
Diagnosis and pathological classification of insulinomas are challenging.
To characterize localization of tumors, surgery outcomes, and histopathology in patients with insulinoma.
Patients with surgically resected sporadic insulinoma were included.
Eighty patients were included. Seven had a malignant tumor. A total of 312 diagnostic examinations were performed: endoscopic ultrasonography (EUS; n = 59; sensitivity, 70%), MRI (n = 33; sensitivity, 58%), CT (n = 55; sensitivity, 47%), transabdominal ultrasonography (US; n = 45; sensitivity, 40%), somatostatin receptor imaging (n = 17; sensitivity, 29%), 18F-fluorodeoxyglucose positron emission tomography/CT (n = 1; negative), percutaneous transhepatic venous sampling (n = 10; sensitivity, 90%), arterial stimulation venous sampling (n = 20; sensitivity, 65%), and intraoperative US (n = 72; sensitivity, 89%). Fourteen tumors could not be visualized. Invasive methods were used in 7 of these 14 patients and localized the tumor in all cases. Median tumor size was 15 mm (range, 7 to 80 mm). Tumors with malignant vs benign behavior showed less staining for insulin (3 of 7 vs 66 of 73; P = 0.015) and for proinsulin (3 of 6 vs 58 of 59; P < 0.001). Staining for glucagon was seen in 2 of 6 malignant tumors and in no benign tumors (P < 0.001). Forty-three insulinomas stained negative for somatostatin receptor subtype 2a.
Localization of insulinomas requires many different diagnostic procedures. Most tumors can be localized by conventional imaging, including EUS. For nonvisible tumors, invasive methods may be a useful diagnostic tool. Malignant tumors showed reduced staining for insulin and proinsulin and increased staining for glucagon.
Insulinoma is a rare, life-threatening disease caused by an insulin-secreting pancreatic neuroendocrine neoplasm (pNEN). The annual incidence is ∼1 to 3 per million (1). The disease is challenging with regard to clinical presentation, diagnostic workup, choice of surgical procedure, and pathological classification (2). The initial symptoms of hypoglycemia are nonspecific, with a broad spectrum of potential differential diagnoses; this often leads to a substantial delay from initial symptoms to established final diagnosis. A major challenge is localization of the tumor. Insulinomas are often <1 cm in diameter and are often not visible on commonly applied diagnostic imaging, such as ultrasonography (US), CT, MRI, and somatostatin receptor imaging (SRI) (3). Therefore, different invasive methods have been developed to localize the source of hyperinsulinemia. These methods include percutaneous transhepatic venous sampling (PTVS), and arterial stimulation venous sampling (ASVS). The utility and sensitivity of invasive methods are debated (4–6).
In contrast to other pNENs, which are often malignant, 90% of insulinomas are considered benign. However, there are no well-established histopathological criteria for distinguishing malignant vs benign tumors (1, 2). Because of the often benign nature, enucleation that preserves pancreatic tissue is frequently preferred to formal pancreatic resection (2).
The aim of the current study is to characterize a large cohort of patients with surgically resected benign and malignant insulinomas. We report data on pre- and perioperative localization of the insulinomas, operative procedures, and results of histopathological examinations.
Materials and Methods
Participants
The cohort was retrospectively recruited from two ENETS centers of Excellence: Philipps University, Marburg, Germany, and Rigshospitalet, Copenhagen University Hospital, Copenhagen, Denmark.
Consecutive patients with assumed sporadic insulinomas who fulfilled the diagnostic clinical and biochemical criteria for insulinoma between 1989 and 2014 were included in the study. Patients who had not undergone pancreatic surgery or had genetically verified multiple endocrine neoplasia type 1 (MEN1) before surgery were excluded. Nine patients with MEN1 associated insulinoma were operated from 1989-2014, results have previously been published (7).
Definitions
The insulinoma diagnosis was based on the Whipple triad: symptoms of hypoglycemia, plasma glucose < 2.2 mmol/L, and symptom relief after glucose intake; other diagnostic criteria were inappropriately high levels of proinsulin, insulin, and C-peptide during hypoglycemia (1). Tumors were classified as being malignant if local and/or distant metastases were present at diagnosis or metastasis occurred during follow-up.
Data sources/ethics
For the Danish cohort, data were retrospectively extracted from patients’ records, the neuroendocrine tumor database at Rigshospitalet and the Danish National Pathology database. The database at Rigshospitalet is approved by the Danish Data Protection Agency (j.nr. 2007-58-0015). For the German cohort, data were retrospectively collected from the pNET database of the Department of Surgery, Philipps University Marburg. Collection and analysis of the data and tissue were approved by the ethics committee of the Philipps University Marburg (no.104/99). The need for informed consent was waived by the Danish Ethics Committee. The study was conducted in accordance with the Helsinki Declaration.
Histopathology
For 65 of the total of 80 patients, tumor specimens were available for central reading and additional immunohistochemical staining. Central reading was done by Dr. Birgitte Federspiel (Department of Pathology, Rigshospitalet, Copenhagen, Denmark). Specimens were evaluated without knowledge of the clinical presentation (e.g., malignant behavior of the tumor). For the remaining 15 patients, the original immunohistochemistry report was used.
Tumor tissue was stained for insulin (monoclonal mouse antihuman antibody; Leica Biosystems), proinsulin (mouse antibody, C-PEP-01, ab7761; Abcam), chromogranin A (CgA) (polyclonal rabbit anti-human; Dako A 0430), synaptophysin (monoclonal mouse antihuman; Dako DM828), somatostatin receptor subtype 2a (SSTR-2a) (monoclonal rabbit antibody, clone UMB-1, ab134152; Abcam), amyloid (monoclonal mouse anti-human; Dako M0759), glucagon (polyclonal rabbit antibody; Cell Marque), pancreatic polypeptide (polyclonal rabbit antibody; Invitrogen 18-0043), CD117 (polyclonal rabbit anti-human; Dako A4502), somatostatin (polyclonal rabbit anti-human; Dako A 056601), and Ki-67 (monoclonal mouse anti-human Ki-67 antigen clone MIB-1; Dako). The mean percentage of Ki-67–labeled nuclei in 20 hot spot areas was calculated. Immunohistochemistry results were defined as follows: negative, <5% of cells stained positive; intermediate, 5% to 50% of cells stained positive; positive, >50% of cells stained positive. In accordance with the World Health Organization–American Joint Committee on Cancer 2010 classification, tumors were classified as having one of the following grades: G1 (Ki-67 ≤ 2%), G2 (Ki-67, 3% to 20%), and G3 (Ki-67 > 20%) (8).
Statistics
All statistical analyses were performed by using SPSS software, version 22 (IBM Inc.). Two-sided P values < 0.05 were considered to indicate statistically significant differences. Results are presented as the mean ± SD for normally distributed variables and as median and interquartile range (IQR) for non–normally distributed variables. Descriptive statistics were used to summarize patient characteristics. Continuous variables were compared by using t tests, whereas categorical data were compared by using a χ2 table.
Results
A total of 80 patients with potentially sporadic insulinoma were included in the study (56 from Marburg, Germany, and 24 from Copenhagen, Denmark). Of these patients, 52 (65%) were female. The median age was 52 ± 16 (range, 13 to 87) years. A 72-hour fasting test was performed in 74 patients (93%).
Genetic evaluation for germline mutations was done in 67 (83%) patients. In 1 patient the insulinoma turned out to be part of genetically verified MEN1 syndrome (although this diagnosis was not suggested by his personal and family history), and 1 patient had a mutation in the tuberous sclerosis complex.
The median postoperative observation time of the entire cohort was 69 (IQR, 28 to 138) months. All Danish patients were followed from the time of diagnosis to end of registration in 2014 (median, 86 months; IQR, 40 to 180 months). In the German cohort, 19 patients were lost to follow up before the end of registration. The German cohort was followed for 69 (IQR, 21 to 114) months. Eleven patients died during follow-up: 2 of malignant insulinoma and 9 of other causes. Median age at time of death was 78 (IQR, 47 to 93) years. Median time from pancreatic surgery to death was 109 (IQR, 3 to 170) months. One patient died 7 days after secondary surgery for resection of liver metastases.
Localization of tumors
To identify the primary tumor, the following diagnostic modalities had been applied to the patient cohort: EUS, CT, MRI, US, SRI (111In-octreotide scintigraphy or 68Ga-DOTATOC), positron emission tomography (PET)/CT (68Ga-DOTATOC PET/CT), 18F-fluorodeoxyglucose PET/CT, PTVS, ASVS, and intraoperative US.
The presurgical diagnostic strategy was based on regular clinical practice without any predefined algorithm for how the above-mentioned localization modalities should be sequenced. However, the invasive procedures (PTVS and ASVS) were in general performed after conventional imaging. In the study institutions, PTVS was an established procedure to localize insulinomas and gastrinomas. ASVS was introduced later.
A total of 240 presurgery examinations were performed in the 80-patient patient cohort. The most frequently used method was EUS (n = 59), followed by CT (n = 55), transabdominal US (n = 45), and MRI (n = 33).
The sensitivity of the different methods is provided in Table 1. The most sensitive method was PTVS, which detected 9 of 10 tumors (90%), followed by EUS (70%). The most sensitive noninvasive methods were MRI (58%) and CT (47%). Tumors visible on CT and 111In-octreotide scintigraphy were larger than tumors not visualized by these two methods: 20 vs 13 mm (P = 0.03) and 31 vs 13 mm (P = 0.002). The smallest tumor detected by CT was 8 mm. With regard to the other modalities, size did not statistically significantly differ between detectable and nondetectable tumors. EUS (n = 59) visualized 75% (18 of 24) of tumors in the head, 47% (7 of 15) in the body, and 71% in the tail of pancreas (10 of 14) (P = 0.07). EUS depicted 35 of 46 insulinomas in the German cohort but only detected 6 of 13 insulinomas in the Danish cohort (P = 0.04). At Philipps University Marburg (German cohort) since 2006 EUS has been performed by one physician (Professor Peter H. Kann). The results from 2006 to 2014 were significantly better than results from 1989 to 2005 (positive in 16 of 16 vs 19 of 30 patients, respectively; P = 0.005).
Sensitivity of Localization Procedures
| Variable | Total Scans (Positive Scans) (n) | Sensitivity, % |
|---|---|---|
| EUS | 59 (41) | 70 |
| CT | 55 (26) | 47 |
| US | 45 (18) | 40 |
| MRI | 33 (19) | 58 |
| SRS | 15 (4) | 27 |
| 68Gallium-PET/CT | 2 (1) | 50 |
| 18FDG-PET/CT | 1 (0) | 0 |
| PTVS | 10 (9) | 90 |
| ASVS | 20 (13) | 65 |
| Intraoperative US | 72 (64) | 89 |
Sensitivity of imaging and invasive procedures in 80 patients with insulinoma.
Abbreviations: FDG, fluorodeoxyglucose; SRS, somatostatin receptor scintigraphy.
In most cases, the localization of the insulinoma before surgery was accomplished by at least two different imaging methods. Only 1 type of diagnostic procedure was used in 8 patients, 2 were used in 23 patients, 3 were used in 22, 4 were used in 16, 5 were used in 8,6 were used in 2, and 8 were used in 2. In 14 patients the tumor was not visualized by noninvasive methods or EUS before surgery. In these patients, the average number of imaging procedures was 3 (range, 1 to 4). There were no significant differences in size between tumors visible on imaging (n = 66) and those not visible (n = 14) [median, 15 (IQR, 10 to 20) mm vs. median, 11 (IQR, 8 to 15) mm; P = 0.18]. In 7 of these patients invasive methods were applied and in all cases the source of autonomous insulin secretion was detected (5 patients had both PTVS and ASVS and 2 had only ASVS). Thus, 7 tumors were not localized before surgery (imaging performed: CT in 4 patients, MRI in 4, US in 6, and EUS in 5). All 7 patients underwent intraoperative US; in 6 of them tumor could be visualized. The single tumor that could not be visualized was a 20-mm tumor situated in the tail of the pancreas. Intraoperative US was performed in most patients (n = 72) and had a sensitivity of 89%. Eight tumors were not visualized by this method: 4 in the tail of the pancreas, 3 in the head, and 1 in the body.
Comparison of different diagnostic procedures
For US vs EUS (n = 34), the P value was 0.018 in favor of EUS. In 11 patients tumor could not be detected by either method, in 12 patients tumor was visible on both modalities, in 9 patients tumor was visible only on EUS, and in 2 patients tumor was visible on transabdominal US but not on EUS. The 9 tumors visible only on EUS were significantly smaller than the 12 tumors that were visible on both EUS and US (11.7 mm ± 4.5 mm vs 17.4 mm ± 5.2 mm; P = 0.02).
For CT vs MRI (n = 18), the P value was 0.34. In 5 patients tumor was undetectable by either method, in 6 patients tumor was visible on both modalities, in 2 patients tumor was visible only on CT, and in 5 patients tumor was visible only on MRI. Size did not differ between tumors visible only on MRI and tumors visible on both CT and MRI (P = 0.51).
For MRI vs. EUS (n = 26), the P value was 0.54. In 5 patients tumor was undetectable by either method, in 9 patients tumor was visible with both modalities, in 5 patients tumor was visible only on MRI, and in 7 patients tumor was visible only on EUS. Size did not differ between tumors visible only on EUS and tumors visible only on MRI (14.4 mm ± 4.6 mm vs 13.4 mm ± 5.6 mm; P = 0.75).
We also compared SR imaging vs. radiology. Four of 15 patients had a positive result on 111In-octreotide scintigraphy. The 4 visible tumors were 17 to 50 mm, and all were visible on CT (n = 2), MRI (n = 2), and EUS (n = 2). 68Ga-DOTATOC PET/CT was performed in only 2 patients and was positive in 1 of them. It was a 11-mm tumor also visible on CT. The tumor not visible on 68Ga-DOTATOC PET was 15 mm and visible on CT.
Invasive investigations vs imaging
Two forms of invasive methods were performed on selected patients preoperatively: PTVS and ASVS. Among patients who had undergone PTVS (n = 10), all had previously had different imaging modalities (average, 2.5 modalities; range, 1 to 4). Nine patients had CT, and findings for all were negative. In 5 of 10 patients, tumors had been identified by using modalities other than CT, and PTVS could confirm the tumor location in 4 of these patients. In the remaining 5 patients, tumor location was unknown despite previous imaging, and here PTVS identified the tumor location in all patients. ASVS identified the source of autonomous insulin secretion in 13 of 20 patients. Before ASVS, patients had undergone different imaging modalities (average, 2.8; range, 1 to 5). In 12 patients, ASVS was a confirmatory test. ASVS findings were positive in 6 of 8 patients who had negative results on imaging.
We also compared PTVS vs. ASVS (n = 10). ASVS results were negative in 4 patients, including the only patient who had a negative PTVS finding (a 15-mm tumor in the pancreatic head visible on US and EUS). No major complications related to the invasive procedures were observed.
Surgical procedures
In 34 patients (43%) the tumor was located in the head of the gland; in 18 patients (22%), in the body; and in 28 patients (35%), in the tail. The most frequently applied procedure was enucleation or local resection (n = 46; 57%), followed by distal pancreatectomy (n = 26; 33%), Whipple procedure (n = 6; 7%), and mid resection (n = 1; 1%). In 1 patient the surgical procedure was unknown. Resections were described as R0 (n = 47), R1 (n = 6), or R2 (n = 4). Resection margins were unknown in 23 patients. Surgical procedures in relation to localization of the tumor are presented in Table 2. One patient who had enucleation of a 15-mm benign tumor in the body (R0) had a new primary insulinoma resected 4 years later without metastases. There were no perioperative deaths after primary pancreatic surgery. Unfortunately, valid information on surgical complications was not available. The patient with a MEN1 mutation had a distal pancreatectomy.
Surgical Procedures
| Localization of Tumor | Surgical Procedure | Middle Resection | Unknown | ||
|---|---|---|---|---|---|
| Enucleation | Distal Pancreatectomy | Whipple Procedure | |||
| Head (n = 34) | 27 | — | 6 | — | 1 |
| Body (n = 18) | 11 | 6 | — | 1 | — |
| Tail (n = 28) | 8 | 20 | — | — | — |
| Localization of Tumor | Surgical Procedure | Middle Resection | Unknown | ||
|---|---|---|---|---|---|
| Enucleation | Distal Pancreatectomy | Whipple Procedure | |||
| Head (n = 34) | 27 | — | 6 | — | 1 |
| Body (n = 18) | 11 | 6 | — | 1 | — |
| Tail (n = 28) | 8 | 20 | — | — | — |
Surgical procedure in relation to localization of insulinomas. All included patients had resection of the primary pancreatic tumor. Values are numbers of patients.
Histopathology
Median tumor size based on the pathological examination was 15 (range, 7 to 80) mm; 30% were < 1 cm and 80% were < 2 cm. Size did not significantly differ between tumors localized in the head, body, or tail (P = 0.14). The patient who turned out to have a MEN1 mutation had one primary tumor of 30 mm as well as numerous microtumors < 500 μm. The rest of the patients had solitary tumors. Immunohistochemically all tumors were stained for insulin, whereas other stainings were performed to a varying degree (Table 3). Forty-eight tumors (74%) were graded as G2 tumors (Ki-67 index, 3% to 20%), 16 (25%) as G1 (Ki-67 ≤ 2%), and 1 as G3 (Ki-67 > 20%). The median Ki-67 index was 3% (range, 1% to 100%). Positive staining for synaptophysin and positive or intermediate staining for CgA was seen in all tested specimens. In 94% of patients, there was positive proinsulin staining and in 83% there was positive insulin staining (Table 3). Staining for the SSTR-2a receptor by the UMB1 antibody was positive in 45% and intermediate in 12%.
Available Stainings and Results of Immunohistochemistry
| Immunohistochemistry | Available Stainings, n (%) | Negative (%) | Intermediate (%) | Positive (%) |
|---|---|---|---|---|
| Insulin | 80 (100) | 12 | 5 | 83 |
| Chromogranin A | 76 (95) | 0 | 10 | 90 |
| Synaptophysin | 69 (86) | 0 | 0 | 100 |
| Proinsulin | 65 (81) | 6 | 0 | 94 |
| UMB1 | 65 (81) | 43 | 12 | 45 |
| Amyloid | 65 (81) | 74 | 11 | 15 |
| Glucagon | 65 (81) | 91 | 6 | 3 |
| Pancreatic polypeptide | 48 (60) | 100 | 0 | 0 |
| CD117 | 48 (60) | 96 | 4 | 0 |
| Somatostatin | 48 (60) | 83 | 17 | 0 |
| Ki-67 | 65 (81) | — | — | — |
Numbers of available stainings and results of immunohistochemistry in 80 patients with insulinoma. Staining for insulin was done in all patients. Negative: <5% of cells with positive staining cells; intermediate: 5% to 50% of cells with positive staining; positive: >50% with positive staining.
SR imaging vs. SSTR-2a staining
Of the15 patients who underwent 111In-octreotide scintigraphy, 10 had positive or intermediate staining for SSTR-2a and 5 had negative staining. There was no significant correlation between staining for SSTR-2a and visibility on 111In-octreotide scintigraphy (P = 0.24). None of the 5 tumors with negative staining for SSTR-2a were visible on 111In-octreotide scintigraphy, whereas all 4 tumors visible on 111In-octreotide scintigraphy showed positive or intermediate staining for SSTR-2a. Six of 11 patients with negative 111In-octreotide scintigraphy results had positive or intermediate staining for SSTR-2a. Of the 10 patients with positive SSTR-2a staining, tumor size was significantly larger in 111In-octreotide scintigraphy–positive tumors than in negative tumors [median, 28 mm (range, 17 to 50 mm) vs. median, 13 mm (range, 7 to 22) mm; P = 0.02].
The 68Ga-DOTATOC PET–positive tumor (11 mm) showed positive staining for SSTR-2a. The tumor not visible on 68Ga-DOTATOC PET (15 mm) showed negative staining for SSTR-2a.
Malignant vs benign insulinomas
In patients with malignant insulinoma, 6 had metastatic disease at time of diagnosis, whereas 1 developed metastases during follow-up. Median age at diagnosis was 45 (range, 33 to 68) years vs 51 (range, 13 to 87) years for patients with benign insulinomas (P = NS). Five malignant insulinomas were stage IV with liver metastases, and 2 were stage IIB with lymph node metastases. Fifty-seven benign insulinomas were stage IA and 16 were stage IB. The malignant tumors were larger than the benign [35 (range, 10 to 80) mm vs 14 (range, 7 to 35) mm; P = 0.06]; however, proliferation rate did not significantly differ according to Ki-67 staining [5% (range, 2% to 100%) vs 3% (range, 1% to 15%; P = 0.35]. Compared with benign tumors, fewer malignant tumors showed positive staining for insulin (66 of 73 vs 3 of 7; P = 0.015) and for proinsulin (58 of 59 vs 3 of 6; P < 0.001). Three malignant tumors showed negative staining for both insulin and proinsulin compared with none in the benign tumors (P < 0.001). Positive staining for glucagon was seen in 2 of 6 malignant tumors and none in 59 benign tumors (P < 0.001) (Fig. 1). For other stainings, there were no significant differences between benign and malignant tumors.
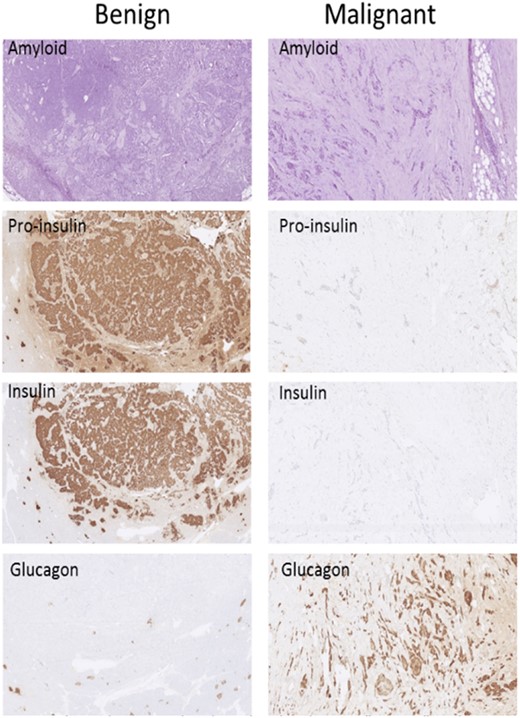
Immunohistochemistry findings in a localized tumor (left column, “Benign”) and in a tumor that had metastasized (right column, “Malignant”). Amyloid staining is included to better visualize the structure of the tumor because routine hematoxylin and eosin staining was not available. (Original magnification, ×70.)
Characteristics of the seven malignant cases
Several key histopathologic characteristics of the malignant tumors are presented in Table 4. For comparison, this table also provides the corresponding characteristics of the benign tumors.
Histopathological Characteristics of Seven Malignant Insulinomas
| Sex, Age, y | Stage | KI 67 (%) | Insulin | Proinsulin | CgA | Glucagon | UMB1 |
|---|---|---|---|---|---|---|---|
| Male, 33 | IIB | 3 | Positive | Positive | Positive | Negative | Negative |
| Female, 44 | IIB | 2 | Positive | Positive | Positive | Negative | Negative |
| Female, 64 | IV | 3 | Negative | Negative | Positive | Positive | Positive |
| Female, 68 | IV | — | Positive | — | — | — | — |
| Male, 43 | IV | 6 | Negative | Negative | Positive | Positive | Positive |
| Female, 53 | IV | 8 | Intermed | Positive | Intermed | Negative | Positive |
| Male, 45 | IV | 100 | Negative | Negative | Positive | Negative | Positive |
| Malignant tumors | IIB or IV | 5 (2–100) | 57% positive* | 50% positivea | 83% positive | 33% positivea | 67% positive |
| Benign tumors | IA or IB | 3 (1–15) | 90% positive | 98% positive | 91% positive | All negative | 42% positive |
Key immunohistochemical characteristics of the seven malignant insulinomas compared with those of 73 benign insulinomas. In patient 4 (female, age 68 y), only staining for insulin was available.
Malignant vs benign, P < 0.05.
Case 1
In this man diagnosed at age 33 years, a 4.2-cm tumor was found in the tail of the pancreas. He underwent distal pancreatectomy and resection of lymph node metastases. He was followed for 164 months without recurrence and was alive at the end of registration.
Case 2
In a woman diagnosed at age 44 years, a 1-cm tumor was found in the body of the pancreas. The tumor was removed by enucleation (R0 resection). Five years later, she developed lymph node metastases and a new primary insulinoma; she underwent eight additional surgical procedures due to local recurrences and lymph node metastases. She was followed for 242 months and was alive at the end of registration.
Case 3
This woman was diagnosed at age 64 years with an 8-cm large tumor in the tail of the pancreas (resection margins unknown). Cancer recurred after 163 months with lymph node and liver metastases. Metastatic lesions were surgically resected, but the patient died 7 days after surgery at age 78 years.
Case 4
At age 68 years, this woman was diagnosed with a 3.5-cm tumor in the body of the pancreas. She underwent distal pancreatectomy and resection of liver metastases. She was lost to follow-up after 96 months.
Case 5
In this man diagnosed at age 43 years, a 3-cm tumor was found in the tail of the pancreas. He had a distal pancreatectomy and resection of lymph node and liver metastases. He was followed for 12 months and was alive at the end of registration, without evidence of recurrence.
Case 6
A woman diagnosed at 53 years had a 1-cm tumor in the tail of the pancreas. She had a distal pancreatectomy with resection of lymph node metastases; a few months later, she was diagnosed with liver metastases. She was treated with radiofrequency ablation and peptide receptor radionuclide therapy and was still alive after 26 months.
Case 7
At age 45 years, this man was diagnosed with a 5-cm tumor in the tail of the pancreas. A distal pancreatectomy was performed, but he had lymph node and liver metastases at diagnosis and died 14 months after surgery.
Discussion
This study reports data on presurgical imaging and immunohistochemistry results in 80 patients with insulinoma undergoing surgical resection of the tumor. We found significant differences in staining for insulin, proinsulin, and glucagon between benign and malignant tumors. We confirmed that visualization of insulinomas is often challenging, but in most cases the tumor can be identified before surgery by use of different diagnostic modalities.
Preoperative localization of insulinomas is important for planning the surgical approach (enucleation or pancreatic resection). In our study, the average number of presurgical localization procedures was 3 (range, 1 to 8). The chosen imaging strategy obviously depended on those available. CT and US are available in most centers and, in our cohort, had a sensitivity of 47% and 40%, respectively. MRI was slightly more sensitive (58%) than CT, but we did not find a significant difference in size between tumors visible on CT and those visible on MRI. A recent systematic review of the literature (3) evaluated the sensitivity of different localization procedures (n = 782; 18 studies), and similar to our results, found EUS was the most sensitive method (sensitivity, 80%), followed by MRI (66%), CT (63%), 111In-octreotide scintigraphy (42%), and US (23%). The sensitivity of ASVS was 80%.
EUS is highly dependent on the expertise of the endoscopist, which is also confirmed by our data. We observed significantly better EUS results in the German cohort than the Danish cohort. In the German cohort, a sensitivity of 100% was achieved (2006 to 2014; n = 16) when the procedure was centralized and performed by only one experienced endoscopist. Data suggest that the sensitivity of EUS depends on the localization of the tumor, with the highest sensitivity in the pancreatic head and the lowest in the pancreatic tail (9, 10). In our study, the EUS also had the highest sensitivity for tumors in the pancreatic head (75%), whereas the lowest was found for tumors in the pancreatic body (47%). The sensitivity for tumors in the tail (71%) was almost as high as for tumors in the head.
The overall sensitivity of 111In-octreotide scintigraphy was only about one third (detecting 4 of 15 tumors), and 111In-octreotide scintigraphy did not visualize any tumors that were not visualized on CT, MRI, or EUS. As expected, no tumors with negative staining for SSTR-2a could be visualized by SRI. However only 4 of 10 tumors staining positive for SSTR-2a were actually visible on 111In-octreotide scintigraphy. These 4 tumors were significantly larger than the 6 tumors not visible on 111In-octreotide scintigraphy. Thus, our data indicate that the low overall sensitivity of 111In-octreotide scintigraphy is due to lack of SSTR-2a expression of tumor cells and a low capability to visualize small SSTR-2a–positive tumors.
Recent data suggest that 68Ga-DOTATOC PET/CT may be superior to other imaging modalities (11), but because only 2 patients examined with this method we cannot address this question. Insulinomas have a high expression of glucagon-like peptide-1 receptors, and imaging with radiolabeled glucagon-like peptide-1 analogs (68Ga-DOTA-exendin-4 PET/CT) has been superior to conventional imaging, but this method is available at only few centers (12).
Taken together, the minor differences in sensitivity between the different methods as well as the fact that some tumors were visible on, for example, MRI and not EUS and vice versa, justifies the use of a broad spectrum of imaging modalities, including US, CT, MRI, EUS, and 68Ga-DOTATOC PET/CT, in the diagnostic workup of insulinomas. We do not recommend the use of 111In-octreotide scintigraphy on the basis of our results. It could be argued that PET-based SRI would increase sensitivity; however, because we found that only 67% of the tumors expressed the SRI target SSTR, this will be the highest theoretical achievable sensitivity. This sensitivity should still be considered too low for SRI to be recommended for routine use.
Intraoperative US was performed in most cases to localize tumor, identify the presence of additional pNENs, establish the relation between the insulinoma and the main pancreatic duct, and to determine the type of surgery. Intraoperative-US had a high sensitivity and we consider this method to be mandatory.
Different invasive methods have been developed to localize the tumor (13), but the utility of these methods is limited by their invasive nature. Similar to previous investigations (5, 13, 14), we could confirm a high sensitivity of PTVS, with an overall sensitivity of 90%. PTVS detected the source of insulin secretion in 5 of 5 patients with negative imaging results. Twenty of our patients underwent ASVS, with an overall sensitivity of 65%. This is slightly lower than reported elsewhere (14, 15). Complication rates, especially after PTVS, have been reported to be high (∼10%) (13), but we did not observe any major complications related to PTVS or ASVS. Invasive diagnostic tools are now rarely used because they require a large and experienced setup. However, in guidelines (2, 16), as well as in a recent publication (4), invasive methods are still suggested as an option in case of negative imaging findings. Thus, we still consider invasive methods as a valid supplement in experienced hands in cases of negative results on conventional imaging.
As reported in previous series, we found that insulinomas at time of diagnosis are small, with 80% < 2 cm, and equally distributed in the gland. Immunohistochemistry confirmed that all tumors originated from neuroendocrine tissue with positive staining for synaptophysin and CgA. Most tumors were G2, with a median KI-67 index of only 3%. This is lower than in nonfunctioning pNENs but in agreement with a report of insulinomas (17). Previous studies have found a varying degree of insulin immunohistochemistry staining in tumors from patients with insulinoma (18–20), which is consistent with our findings. In the largest cohort to date with available immunohistochemistry data (n = 62; benign, n = 61), only 91% stained positive for insulin, and in our cohort the number was even lower, at 83% (20). Several possible reasons may explain the lack of staining for proinsulin and insulin in tumors secreting insulin. Insulinomas show less staining for insulin compared with normal islet cells, and this could be due to a defect in the insulin storage capacity (20). Sampling error may also contribute to the lack of staining for proinsulin and insulin (20).
In agreement with the literature, ∼10% of insulinomas were malignant on the basis of local or distant metastases. However, the total number of malignant insulinomas at our two centers is higher than described in this study because patients with widespread disease not undergoing surgery were excluded from the analysis. This may explain the high overall survival among the patients with malignant tumors; only 2 of 7 patients followed for a median of 96 (range, 12 to 242) months died of insulinoma.
No well-established immunohistochemical characteristics can distinguish a malignant from a benign insulinoma. Malignant insulinomas are often larger and have a higher proliferation index. However, as illustrated by our results as well as others (18, 21), there is a substantial overlap between benign and malign in terms of tumor size and proliferation expressed by Ki-67 staining. Moreover, the clinical outcome and prognosis among malignant insulinomas are highly variable. Thus, histopathological characteristics that can predict the biological behavior of a tumor are warranted. One of the main results from the current study was the highly significant immunohistochemical differences between malignant and benign insulinomas. Lack of staining for insulin and proinsulin was seen in three (all three were stage IV) malignant tumors, whereas none of the benign tumors were negative with regard to both insulin and proinsulin. Additionally, two malignant stage IV tumors showed positive staining for glucagon, whereas all benign tumors were negative. In other neuroendocrine neoplasms, lack of staining for CgA is associated with malignancy and poor prognosis (22), but in our study there were no differences in CgA staining between benign and malignant tumors.
A previous study with data on routine immunohistochemistry in benign (n = 38) and malignant (n = 15) insulinomas (18) found that 8 of 15 malignant tumors stained for glucagon compared with 4 of 38 benign tumors. These findings agree with our results. However, the same study found no differences with respect to insulin staining between benign and malignant tumors and did not perform staining for proinsulin (18). A review of 35 cases with malignant insulinomas found that insulin staining was negative in 2 patients and only focally positive in the remaining patients (23). The authors suggest that this could be caused by reduced capacity for insulin secretion, which could explain why hypoglycemic symptoms appear late in the course of tumor growth in giant insulinomas. The tumor size in our 3 patients with negative proinsulin/insulin staining were 30, 50, and 80 mm, respectively. We suggest that lack of staining for proinsulin/insulin and positive staining for glucagon are signs of poor differentiation and are thereby associated with malignant behavior. Malignant insulinomas often show an increased serum proinsulin/insulin ratio compared with benign insulinomas, which could be explained by poor differentiation with secretion of precursors of the intact hormone (24).
To distinguish benign from malignant insulinomas, other immunohistochemical stainings have been applied in experimental studies, such as neural cell adhesion molecule, epithelial cell adhesion module, cleaved caspase-3, human chorionic gonadotropin subunits, and somatostatin receptor subtypes 1 to 5 (18, 25–28). The results from these studies have been conflicting, and none of these stainings have been sufficiently evaluated to be included in clinical practice. Several studies have investigated whether genetic analyses of possible genetic alterations in insulinomas could improve the classification of benign vs malignant (17, 29, 30). Only one study evaluated the prognostic value of these analyses (17). Expression of the serpin peptidase inhibitor clade A member 1 gene was higher in malignant insulinomas than benign tumors (17). Finally, one study suggested that proteomics may be a valuable prognostic tool in patients with insulinoma (21).
Limitations to our study include the retrospective design and the fact that not all imaging modalities and stainings were performed in all patients/tumors. This could imply a risk of selection bias. We know of no prospective data available in this field. Moreover, the data have been collected over a period of 25 years, during which there substantial technological advances in imaging technics have been made. Thus, the performance of different imaging modalities should be compared with caution.
In conclusion, the current study confirms that the preoperative localization of insulinomas is often challenging and requires several different diagnostic procedures. In accordance with previous reports, however, most tumors could be localized by conventional noninvasive imaging, including CT, US, and MRI. In experienced hands, EUS seems superior to other imaging modalities, emphasizing the need of centralization of this procedure. In the case of nonvisible tumors, our data suggest that invasive methods as well as intraoperative US can be useful diagnostic tools to avoid blind resection. As in previous studies, the proportion of malignant tumors was ∼10%. However, this study did not include nonresectable malignant insulinomas, which may increase the proportion of malignant insulinomas. We found significant histopathological differences between malignant and benign tumors, with reduced insulin and proinsulin and increased glucagon staining in malignant tumors.
Acknowledgments
Financial Support: Financial support was kindly provided by Internationalization Foundation (A.K., U.K.), Institute for Clinical Medicine (A.K., U.K.), University of Copenhagen (U.K.), The Danish Cancer Society (E.I.), and the Arvid Nilssons Foundation (A.K.).
Additional Information
Disclosure Summary: The authors have nothing to disclose.
Data Availability: All data generated or analyzed during this study are included in this published article or in the data repositories listed in References.
Abbreviations:
- ASVS
arterial stimulation venous sampling
- CgA
chromogranin A
- EUS
endoscopic ultrasonography
- IQR
interquartile range
- MEN1
multiple endocrine neoplasia type 1
- PET
positron emission tomography
- pNEN
pancreatic neuroendocrine neoplasm
- PTVS
percutaneous transhepatic venous sampling
- SRI
somatostatin receptor imaging
- SSTR-2a
somatostatin receptor subtype 2a
- US
ultrasonography
