


Abstract
Time spent in moderate-to-vigorous physical activity (MVPA), but not in sedentary behavior (SB), is related to cardiometabolic risk among non-Hispanic white youth.
Examine associations of SB and MVPA with cardiometabolic risk factors among Hispanic/Latino youth.
Cross-sectional analysis.
Four US communities.
Hispanic/Latino youth (N = 1,426) ages 8 to 16 years.
Associations of MVPA and SB, measured using 7-day accelerometer data (independent variables), with markers of glucose and lipid metabolism, inflammation, and endothelial function (dependent variables), were assessed in multivariable linear regression models while adjusting for sociodemographic characteristics and accelerometer wear time. Additional models controlled for obesity measures.
SB comprised a mean (SD) of 75% (13%) of accelerometer wear time; mean (SD) time of MVPA was 35 min/d (22 min/d). Deleterious levels of high-density lipoprotein–cholesterol (HDL-C), triglycerides, insulin resistance, C-reactive protein, and plasminogen activator inhibitor-1 were associated with lower levels of MVPA and higher levels of SB (all P < 0.05). Associations of MVPA with log-transformed triglyceride concentrations (β per 15-min/d increment, −0.039; SE, 0.018; P = 0.037) and SB with HDL-C (β per 30-min/d increment, −0.63; SE, 0.26; P = 0.018), but not those with other markers, remained significant after adjusting for MVPA or SB and further adjustment for body mass index and waist circumference. Higher SB tertiles were associated with lower soluble receptor for advanced glycation end products in fully adjusted models (P for trend = 0.037).
Physiological precursors of diabetes and cardiovascular disease were associated with MVPA and SB among US Hispanic/Latino youth, a group that bears a disproportionate burden of metabolic disorders.
Maintaining a physically active lifestyle in youth has been linked with favorable health outcomes in experimental and longitudinal observational studies (1). Accordingly, children and adolescents are recommended to engage in at least 60 minutes of moderate-to-vigorous-intensity physical activity daily (1, 2). Among adults, an increasing body of evidence suggests that time spent in sedentary behavior (SB), characterized as activities in the sitting or reclining posture with energy expenditure between 1.0 to 1.5 metabolic equivalents, distinctly influences cardiometabolic health outcomes independent of time spent in moderate-to-vigorous-intensity physical activity (MVPA) (3, 4). However, relationships between SB and cardiometabolic risk factors in children and adolescents remain unsettled.
A pooled analysis using objectively measured data from 14 studies found that MVPA, but not SB, was associated with cardiometabolic risk factors in children and adolescents after adjusting for waist circumference (5). However, most studies included in the analysis were conducted in European countries, with samples largely composed of non-Hispanic white children and adolescents, and the analysis was restricted to traditional risk factors including high-density lipoprotein–cholesterol (HDL-C), triglycerides, insulin, and systolic blood pressure.
Hispanic/Latino youth are disproportionally affected by obesity and related cardiometabolic conditions, and have higher rates of physical inactivity than their non-Hispanic white peers (6). Findings of previous studies of SB in relation to cardiometabolic risk factors in this segment of the US population are mixed. Although some studies report that higher levels of objectively measured SB are associated with increased cardiometabolic risk (7, 8), others do not (9, 10). Discrepant results may have been influenced by the relatively small sample sizes (n < 100) (7, 8) and by heterogeneity in participant characteristics across and within studies.
To inform future guidelines for the reduction of cardiometabolic risk among youth, there is a pressing need to understand whether reducing SB should be emphasized beyond the current focus on increasing MVPA. Thus, we examined the association of objectively measured physical activity and SB with cardiometabolic risk factors in a large and diverse sample of US Hispanic/Latino youth. Analyses simultaneously adjusted for MVPA and SB measures to assess their independent associations with cardiometabolic risk factors. In addition, to better understand mechanisms linking MVPA and SB with cardiometabolic outcomes, we examined associations with emerging markers of cardiovascular risk, including regulators of glucose metabolism (namely, adiponectin and soluble receptor for advanced glycation end products), inflammation (namely, C-reactive protein), and endothelial function (namely, E-selectin and plasminogen activator inhibitor-1). Because activity levels differ by age and sex (11), interaction analyses were conducted to evaluate heterogeneity in effects across subgroups.
Methods
Study population
Hispanic Community Health Study/Study of Latinos (HCHS/SOL)-Youth is an ancillary study to the HCHS/SOL population-based cohort study of 16,415 Hispanic and Latino adults (ages 18 to 74 years) who were recruited from Chicago, Illinois; Miami, Florida; Bronx, New York; and San Diego, California (12). SOL-Youth enrolled a subset of the offspring of HCHS/SOL participants, as described in detail previously (13). Briefly, between 2012 and 2014, 6,741 households of HCHS/SOL participants were screened via a telephone call using a standardized script. The screening identified 1777 eligible children, of whom 1466 enrolled, achieving a participation rate of 82%. Eligible children were those between the ages of 8 and 16 years who lived at least 5 d/wk and 9 mo/y with the HCHS/SOL parent or legal guardian, and who were physically and cognitively able to complete the in-person clinic visit. A total of 1,426 children were included in the final analytical sample, after excluding those with <8 hours fasting prior to clinic visit (n = 24); those with constant accelerometer wear time, which was judged to indicate the device was not removed while sleeping and, therefore, would overestimate SB (n = 13); and those with extreme outlying values for fasting plasma glucose (>140 mg/dL; n = 3), which were more than 5 SD from the mean value. The study was conducted with approval from institutional review boards of each institution involved in the study. Written parent or caregiver informed consent and child assent were obtained.
SB and physical activity
Participants were asked to wear an accelerometer (Actical model 198-0200-03; Respironics, Bend, OR) for 7 days. The device was positioned above the iliac crest and removed only for swimming, showering, and sleeping (14). The Actical has been validated and calibrated in adolescents (15). Nonwear time was determined using the Choi algorithm (16), defined as ≥90 consecutive minutes of zero counts, with allowance of 1 or 2 minutes of nonzero counts if no counts were detected in a 30-minute window upstream and downstream of the 90-minute period. Activity counts between 12:00 am and 5:00 am were treated as nonwear time because we assumed that activity during these presumed sleeping hours does not represent usual behaviors.
MVPA and SB were defined using validated cut points of ≥441 counts/15 seconds for MVPA and <18 counts/15 s for SB (15). Participants with wear time ≥8 h/d and <19 h/d on average for ≥3 days were included in the analyses. To control for correlation between SB and wear time (R2 = 0.64), we standardized SB to the mean wear time (13.6 h/d) in our analytic sample, using the residual from regressing SB on wear time (4).
There were differences in protocol adherence by field center (P = 0.0064; 33% of San Diego participants were not adherent to the protocol, as compared with 25% in the Bronx, 18% in Chicago, and 20% in Miami). However, compliance was similar by sex, age, national background, foreign birth, language preference, annual household income, parent education, central adiposity, and body mass index (BMI; all P > 0.05).
Cardiometabolic biomarkers
Seated blood pressure was recorded as the average of three measurements by automatic sphygmomanometer (OMRON HEM-907 XL; Omron Health care, Bannockburn, IL) (17). All blood specimens were collected in the morning under fasting conditions, processed and separated on site, and stored at −70°C. The University of Minnesota's Advanced Research and Diagnostic Laboratory performed all laboratory assays. Measurements of HDL-C, low-density lipoprotein cholesterol, triglycerides, fasting glucose, and glycated HbA1c have been described previously (17). Fasting insulin concentration was measured on either a Modular P (before 1 January 2014) or COBAS 6000 chemistry analyzer (starting 1 January 2014; Roche Diagnostics, Indianapolis, IN) using the same methodology, calibration, and control for all samples. The homeostasis model assessment of insulin resistance (HOMA-IR) was computed using the following equation: (fasting glucose concentration multiplied by fasting insulin concentration) divided by 405.21 (18). High-sensitivity C-reactive protein (hs-CRP) was measured using an immunoturbidimetric method on the COBAS 6000 chemistry analyzer (Roche Diagnostics, Indianapolis, IN). ELISA methods using the Biomek 2000/NXp (Beckman Coulter, Fullerton, CA) were used to quantify plasma levels of adiponectin, plasminogen activator inhibitor-1 (PAI-1), and serum levels of soluble E-selectin (Quantikine ELISA kit; R & D Systems, Minneapolis, MN). Quantification of plasma soluble receptor for advanced glycation end products (sRAGE; Human sRAGE ELISA kit; Biovendor Research and Diagnostic Products, Asheville, NC) was performed in a random sample of participants (n = 689), due to resource constraints. Laboratory interassay coefficients of variation on manufacturer controls were 6.7% for hs-CRP and ranged from 5.7% to 10.0% for adiponectin; 3.7% to 5.6% for PAI-1, 4.7% to 7.9% for sRAGE, 4.5% to 6.7% for E-selectin, 1.3% to 3.1% for glycemic markers, and 1.3% to 5.2% for lipids. Values for triglycerides, fasting insulin, HOMA-IR, hs-CRP, PAI-1, E-selectin, and sRAGE were modeled as log transformed.
Covariates
Children and their parents or caregivers reported their Hispanic/Latino background (i.e., Central American, Cuban, Dominican, Mexican, Puerto Rican, South American, and other/mixed), an indicator of cultural, environmental, and genetic differences among diverse US Hispanic/Latino populations and an important correlate of health outcomes and behaviors (19). Place of birth, date of birth, and sex were also parent reported, as were household income and parent educational attainment. Measurements of standing height, body weight, and waist circumference have been described previously (17). BMI was calculated as weight in kilograms divided by height in meters squared and standardized to percentiles by age and sex according to 2000 Centers for Disease Control and Prevention growth charts (20), with obesity defined as BMI ≥95 percentile. Waist circumference was measured to the nearest centimeter using the Gulick II anthropometric tape (FitnessMart, division of Country Technology, Gays Mill, WI). Central adiposity was defined as waist circumference ≥90th percentile for age and sex according to national statistics (21). Stages of hormonal and physical development were assessed using the Pubertal Development Scale self-assessment to estimate Tanner stage (22). Last, the Healthy Eating Index -2010 score was computed as an indicator of diet quality from two 24-hour dietary recalls to reflect concordance with 12 components of the 2010 federal dietary guidelines (23). Higher Healthy Eating Index-2010 scores reflect better diet quality.
Statistical analysis
All analyses, accounting for design effects and sampling weights, were performed using SAS, version 9.3 (SAS Institute, Cary, NC) and SUDAAN, release 11.0.1 (RTI International, Research Triangle Park, NC). Among participants adherent to the accelerometer protocol (n = 1074), age-adjusted descriptive characteristics across tertiles of MVPA and SB were computed as predicted marginal means for continuous variables from survey-weighted linear regression, and for categorical variables as predicted marginals of the prevalence from survey-weighted logistic regression.
For the primary analyses, to mitigate biases associated with exclusion of participants with incomplete data (24), SB and MVPA were imputed for those not adherent to the accelerometer protocol. Regression models containing all model covariates and dependent variables, as well as other observed variables thought to be related to SB or MVPA, were constructed using SAS PROC MI to derive imputed data sets (Supplemental Materials and Methods). Dependent variables (i.e., cardiometabolic biomarkers) were included in the imputation models of SB and MVPA, but primary analyses were restricted to those with complete data for each biomarker. A series of survey linear regression models were applied to examine associations of MVPA and SB with the cardiometabolic biomarkers on 10 imputed data sets. MVPA and SB were modeled separately; potential confounders, including age, sex, Hispanic/Latino background, field center, immigrant generation, parental education level, annual household income, and diet quality, were adjusted for in models examining MVPA and SB (model 1). Models of MVPA were also adjusted for accelerometer wear time. Subsequent models were additionally adjusted for SB and MVPA in the same model (model 2). Final models were additionally adjusted for waist circumference and BMI (model 3). Of note, multicollinearity between BMI and waist circumference (r = 0.70), and between SB and MVPA (r = −0.65), did not inflate the variance of the main association of interest, as demonstrated by a variance inflation factor for all analyses of <2.5. MVPA and SB were modeled as continuous as well as tertile variables because prior studies suggested their associations with health outcomes are not linear across the full range of the activity levels (25).
Statistical tests for a linear trend across tertiles were computed by treating tertile variables as continuous and coding at the median value for each tertile. We also examined combined associations of SB and MVPA with cardiometabolic biomarkers based on nine subgroups (three SB tertiles multiplied by three MVPA tertiles). Additional interaction models were constructed to examine heterogeneous effects across levels of age, sex, field center, annual household income, nativity status, obesity, and Hispanic/Latino background.
Last, to examine the sensitivity of multiple imputation of primary predictor variables on our results, all analyses were repeated, while restricting to those adherent to accelerometry protocols (n = 1074). P < 0.05 was considered statistically significant for all analyses.
Results
Participant characteristics
Approximately half of the study population was between 8 and 12 years of age (54%). Mean (SD) nonweighted standardized time spent in SB was 604 (66) min/d, 75% of wear-time, on average, was spent in SB (SD, 13%), and mean (SD) nonweighted time spent in MVPA was 35.2 (22.2) min/d. Time spent in SB correlated with time spent in light-intensity (r = −0.88), moderate-intensity (r = −0.64), vigorous-intensity (r = −0.60), and MVPA (r = −0.65). We observed fair agreement between tertiles of SB and tertiles of MVPA (κ, 0.34; 95% CI: 0.29, 0.40; Supplemental Table 1). Individuals in the highest tertile of time spent in SB and lowest tertile of MVPA were on average older and, after adjusting for age, had higher BMI and waist circumference, and were more likely to be female, than those in groups characterized by less time sedentary or higher MVPA (Table 1). Pubertal development stage was not associated with either SB or MVPA after adjusting for age (P > 0.05).
Age-Adjusted Characteristics of the Study Population According to Tertiles of SB and Moderate to Vigorous Physical Activity (N = 1074)
| SB | MVPA | |||||||
|---|---|---|---|---|---|---|---|---|
| Tertile 1a | Tertile 2b | Tertile 3c | P | Tertile 1d | Tertile 2e | Tertile 3f | P | |
| MVPA, min/d | 53 (50 to 57) | 34 (31 to 36) | 22 (20 to 24) | <0.0001 | 15 (14 to 16) | 32 (31 to 33) | 60 (57 to 63) | n/a |
| Sedentary, min/d | 532 (526 to 537) | 609 (606 to 611) | 672 (669 to 676) | n/a | 652 (646 to 657) | 612 (605 to 618) | 559 (549 to 568) | <0.0001 |
| Age, y | 10 (10 to 11) | 12 (11 to 12) | 14 (13 to 14) | <0.0001 | 13 (12 to 13) | 12 (12 to 12) | 11 (11 to 12) | <0.0001 |
| Age, y, % | <0.0001 | <0.0001 | ||||||
| 8–12 | 83 (78 to 87) | 64 (57 to 70) | 26 (21 to 32) | 45 (39 to 52) | 59 (53 to 65) | 64 (57 to 70) | ||
| 13–14 | 11 (8 to 16) | 20 (16 to 25) | 31 (25 to 37) | 31 (26 to 37) | 16 (12 to 21) | 17 (13 to 21) | ||
| 15–16 | 5 (3 to 9) | 16 (12 to 22) | 43 (36 to 51) | 24 (18 to 30) | 25 (18 to 32) | 19 (14 to 26) | ||
| Female sex, % | 41 (35 to 48) | 54 (48 to 60) | 56 (48 to 63) | 0.0080 | 61 (54 to 68) | 50 (43 to 57) | 40 (34 to 47) | 0.0003 |
| Hispanic background, % | 0.0722 | 0.0042 | ||||||
| Central American | 4 (2 to 7) | 7 (5 to 11) | 8 (5 to 11) | 9 (6 to 14) | 6 (3 to 10) | 4 (2 to 7) | ||
| Cuban | 5 (3 to 8) | 7 (4 to 12) | 6 (3 to 9) | 10 (7 to 14) | 6 (3 to 10) | 3 (2 to 5) | ||
| Dominican | 11 (6 to 17) | 11 (7 to 16) | 15 (10 to 21) | 9 (6 to 14) | 14 (10 to 20) | 14 (9 to 20) | ||
| Mexican | 50 (42 to 58) | 47 (39 to 55) | 41 (33 to 50) | 42 (33 to 51) | 47 (40 to 55) | 49 (41 to 57) | ||
| Puerto Rican | 14 (9 to 21) | 7 (4 to 12) | 8 (5 to 13) | 8 (5 to 14) | 8 (5 to 12) | 12 (8 to 17) | ||
| South American | 2 (1 to 3) | 5 (3 to 8) | 5 (3 to 11) | 5 (3 to 10) | 4 (2 to 6) | 2 (1 to 5) | ||
| Other/>1 | 12 (9 to 17) | 13 (9 to 19) | 13 (9 to 20) | 12 (8 to 18) | 13 (9 to 19) | 14 (9 to 19) | ||
| Field center, % | 0.0365 | 0.0001 | ||||||
| Bronx, NY | 38 (31 to 47) | 31 (25 to 39) | 40 (33 to 48) | 30 (23 to 38) | 32 (25 to 39) | 48 (40 to 56) | ||
| Chicago, IL | 12 (9 to 17) | 20 (15 to 25) | 21 (15 to 29) | 18 (14 to 23) | 22 (16 to 30) | 13 (9 to 17) | ||
| Miami, FL | 14 (10 to 19) | 16 (11 to 22) | 15 (11 to 20) | 21 (16 to 28) | 14 (10 to 19) | 10 (7 to 13) | ||
| San Diego, CA | 36 (29 to 43) | 33 (26 to 41) | 24 (18 to 32) | 30 (22 to 40) | 32 (24 to 40) | 30 (23 to 37) | ||
| Nativity (within 50 states), % | 83 (77 to 88) | 77 (70 to 82) | 78 (72 to 84) | 0.3014 | 77 (71 to 82) | 80 (74 to 85) | 80 (73 to 86) | 0.5235 |
| Parent has less than high school education, % | 38 (30 to 45) | 40 (33 to 48) | 36 (28 to 45) | 0.8889 | 33 (26 to 42) | 35 (28 to 44) | 45 (37 to 53) | 0.018 |
| Annual family income, USD, % | 0.4343 | 0.3465 | ||||||
| <20,000 | 57 (49 to 64) | 49 (42 to 56) | 52 (45 to 60) | 51 (43 to 60) | 49 (41 to 57) | 58 (50 to 66) | ||
| 20,000–50,000 | 27 (21 to 34) | 33 (27 to 40) | 27 (21 to 34) | 31 (24 to 39) | 29 (22 to 36) | 28 (21 to 35) | ||
| >50,000 | 14 (10 to 20) | 15 (10 to 21) | 16 (11 to 24) | 15 (10 to 22) | 18 (13 to 25) | 12 (8 to 17) | ||
| Healthy Eating Index | 55 (53 to 56) | 53 (52 to 55) | 53 (51 to 55) | 0.2291 | 53 (51 to 55) | 54 (52 to 56) | 54 (52 to 55) | 0.7059 |
| BMI, kg/m2 | 21 (20 to 22) | 22 (21 to 23) | 23 (23 to 24) | <0.0001 | 24 (23 to 25) | 22 (21 to 23) | 21 (20 to 22) | <0.0001 |
| Obesity, % | 21 (16 to 26) | 26 (21 to 32) | 32 (26 to 39) | 0.0215 | 32 (26 to 39) | 27 (21 to 34) | 19 (14 to 24) | 0.002 |
| Central adiposity, % | 9 (6 to 13) | 11 (7 to 16) | 21 (15 to 27) | 0.0014 | 20 (14 to 26) | 13 (8 to 20) | 7 (4 to 10) | 0.0005 |
| Waist circumference, cm | 74 (72 to 75) | 77 (75 to 78) | 80 (78 to 83) | <0.0001 | 81 (79 to 83) | 77 (74 to 79) | 74 (72 to 75) | <0.0001 |
| Estimated Tanner stage IV or V, % | 64 (57 to 70) | 70 (64 to 75) | 69 (62 to 75) | 0.2809 | 67 (62 to 72) | 71 (65 to 76) | 64 (57 to 71) | 0.2826 |
| I | 4 (2 to 6) | 3 (1 to 5) | 1 (0 to 5) | 2 (1 to 5) | 2 (1 to 4) | 4 (3 to 7) | ||
| II | 7 (4 to 12) | 5 (3 to 8) | 7 (4 to 13) | 8 (5 to 12) | 6 (3 to 9) | 6 (3 to 10) | ||
| III | 12 (9 to 16) | 12 (8 to 16) | 13 (8 to 20) | 12 (9 to 18) | 13 (9 to 17) | 11 (8 to 15) | ||
| IV | 15 (11 to 22) | 14 (10 to 18) | 16 (11 to 22) | 14 (10 to 19) | 17 (13 to 23) | 13 (9 to 17) | ||
| V | 23 (17 to 30) | 31 (26 to 37) | 31 (26 to 36) | 31 (26 to 36) | 29 (23 to 36) | 27 (22 to 33) | ||
Data presented as means or column percentages and accompanying 95% CIs. Percentages may not add to 100 due to missing values; P values calculated while excluding those with missing values for each covariate; characteristics for each tertile adjusted to the age distribution of the target population (56% were of ages 8 to 12 y; 21%, ages 13 to 14 y; 22%, ages 15 to 16 y), except for Tanner stage, which was adjusted for across tertiles to mean age in the target population (i.e., 12.0 y).
Abbreviation: n/a, not applicable.
367 to 578 min/d.
578 to 634 min/d.
634 to 798 min/d.
1 to 24 min/d.
24 to 40 min/d.
41 to 241 min/d.
Association between SB and cardiometabolic biomarkers
After adjustment for sociodemographic characteristics, SB was associated with lower levels of HDL-C, as well as higher levels of triglycerides, fasting insulin, HOMA-IR, hs-CRP, and PAI-1 (P < 0.05 for all; Table 2). After additional adjustment for MVPA and additional adjustment for markers of adiposity, BMI, and waist circumference, the association between SB and HDL-C remained significant (β for each 30-min/d increment, −0.63; SE, 0.26; P = 0.018). The associations of SB with all other biomarkers were attenuated and no longer statistically significant after adjustment for MVPA. The significant association with HDL-C was also evident when modeling tertiles of SB (P for trend = 0.044; Table 3). In addition, we observed a significant linear trend in the association between SB and sRAGE (P for trend = 0.037), which remained significant after adjusting for BMI percentile and waist circumference (P for trend = 0.045; data not shown).
Associations of SB and Moderate to Vigorous Physical Activity With Cardiometabolic Risk Factors Among US Hispanic/Latino Youth: Results From Multivariable Linear Regression (n = 1426)
| Dependent Variable | No. | Model 1 | Model 2 a | Model 3 b | |||
|---|---|---|---|---|---|---|---|
| SB | MVPA | SB | MVPA | SB | MVPA | ||
| LDL-C, mg/dL | 1396 | 0.12 (0.42) | −0.55 (0.55) | −0.64 (0.60) | −0.91 (0.86) | −0.78 (0.59) | −0.45 (0.86) |
| HDL-C, mg/dL | 1398 | −0.96 (0.22)c | 1.11 (0.33)d | −0.72 (0.29)e | 0.37 (0.42) | −0.63 (0.26)e | −0.18 (0.38) |
| Triglycerides, mg/dLf | 1398 | 0.03 (0.01)d | −0.06 (0.01)c | −0.02 (0.01) | −0.06 (0.02)d | −0.02 (0.01) | −0.04 (0.02)e |
| SBP, percentile | 1423 | −0.16 (0.46) | −0.09 (0.67) | −0.73 (0.66) | −0.52 (1.02) | −0.53 (0.68) | −0.30 (1.00) |
| DBP, percentile | 1424 | 0.36 (0.42) | −0.90 (0.59) | −0.54 (0.56) | −1.14 (0.85) | −0.53 (0.57) | −0.67 (0.84) |
| Fasting glucose, mg/dL | 1373 | 0.15 (0.11) | −0.10 (0.17) | 0.17 (0.17) | 0.09 (0.26) | 0.16 (0.17) | 0.17 (0.26) |
| Fasting insulin, mU/Lf | 1367 | 0.07 (0.01)c | −0.11 (0.02)c | 0.02 (0.02) | −0.08 (0.03)d | 0.01 (0.01) | −0.03 (0.02) |
| HOMA-IRf | 1365 | 0.07 (0.01)c | −0.11 (0.02)c | 0.02 (0.02) | −0.08 (0.03)d | 0.01 (0.01) | −0.03 (0.02) |
| HbA1c, % | 1372 | 0.00 (0.01) | −0.01 (0.01) | −0.01 (0.01) | −0.01 (0.01) | −0.01 (0.01) | −0.01 (0.01) |
| hs-CRP, mg/Lf | 1423 | 0.06 (0.03)e | −0.10 (0.04)e | 0.02 (0.03) | −0.08 (0.05) | 0.00 (0.03) | 0.00 (0.04) |
| Adiponectin, ng/mL | 1371 | −0.13 (0.08) | 0.22 (0.11)e | −0.05 (0.11) | 0.21 (0.17) | −0.02 (0.11) | 0.01 (0.16) |
| PAI-1, ng/mLf | 1369 | 0.07 (0.02)c | −0.10 (0.02)d | 0.02 (0.02) | −0.07 (0.03)e | 0.01 (0.02) | −0.01 (0.03) |
| E-selectin, ng/mLf | 1396 | 0.00 (0.01) | −0.01 (0.01) | −0.01 (0.01) | −0.03 (0.02) | −0.01 (0.01) | −0.02 (0.02) |
| sRAGE, pg/mLf | 689 | −0.02 (0.01) | 0.01 (0.01) | −0.03 (0.01) | −0.01 (0.02) | −0.02 (0.01) | −0.02 (0.02) |
Data are given as β values (SE), unless otherwise indicated, associated with a 30-min/d increase in SB or 15-min/d increase in MVPA; all models were adjusted for age, sex, Hispanic background, field center, immigrant generation, parental education level, annual family income, and diet quality; models of MPVA were additionally adjusted for accelerometer wear time.
Abbreviations: CVD, cardiovascular disease; DBP, diastolic blood pressure; LDL-C, low-density lipoprotein cholesterol; SBP, systolic blood pressure.
Model 2 contains SB and MVPA simultaneously.
Model 3 contains SB and MVPA simultaneously, while additionally adjusting for waist circumference and BMI percentile as mediators.
P < 0.0001.
P < 0.01.
P < 0.05.
Triglycerides, fasting insulin, HOMA-IR, hs-CRP, PAI-1, E-selectin, and sRAGE were modeled as log-transformed; therefore, β values approximately represent percentage changes.
Adjusted Means (95% CI) of Cardiometabolic Risk Factors Among US Hispanic/Latino Youth According to Tertiles of SB and MVPA
| Risk Factor | SB | P for Trend | MVPA | P for Trend | ||||
|---|---|---|---|---|---|---|---|---|
| Tertile 1 | Tertile 2 | Tertile 3 | Tertile 1 | Tertile 2 | Tertile 3 | |||
| LDL-C, mg/dL | 88.7 (85.1 to 92.4) | 86.0 (83.4 to 88.7) | 86.0 (82.9 to 89.1) | 0.309 | 86.8 (82.9 to 90.6) | 86.8 (83.8 to 89.7) | 87.1 (83.5 to 90.7) | 0.904 |
| HDL-C, mg/dL | 53.6 (51.8 to 55.3) | 52.1 (50.4 to 53.8) | 50.7 (49.1 to 52.4)a | 0.044 | 51.2 (49.4 to 53.0) | 51.8 (50.4 to 53.2) | 53.2 (51.3 to 55.1) | 0.198 |
| Triglycerides, mg/dLb | 71.5 (65.8 to 77.8) | 68.5 (63.4 to 74.0) | 67.5 (62.2 to 73.3) | 0.378 | 74.2 (68.5 to 80.4) | 68.2 (64.4 to 72.2) | 65.3 (61.2 to 69.7)a | 0.033 |
| SBP, percentile | 46.7 (42.5 to 50.9) | 42.5 (39.0 to 45.9) | 43.2 (39.2 to 47.2) | 0.300 | 44.1 (39.9 to 48.4) | 45.0 (41.8 to 48.2) | 43.1 (39.4 to 46.8) | 0.720 |
| DBP, percentile | 45.3 (41.8 to 48.9) | 43.0 (40.1 to 45.9) | 42.7 (39.3 to 46.2) | 0.342 | 44.4 (40.6 to 48.2) | 44.0 (41.1 to 46.9) | 42.7 (39.3 to 46.0) | 0.550 |
| Fasting glucose, mg/dL | 91.2 (90.2 to 92.1) | 91.8 (91.0 to 92.7) | 91.9 (90.9 to 92.8) | 0.373 | 91.4 (90.4 to 92.4) | 91.8 (91.0 to 92.5) | 91.7 (90.5 to 92.8) | 0.799 |
| Fasting insulin, mU/Lb | 70.1 (63.5 to 77.4) | 71.9 (65.4 to 79.0) | 77.2 (70.0 to 85.0) | 0.229 | 84.2 (76.7 to 92.4) | 73.3 (68.0 to 79.0)a | 63.6 (57.9 to 69.9)c | 0.001 |
| HOMA-IRb | 2.6 (2.4 to 2.9) | 2.7 (2.5 to 3.0) | 2.9 (2.6 to 3.2) | 0.206 | 3.2 (2.9 to 3.5) | 2.8 (2.6 to 3.0)a | 2.4 (2.2 to 2.6)c | 0.001 |
| HbA1c, % | 5.3 (5.2 to 5.3) | 5.3 (5.2 to 5.3) | 5.3 (5.2 to 5.3) | 0.866 | 5.3 (5.2 to 5.3) | 5.3 (5.2 to 5.3) | 5.2 (5.2 to 5.3) | 0.202 |
| hs-CRP, mg/Lb | 0.47 (0.39 to 0.57) | 0.43 (0.37 to 0.50) | 0.51 (0.42 to 0.62) | 0.620 | 0.57 (0.47 to 0.69) | 0.47 (0.40 to 0.55) | 0.39 (0.32 to 0.47)a | 0.013 |
| Adiponectin, ng/mL | 8.0 (7.4 to 8.6) | 7.9 (7.3 to 8.6) | 7.6 (6.9 to 8.3) | 0.506 | 7.2 (6.6 to 7.8) | 7.8 (7.2 to 8.3) | 8.6 (7.8 to 9.4)a | 0.025 |
| PAI-1, ng/mLb | 2.0 (1.8 to 2.3) | 2.1 (1.8 to 2.3) | 2.1 (1.9 to 2.4) | 0.540 | 2.3 (2.0 to 2.6) | 2.0 (1.8 to 2.3) | 1.9 (1.7 to 2.1) | 0.084 |
| E-selectin, ng/mLb | 44.4 (41.4 to 47.7) | 46.3 (44.0 to 48.6) | 46.0 (43.2 to 48.9) | 0.578 | 48.0 (45.0 to 51.3) | 46.4 (43.9 to 49.1) | 42.5 (39.7 to 45.5)a | 0.027 |
| sRAGE, pg/mLa | 541 (501 to 584) | 521 (489 to 555) | 478 (443 to 515)c | 0.038 | 502 (461 to 547) | 512 (482 to 544) | 523 (483 to 567) | 0.538 |
Data adjusted for age, sex, Hispanic background, field center, immigrant generation, parental education level, annual family income, and diet quality. Models of sedentary tertiles were additionally adjusted for MVPA; models of MVPA tertiles were additionally adjusted for SB (continuous) and accelerometer hours worn (continuous).
Pairwise comparison against tertile 1 significant at P < 0.05.
Dependent variable log-transformed before modeling; values are geometric means.
Pairwise comparison against tertile 1 significant at P < 0.001.
Association between MVPA and cardiometabolic biomarkers
After adjusting for sociodemographic characteristics, higher MVPA was associated with favorable levels of HDL-C, triglycerides, fasting insulin, HOMA-IR, hs-CRP, adiponectin, and PAI-1 (Table 2). The association of MVPA with log-transformed triglyceride levels (β for each 15-min/d increment, 0.039; SE, 0.018; P = 0.037), but not those with other markers, remained statistically significant after additional adjustment for SB, BMI, and waist circumference. Stepwise increases across MVPA tertiles for triglyceride levels (P for trend = 0.033), fasting insulin, and HOMA-IR (P for trend = 0.001), while adjusting for behaviors, confirmed results from linear models (Table 3). Tertile analyses also showed associations between MVPA and hs-CRP, adiponectin, and E-selectin levels (P for trend < 0.05 for all). However, these associations were attenuated and no longer statistically significant after adjustment for BMI percentile and waist circumference (data not shown).
Subgroup-specific associations
The interactions between MVPA and SB tertiles were not significant for any of the eight cardiometabolic biomarkers significantly associated with SB and/or MVPA in overall models (P for interaction > 0.10 for all; Fig. 1), which implies additive combined effects of MVPA and SB for these markers. The results of multivariable models containing terms for the interaction between continuous MVPA or SB and age, sex, household income, nativity status, obesity, field center, and Mexican background are presented in Supplemental Figs. 1 and 2 for SB and in Supplemental Figs. 3 and 4 for MVPA. In summary, the associations of SB and MVPA with cardiometabolic markers were generally consistent across subgroups. Nominally significant interactions were only observed between SB and age in predicting hs-CRP (P for interaction = 0.045), and between MVPA and national origin for HOMA-IR (P for interaction = 0.017) and fasting glucose concentration (P for interaction = 0.012), although this should be interpreted cautiously considering the large number of statistical tests.
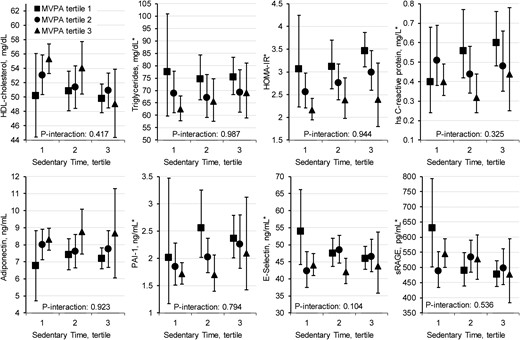
Least squares mean levels of cardiometabolic markers, by tertile of time spent in MVPA and SB. Models adjust for age, sex, Hispanic background, field center, immigrant generation, parental education level, annual family income, diet quality, and mean daily accelerometer wear time. P values for interaction test for heterogeneity in the effect of MVPA modeled as a continuous variable across tertiles of SB. *Log-transformed variables are modeled and geometric means are presented for levels of triglycerides, HOMA-IR, hs-CRP, PAI-1, E-selectin, and sRAGE.
Sensitivity analyses
Additional adjustment for pubertal development did not alter results of associations of SB and MVPA with cardiometabolic markers when those with incomplete pubertal status were excluded (Supplemental Table 2). In addition, analyses excluding those not adherent to the accelerometer protocol (data not shown) yielded similar results as compared with models in which incomplete values for covariates were multiply imputed.
Discussion
In this population-based study of US Hispanic/Latino youth, we found that those with higher levels of objectively measured MVPA had lower levels of triglycerides, fasting insulin, and HOMA-IR, and higher levels of HDL-C; SB was associated with these cardiometabolic biomarkers in the opposite direction. Consistent with findings of previous analyses (5, 26), in models in which both SB and MVPA were included simultaneously, most associations with these traditional risk factors remained significant for MVPA but not for SB.
A potentially important finding was that associations of SB with HDL-C level and sRAGE were independent of adiposity. In contrast to findings in most previous reports (5, 26), which were conducted in largely non-Hispanic white populations, we observed a robust inverse association between SB and HDL-C level, even after adjustment for MVPA, BMI, and waist circumference. In line with this finding, a previous study of 120 overweight or obese Australian children reported that accelerometer-measured SB was inversely associated with HDL-C level, independent of MVPA (27). Furthermore, a longitudinal study of 723 Danish children found that change in accelerometer-measured SB was associated with change in HDL-C level during a 200-day follow-up period (28). The association of SB with HDL-C level is supported by the potential mechanism that decreased skeletal muscle contractions from prolonged SB may suppress lipoprotein lipase activity, which plays a key role in regulation of HDL-C levels (29).
To our knowledge, this is the first report in youth of an association between SB and reduced levels of sRAGE. sRAGE is the serum isoform of the transmembrane receptor for advanced glycation end products, which, in response to binding advanced glycation end products, activates proinflammatory signaling cascades and contributes to diabetes pathology (30). Low sRAGE levels in adults have been correlated with impaired glycemic control (31), and predict future diabetes, coronary heart disease, and mortality (32).
This work extends associations with MVPA and SB to emerging risk factors for cardiometabolic health, including low-grade inflammation and concentrations of endothelial markers, which appear to play a prominent role in the development of type 2 diabetes and atherosclerosis (32–35). Observed associations with beneficial levels of PAI-1, hs-CRP, E-selectin, and adiponectin were, again, largely driven by MVPA, and they were attenuated and no longer significant after adjustment for adiposity. This finding is line with the proposed role of adipokines, inflammation, and endothelial function in the link between obesity and cardiovascular disease (36–38), and is supported by youth studies which reported reductions in PAI-1 and E-selectin after exercise training (39, 40). Of note, we observed an association with E-selectin, hs-CRP, and adiponectin across MVPA tertiles but not with continuous MVPA. This result suggests potential nonlinear associations with MVPA, though additional studies are needed.
The current study extends our prior work on SB, MVPA, and cardiometabolic risk factors in adults to youths in US Hispanic/Latino populations (4, 41). Unlike the independent relationships of MVPA and SB with several cardiometabolic makers in US Hispanic/Latino adults (4), the current findings suggest a greater influence of MVPA on cardiometabolic risk in youth and that the relationship is largely mediated by adiposity. The reasons for the discrepancy between adults and youth are unclear. Although children and adolescents in the present analysis and individuals in the HCHS/SOL adult study both spent ∼75% of total accelerometer wear time in SB, it should be noted that children and adolescents spent nearly 50% more time in MVPA than adults (35 min/d vs 24 min/d) (42). Deleterious effects of SB on cardiometabolic risk might be masked by the high MVPA levels in youth. The smaller sample size in the youth study, paired with a moderate to high correlation between MVPA and SB (r = −0.65) may have limited our ability to evaluate an effect of SB at different levels of MVPA. In addition, the effect of chronic SB may take its toll by slowly accumulating over time and, therefore, is less evident in youth compared with adults. This cumulative risk life-course model of SB on health is supported by a prospective study of Swedish adolescents, which showed that frequent television watching at multiple times between ages 16 and 30 years was more predictive of metabolic syndrome at age 43 years than the exposure at any one time (43).
Strengths of the current study include the large sample, which enabled estimation of independent effects of SB and MVPA on each biomarker measure while adjusting for an array of potential confounders; the multicenter population-based study design, allowing for recruitment from diverse populations; and assessment of multiple measures of cardiometabolic risk, including markers of subclinical chronic inflammation and endothelial function.
However, several limitations are noteworthy. First, the cross-sectional study design precludes inferring causality. Future longitudinal studies will be needed to clarify mediators of the beneficial effects of increasing MVPA and reducing SB. Second, adjustment was not made for multiple comparisons; therefore, some associations may be due to chance. Third, conventional proinflammatory markers such as IL-6 and TNF may have provided further insight into the relationship between activity levels and inflammation, but such markers were not measured in this study because of resource constraints. Fourth, activity measured by accelerometer captures only a snapshot in time that may not accurately reflect usual behaviors in all participants. Because accelerometer-derived time spent in SB is highly correlated with wear time, we used a previously reported residual approach (4) to standardize SB to the population mean wear time of 13.6 h/d. However, the results might be biased if SB while wearing the device were different from that while the device was not worn. Despite these limitations, measurement error in accelerometry was most likely nonselective with respect to cardiometabolic markers and would generally be expected to attenuate rather than exaggerate observed associations.
In conclusion, we found among a diverse sample of Hispanic/Latino children and adolescents that higher levels of SB and lower levels of MVPA were associated with adverse levels of cardiometabolic risk factors. Several of these associations, namely the associations of MVPA with triglyceride levels and of SB with HDL-C and sRAGE were independent of adiposity measures. These findings suggest that physiological precursors of diabetes and cardiovascular disease present in childhood and adolescence may be influenced by activity levels. US Hispanic/Latino populations bear a disproportionate burden of childhood obesity and related metabolic disorders (6); our findings suggest that increasing physical activity and reducing SB may be useful strategies to improve cardiometabolic health in this segment of the population.
Abbreviations:
- BMI
body mass index
- HCHS/SOL
Hispanic Community Health Study/Study of Latinos
- HDL-C
high-density lipoprotein–cholesterol
- HOMA-IR
homeostasis model assessment of insulin resistance
- hs-CRP
high-sensitivity C-reactive protein
- MVPA
time spent in moderate-to-vigorous physical activity
- PAI-1
plasminogen activator inhibitor-1
- SB
time spent in sedentary behavior
- sRAGE
soluble receptor for advanced glycation end products
Acknowledgments
Financial Support: The Hispanic Community Health Study/Study of Latino Youth was supported by the National Heart, Lung, and Blood Institute (NHLBI; Grant R01HL102130 to C.R.I.). Youth participants are drawn from the Hispanic Community Health Study/Study of Latinos, which was supported by contracts from the NHLBI to the University of North Carolina (Grant N01-HC65233), University of Miami (Grant N01-HC65234), Albert Einstein College of Medicine (Grant N01-HC65235), Northwestern University (Grant N01-HC65236), and San Diego State University (Grant N01-HC65237). The following contribute to this study through a transfer of funds to NHLBI: National Center on Minority Health and Health Disparities, the National Institute of Deafness and Other Communications Disorders, the National Institute of Dental and Craniofacial Research, the National Institute of Diabetes and Digestive and Kidney Diseases, the National Institute of Neurologic Disorders and Stroke, and the Office of Dietary Supplements. Additional support was provided by the Life Course Methodology Core of the New York Regional Center for Diabetes Translation Research (Grant DK111022- 8786 to C.R.I.). Q.Q. is supported by a Scientist Development Award (Award K01HL129892) from the NHLBI.
Disclosure Summary: The authors have nothing to disclose.
References
Division of Nutrition, Physical Activity, and Obesity, National Center for Chronic Disease Prevention and Health Promotion, Centers for Disease Control and Prevention. A SAS program for the 2000 CDC growth charts (ages 0 to <20 years). Available at: www.cdc.gov/nccdphp/dnpao/growthcharts/resources/sas.htm. Accessed 26 February 2016.
