


Abstract
Type 2 diabetes presents at a lower body mass index (BMI) in Chinese individuals than in white individuals. We sought to determine the role of subcutaneous adipose tissue (SCAT)–intrinsic factors, vs BMI or adiposity per se, in the vulnerability of Chinese individuals to obesity-associated impairment of insulin sensitivity.
Thirty-two Chinese and 30 white men and women from a cohort in the San Francisco Bay Area underwent anthropometric measurements, body composition (dual-energy X-ray absorptiometry) analyses, and measurement of fasting plasma glucose and insulin. Forty-eight also provided abdominal SCAT samples for transcriptional and biochemical analyses of tissue fibrosis.
BMI correlated with total body fat in white (r = 0.74, P < 0.001) but not Chinese individuals, whereas BMI correlated with visceral adipose tissue (VAT) accrual in both ethnicities (r = 0.88 and 0.81, respectively; P < 0.01). Insulin resistance (homeostatic model assessment of insulin resistance) worsened with VAT mass, but not total body fat, in Chinese subjects (r = 0.63, P < 0.01), whereas it worsened with both in white individuals. By contrast, SCAT mRNA levels of genes encoding profibrotic proteins rose remarkably along with both BMI and VAT mass in Chinese but not white subjects. Similarly, SCAT levels of hydroxyproline, an indicator of tissue collagen content that correlated with increasing VAT mass, were higher in Chinese vs white subjects, particularly in the setting of relative insulin resistance.
Our findings dissociate BMI from adiposity in Chinese individuals and instead highlight SCAT fibrosis as a process linked to visceral adiposity and insulin resistance in this group.
Accrual of body fat, estimated by body mass index (BMI), generally predicts the development of insulin resistance and type 2 diabetes (T2DM). Asian Americans are developing T2DM at alarming rates, and at relatively low BMI values (1, 2). Many organizations have thus lowered the BMI threshold for T2DM screening in Asians (3, 4). However, although this strategy increases T2DM screening among Asian Americans, it does not reveal what ethnically specific factors determine the relationship between BMI and T2DM.
Multiethnic studies have variously reported that Asians at a given BMI have 3% to 5% more body fat, more visceral fat, and larger waist circumferences than white individuals with the same BMI (5–7). However, although there are a few studies directly comparing BMI as a determinant of adiposity in white and Asian individuals (4, 8), none have examined the relationship between BMI, adiposity, and insulin sensitivity specifically in white and Chinese individuals living in the same geographic location. This is important, as Chinese individuals comprise rapidly growing segments of both world population and US populations.
Interestingly, adiposity increases preferentially in some depots over others across ethnic groups (9, 10). For Chinese individuals, this is characterized by the preferential development of visceral adiposity. As visceral obesity is linked to T2DM, it is thus important to understand what drives its accrual in Chinese individuals.
Obesity can also produce subcutaneous adipose tissue (SCAT) fibrosis in humans, and adipose-specific collagen accumulation correlates inversely with insulin sensitivity (12, 15–17). Premature upregulation of extracellular matrix components, including collagens and matrix metallopeptidases, could limit SCAT expansion and instead promote rigidity despite minimal obesity. Restricted adipocyte enlargement due to fibrosis might potentiate cellular stress and white adipose tissue (WAT) inflammation, promote ectopic lipid accumulation, and produce insulin resistance (16, 17). By contrast, avoiding premature fibrosis might lessen obesity-associated WAT dysfunction. To this end, it is intriguing that little is known about how SCAT fibrosis impacts depot-specific fat distribution or glucose homeostasis in Chinese vs white individuals.
Taking advantage of a unique cohort of age-matched white and Chinese American individuals from a single geographical area, with wide-ranging BMIs and divergent patterns of body fat distribution, and for which detailed imaging, blood and tissue sampling, and behavioral analyses were performed, we provide evidence indicating that whereas BMI is not an indicator of total adiposity in Chinese subjects, SCAT fibrosis in such individuals correlates not only with the development of visceral adiposity, but also remarkably with the loss of insulin sensitivity.
Materials and Methods
Subjects
White and Chinese subjects were part of a multiethnic clinical cohort, termed Inflammation, Diabetes, Ethnicity, and Obesity (IDEO), consisting of 25- to 65-year-old healthy men and women living in the San Francisco Bay Area and recruited from medical and surgical clinics at the University of California San Francisco (UCSF) and the Zuckerberg San Francisco General Hospital, or through local public advertisements.
The IDEO cohort excludes those taking anti-inflammatory medications, glucocorticoids, or other medications affecting inflammation and those with a history of heart failure, liver failure, renal dysfunction, autoimmune disorders, chronic inflammatory or infectious disease, cancer, or a known history of alcohol or drug abuse. Individuals are also excluded if they have smoked or were not weight stable (>3% change over 3 months). IDEO collects demographic, medical, medication, dietary, and lifestyle data from subjects using questionnaires.
White and Chinese subjects, lean and with obesity, were recruited for this study from IDEO based on World Health Organization cut points; white and Chinese individuals are considered lean at a BMI <24.9 kg/m2, white individuals are considered obese at a BMI >30 kg/m2, and Chinese individuals are considered obese at a self-reported BMI >27.5 kg/m2 (4, 18). Out of a total of 62 subjects, 32 Chinese individuals (14 lean and 18 with obesity) and 30 white individuals (14 lean and 16 with obesity) were included in this study. Thirteen subjects (seven white and six Chinese) had a diagnosis of diabetes (HbA1c >6.5% or a physician diagnosis plus diabetes medication use). Of these, three individuals (two white and one Chinese individuals) were taking insulin. All subjects consented to participate in the study, which was approved by the UCSF Institutional Review Board.
Anthropometric measurements
Height and weight were measured using a standard stadiometer and scale, with BMI (kg/m2) calculated from two averaged measurements.
Body composition
Body composition was estimated by dual-energy X-ray absorptiometry (DXA) using a Hologic Horizon/A scanner (3-minute whole-body scan, <0.1 G mGy) per manufacturer protocol. This device accurately measures individuals up to 450 lbs., and employs high-performance and “offset” scanning techniques on those whose bodies are wider than the table. Standard DXA readouts include total percentage body fat (%BF), fat mass, lean mass, and total body mass. A single technologist analyzed all DXA measurements using Hologic Apex software (13.6.0.4:3) following International Society for Clinical Densitometry guidelines, with precision error (1 SD) for total fat mass and %BF of approximately 0.3 kg and 1%, respectively (calibration using device-specific whole-body phantoms). Visceral adipose tissue (VAT) was measured in a 5-cm-wide region across the abdomen just above the iliac crest, coincident with the fourth lumbar vertebrae, to avoid interference from iliac crest bone pixels and matching the region commonly used to analyze VAT mass by CT scan (19). Determination of VAT mass by DXA has been validated by comparison with CT analysis as a reference standard in subjects with BMI between 18.5 and 40 kg/m2, with DXA-based VAT mass data showing a correlation coefficient of determination (r2) of 0.959 (women) and 0.949 (men) vs those obtained by CT (20).
Blood parameters
The UCSF Clinical Laboratory analyzed plasma glucose and insulin levels from subjects fasted overnight for 10 hours. Insulin resistance was estimated by the homeostatic model assessment of insulin resistance (HOMA-IR) index calculated from fasting glucose and insulin values (21–23). Subjects taking insulin (two white and one Chinese individuals) were excluded from HOMA-IR analyses.
Adipose tissue biopsies
Of the 62 IDEO members recruited into this study, 48 (26 Chinese and 22 white) were willing to provide SCAT samples. These were collected mostly by aspirational 14-g needle biopsy from an area ∼5 cm lateral to the umbilicus under 2% lidocaine anesthesia, but in some during bariatric or elective abdominal surgery. After removing visible connective tissue, blood, and clots, the SCAT was washed with Krebs-Ringer bicarbonate buffer in 1% BSA, and stored at −80°C.
Quantitative RT-PCR
Total RNA was extracted from ∼50 to 100 mg of whole SCAT (RNeasy Lipid Tissue Mini Kit; Qiagen, Valencia, CA), and RNA concentrations and integrity were assessed (NanoDrop 1000; Thermo Scientific, Wilmington, DE). One microgram of total RNA was reverse transcribed using the SensiFAST cDNA Synthesis Kit (Bioline Reagents Ltd, London, United Kingdom). Quantitative RT-PCR was performed in duplicate using Sybr Green amplification (Applied Biosystems by Life Science, Warrington, United Kingdom) and specific primers (Elim Biopharm, Hayward, CA). For each sample, mRNA levels of particular genes were always expressed as normalized values using the 2-ΔCT method (24, 25), with the mean comparative threshold count of both β-actin (ACTB) and Cyclophilin B (PPIB) serving as the internal reference controls in every case. Primer sequences are in Supplemental Table 1.
SCAT hydroxyproline levels
SCAT hydroxyproline (Hyp) levels were measured by modifying a standard protocol (26). Briefly, 50 to 100 mg of frozen SCAT was heated in 12 N HCl at 110°C overnight until dried. Aliquots of samples reconstituted in distilled water were added to 1.4% chloramine-T (Sigma-Aldrich, St. Louis, MO) in 10% isopropanol and 0.5 M sodium acetate at room temperature for exactly 20 minutes to convert free Hyps to pyrroles. Erlich’s solution was added and the samples were incubated at 65°C for 15 minutes to produce a chromophore indicative of Hyp abundance. Absorbance was read at 550 nm and concentrations determined against trans-4-hydroxy-l-proline standard curves (Sigma-Aldrich).
Statistical analyses
Data were analyzed using GraphPad Prism (version 7; GraphPad Software, Inc., San Diego, CA), and all data are presented as means ± SD. The Shapiro-Wilk test was used to verify normal distribution of quantitative variables. Outliers were determined using the ROUT method with an average false discovery rate of <1%. Student t test for independent observations was performed to compare differences between groups. Relationships between parameters were analyzed using Pearson or Spearman rho correlation, as appropriate. Significance was determined at P < 0.05.
Results
Participant characteristics
Table 1 summarizes key subject characteristics. There were no differences in the average waist circumference, total %BF, percent lean mass, or BMI of lean white vs Chinese individuals. White individuals with obesity, on the other hand, had expectedly greater average BMI (41.6 ± 7.3 vs 31.9 ± 5.3, P < 0.01), body weight (P < 0.01), waist circumference (P = 0.02), total body fat mass (P < 0.01), and %BF (P < 0.01) values than did Chinese subjects with obesity (Table 1).
Characteristics of Study Participants
| Characteristic | Lean | Obese | ||||
|---|---|---|---|---|---|---|
| White (n = 14) | Chinese (n = 14) | P Value | White (n = 16) | Chinese (n = 18) | P Value | |
| Age, y | 39 ± 14 | 47 ± 11 | ns | 50 ± 12 | 44 ± 11 | ns |
| Sex, female/male | 9/5 | 9/5 | 9/7 | 7/11 | ||
| BMI, kg/m2 | 22.2 ± 2.2 | 22.3 ± 1.8 | ns | 41.6 ± 7.3 | 31.9 ± 5.3 | <0.01 |
| Weight, kg | 65.0 ± 11.2 | 58.8 ± 9.8 | ns | 116.0 ± 24.3 | 87.9 ± 18.7 | <0.01 |
| WC, cm | 80.4 ± 8.6 | 82.7 ± 5.2 | ns | 123.5 ± 16.3 | 111.5 ± 15.3 | 0.02 |
| FM, kg | 19.0 ± 4.1 | 18.5 ± 3.5 | ns | 50.1 ± 12.6 | 34.2 ± 12.1 | <0.01 |
| FFM, kg | 43.0 ± 9.9 | 38.7 ± 9.3 | ns | 62.0 ± 15.0 | 52.2 ± 11.6 | <0.01 |
| %BF | 30.2 ± 6.2 | 31.9 ± 6.0 | ns | 42.8 ± 5.6 | 35.9 ± 9.3 | <0.01 |
| %LM | 66.5 ± 5.9 | 64.7 ± 6.2 | ns | 54.2 ± 4.6 | 62.7 ± 5.2 | 0.01 |
| VAT mass, kg | 0.25 ± 0.1 | 0.30 ± 0.2 | ns | 0.92 ± 0.3 | 0.69 ± 0.3 | ns |
| % VAT/FM | 1.3 ± 0.6 | 1.6 ± 0.7 | ns | 1.9 ± 0.7 | 2.1 ± 0.6 | ns |
| % VAT/weight | 0.4 ± 0.2 | 0.4 ± 0.3 | ns | 0.8 ± 0.3 | 0.7 ± 0.3 | ns |
| Insulin, mU/La | 5.9 ± 3.2 | 7.8 ± 3.2 | ns | 23.5 ± 13.2 | 21.0 ± 13.6 | ns |
| FPG, mg/dLa | 89.5 ± 6.4 | 100.5 ± 23.3 | ns | 117.1 ± 62.9 | 108.7 ± 25.1 | ns |
| HOMA-IRa | 1.3 ± 0.7 | 2.0 ± 1.0 | ns | 7.7 ± 7.9 | 6.6 ± 6.1 | ns |
HOMA-IR = fasting insulin (mIU/L) × [FPG (mg/dL)/405]. Values are presented as mean ± SD. Differences between groups were analyzed by Student t test (significance: P < 0.05).
Abbreviations: %LM, percentage lean mass; FFM, fat-free (lean) mass; FM, fat mass; ns, not significant; WC, waist circumference.
Subjects who were on insulin were excluded from the analysis (two white and one Chinese individuals).
Average fasting glucose, insulin, and HOMA-IR values were not different between ethnicities in either the lean or obese subgroups; however, for the obese subgroup, these similarities were interestingly present despite the fact that the Chinese subjects had a lower BMI than did the white subjects (Table 1).
Twenty-two white (10 lean and 12 with obesity) and 26 Chinese (11 lean and 15 with obesity) subjects from IDEO who met criteria for this study also consented to undergo a SCAT biopsy. Importantly, subjects undergoing biopsy mirrored the characteristics of the overall subject pool; there were no differences between the mean %BF, VAT mass, or HOMA-IR values of white and Chinese subjects undergoing SCAT biopsy, although white subjects undergoing SCAT biopsy had a higher BMI than Chinese counterparts (32.3 ± 10.4 for white and 27.3 ± 5.3 for Chinese individuals; P = 0.04) (Supplemental Table 2).
BMI does not mark adiposity in Chinese individuals
Rising BMI correlated strongly with %BF in white individuals analyzed in aggregate (r = 0.74, P < 0.001), consistent with the concept of BMI as a surrogate for adiposity (Fig. 1A) (27, 28). Strikingly, there was by contrast no such correlation for Chinese individuals (r = 0.35, P > 0.05), suggesting that BMI is not a reliable indicator of fat accrual in this group (Fig. 1B). Although some studies have suggested that a given BMI marks a higher %BF in Asian individuals than white individuals (5–7), our findings firmly validate other data highlighting poor diagnostic agreement between BMI- and %BF-based definitions for obesity in both Chinese men and women (29).
![BMI and total adiposity are differentially related in white and Chinese individuals. (A) Lean (BMI < 24.9; n = 14) and obese (BMI > 30; n = 16) white individuals, showing that BMI positively correlates with %BF measured by DXA (r = 0.74, P < 0.001). (B) Similar data for Chinese subjects, [BMI < 24.9 for the lean subgroup (n = 14), and BMI > 27.5 for the obese subgroup (n = 18)], showing a lack of correlation between BMI and %BF. (C and D) Increasing VAT mass (DXA), unlike %BF, correlates with increasing BMI in both white (C; r = 0.88) and Chinese (D; r = 0.81) subjects. Relationships in A to D were analyzed by Pearson correlation. Solid lines represent correlations through the data. (E to G) Sex-specific body composition comparisons in Chinese and white subjects with obesity (7 white men, 11 Chinese men, 9 white women, and 7 Chinese women), showing (E) lower BMI values for both Chinese men and women vs white counterparts [men: 32.9 ± 1.6 kg/m2 for Chinese individuals vs 40.6 ± 3.4 kg/m2 for white individuals (P = 0.04); women: 30.3 ± 5.8 kg/m2 for Chinese individuals vs 41.4 ± 2.1 kg/m2 for white individuals (P = 0.002)]; (F) similar degrees of visceral adiposity between Chinese men and women and sex-matched white individuals; and (G) a greater contribution of VAT to total body fat in Chinese men with obesity (2.1% ± 0.6%) vs white men with obesity (1.5% ± 0.3%; P = 0.04). Differences between groups were analyzed by Student t test. Statistically significant differences are indicated (*P < 0.05).](https://oup.silverchair-cdn.com/oup/backfile/Content_public/Journal/jcem/103/9/10.1210_jc.2017-02301/1/m_jc.2017-02301f1.jpeg?Expires=1750067169&Signature=m4L6UsBgHfd-50yGg2xpiU3UOMqLRc3YqgGqEPVQWwJ5NJGNiMJ4sjN38DmpUyTRytHkYhC9996VBUXru502dk~R7To8c0pNRDQ2DLZnoKFUaJQBy3VdFNwThKMhjn2hwLLg7tH2mCZvVK-chQqRZeoExpXChnoFbiyLjjrqaH2B4c1~gsz5QzG6gBU~bfFkr6i4YmflcyHUrpUvJBs-wwsEJbgxfWJdBdd2ZYHUvV47m9iiNgIeMt9ZPXCpLwQL4dZCp3~L16zeVBw9FvGWNkQwlXYH9VKb23TMC4bYQxNX~zsBKvxZIgiFyLwk2x5kDjeW3FJVVTMq1~uA2pkyeg__&Key-Pair-Id=APKAIE5G5CRDK6RD3PGA)
BMI and total adiposity are differentially related in white and Chinese individuals. (A) Lean (BMI < 24.9; n = 14) and obese (BMI > 30; n = 16) white individuals, showing that BMI positively correlates with %BF measured by DXA (r = 0.74, P < 0.001). (B) Similar data for Chinese subjects, [BMI < 24.9 for the lean subgroup (n = 14), and BMI > 27.5 for the obese subgroup (n = 18)], showing a lack of correlation between BMI and %BF. (C and D) Increasing VAT mass (DXA), unlike %BF, correlates with increasing BMI in both white (C; r = 0.88) and Chinese (D; r = 0.81) subjects. Relationships in A to D were analyzed by Pearson correlation. Solid lines represent correlations through the data. (E to G) Sex-specific body composition comparisons in Chinese and white subjects with obesity (7 white men, 11 Chinese men, 9 white women, and 7 Chinese women), showing (E) lower BMI values for both Chinese men and women vs white counterparts [men: 32.9 ± 1.6 kg/m2 for Chinese individuals vs 40.6 ± 3.4 kg/m2 for white individuals (P = 0.04); women: 30.3 ± 5.8 kg/m2 for Chinese individuals vs 41.4 ± 2.1 kg/m2 for white individuals (P = 0.002)]; (F) similar degrees of visceral adiposity between Chinese men and women and sex-matched white individuals; and (G) a greater contribution of VAT to total body fat in Chinese men with obesity (2.1% ± 0.6%) vs white men with obesity (1.5% ± 0.3%; P = 0.04). Differences between groups were analyzed by Student t test. Statistically significant differences are indicated (*P < 0.05).
Because both BMI and visceral adiposity are commonly tied to metabolic disease risk, and because of the known propensity of Chinese individuals to accumulate visceral fat, we also specifically examined the relationship between BMI and visceral adiposity in white and Chinese individuals from IDEO. We first noted that despite having lower BMI and total %BF values, Chinese subjects with obesity had VAT masses similar to those of white counterparts, both in absolute terms and as a percentage of total body fat (Table 1), indicative of preferential VAT accrual and in line with existing studies (9, 10).
Moreover, whereas BMI did not correlate with overall %BF in Chinese individuals, its ability to mark VAT mass transcended ethnicity, correlating well in both white (r = 0.88) and Chinese (r = 0.81) individuals (Fig. 1C and 1D). With this in mind, it is notable that despite having a lower BMI (Table 1; Fig. 1E), Chinese men and women with obesity had VAT masses comparable to those of more obese white counterparts (Fig. 1F and 1G). Indeed, VAT comprised a higher percentage of total body fat in Chinese men with obesity (2.1% ± 0.6%) than in white counterparts (1.5% ± 0.3%; P = 0.04) (Fig. 1G).
BMI, total adiposity, and VAT mass are differentially linked to insulin resistance in white and Chinese individuals
We next examined how %BF, BMI, and VAT mass, respectively, correlated with indicators of glycemic control in white and Chinese subjects. Three subjects with diabetes (two white and one Chinese subjects) were excluded from this analysis because they were taking insulin. Insulin sensitivity was assessed using HOMA-IR, an index correlating with indirect (e.g., Matsuda index) and direct (e.g., hyperinsulinemic euglycemic clamp) standards for insulin sensitivity (22, 23, 30). Whereas %BF correlated with both HOMA-IR (r = 0.42, P = 0.04) and fasting insulin levels in white subjects (Supplemental Fig. 1A), it did not do so in Chinese subjects (Supplemental Fig. 1B), indicating that total adiposity is differentially linked to insulin sensitivity in white vs Chinese individuals.
By contrast, rising BMI correlated with increasing HOMA-IR in both white (r = 0.71, P < 0.01) and Chinese (r = 0.64, P < 0.01) individuals (Supplemental Fig. 2). This finding indicates that BMI, despite its inability to accurately mark %BF in Chinese individuals, does encapsulate an aspect of body composition that is linked to insulin sensitivity in this group. A similar pattern was seen when analyzing the correlation between BMI and fasting insulin levels, supporting the concept that rising BMI drives hyperinsulinemia (Supplemental Fig. 2B).
Importantly, VAT mass also correlated with HOMA-IR and fasting insulin levels in both white and Chinese individuals (Supplemental Fig. 2C and 2D), mirroring the ethnicity-transcendent correlation we saw between VAT mass and BMI. This finding underscores the ability of BMI to specifically mark VAT mass and supports the concept that VAT accrual, in particular, promotes factors worsening glycemic control.
As it did for HOMA-IR, fasting plasma glucose (FPG) went up with rising BMI in both ethnic groups (Supplemental Fig. 3A). By contrast, rising VAT mass correlated with increasing FPG more so in Chinese individuals than in white individuals (Supplemental Fig. 3B), highlighting the potential for a specific link between visceral obesity and hyperglycemia in Chinese individuals. On the other hand, increasing %BF failed to correlate with rising FPG in either ethnic group (Supplemental Fig. 3C).
SCAT fibrosis is linked to visceral obesity in Chinese individuals
Prompted by the correlation we saw between rising VAT mass and insulin resistance, we examined SCAT samples from 48 of the white and Chinese subjects we analyzed previously to look for tissue-intrinsic markers associated with VAT accrual (see Supplemental Table 2 for their baseline characteristics). We first focused on WAT inflammation, which is seen in both rodent and human obesity (31–33). Indeed, elevations in BMI, %BF, and VAT mass were each associated with increased mRNA levels of multiple inflammatory genes in the SCAT of both white and Chinese subjects (Supplemental Table 3), indicating that WAT inflammation is an ethnicity-transcendent response to obesity, and supporting studies showing that such inflammation occurs not only in the VAT, but also the SCAT (34–37).
By contrast, examining profibrotic genes revealed a strong and consistent correlation between mRNA levels in the SCAT and increasing VAT mass specifically in Chinese, but not white, individuals (Fig. 2; Table 2). These genes included those encoding collagens type I (COL1A1), III (COL3A1), and VI (COL6A1), fibronectin (FN1), matrix metalloproteinase 2 (MMP2), tissue inhibitor of metalloproteinases 1 (TIMP1), hypoxia-inducible factor 1 α (HIF1A), and tissue inhibitor of metalloproteinases 2 (TIMP2). SCAT mRNA levels of profibrotic genes also rose along with BMI specifically in Chinese individuals (Table 2). On the other hand, increasing total %BF failed to consistently correlate with SCAT mRNA levels of profibrotic genes in either Chinese or white subjects (Table 2).
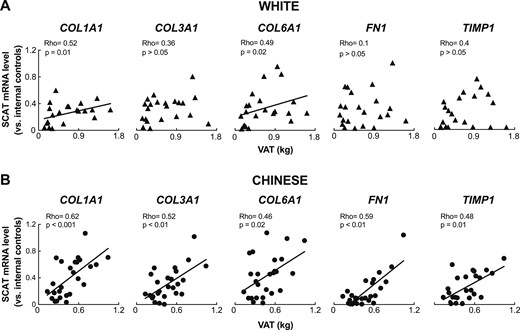
Profibrotic gene expression in the SCAT correlates with visceral fat accrual in Chinese but not white subjects. (A and B) Correlation between SCAT mRNA levels of COL1A1, COL3A1, COL6A1, FN1, and TIMP1, respectively, and VAT mass, showing a consistent positive correlation between markers of SCAT fibrosis and VAT accrual in Chinese (n = 26) but not white (n = 22) subjects. For each data point, mRNA levels are expressed relative to the mean of two internal control genes from the same sample. Solid lines represent correlations through the data.
Correlation Between the mRNA Levels of Profibrotic Genes in SCAT and Specific Clinical Parameters
| mRNA Levels of Profibrotic Genes | ||||||||
|---|---|---|---|---|---|---|---|---|
| Parameter | COL1A1 | COL3A1 | COL6A1 | MMP2 | FN1 | HIF1A | TIMP1 | TIMP2 |
| White | ||||||||
| BMI, kg/m2 | 0.36 | 0.36 | 0.43a | 0.46a | 0.04 | 0.07 | 0.38 | 0.21 |
| %BF | 0.29 | 0.29 | 0.36 (P = 0.07) | 0.35 (P = 0.06) | 0.16 | −0.21 | 0.30 | 0.23 |
| VAT mass, kg | 0.52a | 0.36 | 0.49a | 0.57b | 0.10 | −0.03 | 0.4 (P = 0.06) | 0.17 |
| FPG, mg/dLc | 0.26 | 0.27 | 0.36 | 0.14 | −0.12 | 0.1 | 0.18 | 0.32 |
| Insulin, mU/Lc | 0.46a | 0.29 | 0.49a | 0.19 | −0.15 | −0.2 | 0.72b | 0.19 |
| HOMA-IRc | 0.42 (P = 0.07) | 0.34 | 0.53b | 0.21 | −0.17 | 0.24 | 0.73b | 0.29 |
| Chinese | ||||||||
| BMI, kg/m2 | 0.50b | 0.42a | 0.22 | 0.61b | 0.35 (P = 0.06) | 0.04 | 0.48a | 0.36 (P = 0.07) |
| %BF | 0.36a | 0.21 | 0.11 | 0.26 | 0.23 | 0.01 | 0.10 | 0.17 |
| VAT mass, kg | 0.62b | 0.52b | 0.46a | 0.63b | 0.59b | 0.02 | 0.48a | 0.41a |
| FPG, mg/dLc | 0.35 | 0.36a | 0.41a | 0.18 | 0.22 | 0.06 | 0.01 | 0.05 |
| Insulin, mU/Lc | 0.54a | 0.49a | 0.46a | 0.43a | 0.46a | 0.19 | 0.42a | 0.22 |
| HOMA-IRc | 0.69b | 0.47a | 0.59b | 0.47a | 0.49a | 0.21 | 0.4 (P = 0.06) | 0.29 |
mRNA levels were measured by quantitative RT-PCR and normalized using the 2-ΔCT method, with both β-actin (ACTB) and cyclophilin B (CYCB) as endogenous controls. Relationships between parameters were analyzed by Spearman rho. HOMA IR = fasting insulin (mIU/L) × [fasting glucose (mg/dL)/405]. White (n = 22) and Chinese (n = 22) subjects.
P < 0.05.
P < 0.01.
Subjects who were on insulin were excluded from the analysis (two white and one Chinese subjects).
Although highly suggestive, the transcription of profibrotic genes may not always be mirrored by actual tissue fibrosis. By contrast, tissue collagen content increases with active fibrosis. Given this, we measured Hyp levels, which are indicative of tissue collagen content, in homogenates of the aspirated SCAT samples from all 48 subjects. We first confirmed that SCAT Hyp levels correlate positively with SCAT mRNA levels of COL1A1, which codes for the α 1 chain of type 1 collagen, in both Chinese and white subjects (Fig. 3A). Moreover, SCAT Hyp levels in both ethnic groups were increased by obesity (Fig. 3B), indicating, in agreement with prior studies (11–13, 38, 39), that obesity induces SCAT fibrosis. Remarkably, Hyp concentrations in the SCAT of Chinese individuals, excepting only individuals with severe obesity (BMI > 35) from analysis (six white and two Chinese subjects), were clearly higher than those in the SCAT of white individuals, indicating more SCAT fibrosis in Chinese individuals than white counterparts (Fig. 3C). Of note, this increase was eliminated by adding back those with severe obesity (data not shown), indicating that SCAT fibrosis in white individuals with severe obesity is sufficient to mask the difference between ethnic groups that was otherwise present when analyzing relatively leaner individuals. Moreover, SCAT Hyp levels were correlated with increasing VAT mass in both Chinese and white subjects (Fig. 3D). Taken together, these findings indicate that SCAT fibrosis is more pronounced in Chinese than in white individuals, and that it may act as a driver of visceral adiposity.

SCAT fibrosis is associated with visceral obesity in Chinese individuals. (A) SCAT Hyp levels correlate positively with SCAT mRNA levels of COL1A1, in both the 26 Chinese and 22 white subjects. (B) SCAT Hyp measurements showing that obesity promotes SCAT fibrosis in both Chinese (11 lean and 15 with obesity) and white (10 lean and 12 with obesity) subjects. (C) Higher Hyp concentrations in the SCAT of Chinese vs white individuals (excluding two Chinese and six white subjects with severe obesity; BMI > 35), indicating that Chinese individuals are relatively prone to developing SCAT fibrosis. (D) Correlation between SCAT Hyp levels, and VAT mass, showing a consistent positive correlation between Hyp levels and VAT accrual in white (n = 22) and Chinese (n = 26) individuals. *P < 0.05, **P < 0.01.
SCAT fibrosis is coupled to insulin resistance in Chinese individuals
Based on the correlation between obesity, in particular visceral obesity, and SCAT fibrosis, we also examined the impact of SCAT fibrosis on glucose homeostasis in both ethnic groups, excluding those taking insulin. Remarkably, SCAT mRNA levels of several profibrotic genes correlated with both HOMA-IR and fasting insulin levels in Chinese subjects, but much less consistently in white counterparts (Fig. 4A and 4B; Table 2). These findings suggest that the transcriptional network underlying SCAT fibrosis may mechanistically drive insulin resistance and the loss of glucose control more so in Chinese than white individuals. Directly assessing SCAT Hyp concentrations showed that the extent of SCAT fibrosis correlated with increasing HOMA-IR in both ethnic groups, although the slope of this relationship tended to be steeper in Chinese subjects (Fig. 4C). However, dividing subjects of each ethnicity into groups with “low” HOMA-IR vs relatively “high” HOMA-IR revealed that Chinese subjects with high HOMA-IR had markedly more SCAT fibrosis than did those with low HOMA-IR (Fig. 4D). By contrast, this difference was not significant for white subjects (Fig. 4D). These findings, seen using either of two different HOMA-IR cutoff values (1.9 and 3), support the concept that Chinese subjects with relative insulin resistance have more SCAT fibrosis than do matched white comparators.
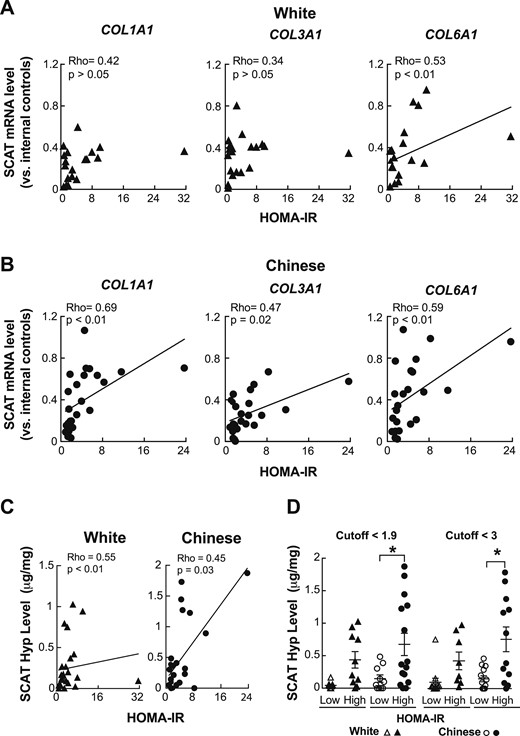
SCAT fibrosis correlates with rising HOMA-IR in Chinese subjects. (A and B) Plots comparing mRNA levels for several profibrotic genes (COL1A1, COL3A1, and COL6A1) in the SCAT with HOMA-IR, showing (A) an inconsistent correlation for white individuals and (B) a relatively consistent positive correlation for Chinese individuals. For each data point, mRNA levels are expressed relative to the mean of two internal control genes from the same sample. (C) Plots showing that increasing SCAT Hyp levels correlate with rising HOMA-IR in both white and Chinese subjects, although the slope of the relationship for white subjects tended to be steeper. *P < 0.05 (D) SCAT Hyp levels for white and Chinese individuals with “high” vs relatively “low” HOMA-IR values, showing that regardless of whether a HOMA-IR cutoff of 1.9 or 3 is used, insulin resistance in Chinese individuals is associated with greater SCAT fibrosis than it is for white counterparts. All analyses in A to D involved 25 Chinese and 20 white subjects, with 3 subjects (2 white and 1 Chinese) being excluded because they were taking insulin. Solid lines represent correlations through the data.
Discussion
Here we report that increased SCAT fibrosis is linked to the accrual of visceral fat in Chinese American men and women, a process that is coupled to the development of insulin resistance and hyperglycemia in this population. Our data support the emerging concept that WAT fibrosis is an important consequence of obesity and suggest that it may play a mechanistic role in obesity-related metabolic complications in Chinese individuals for whom BMI is not as clinically useful.
Current efforts are underway to lower the BMI threshold for screening Asian individuals for T2DM; however, although these may make some epidemiologic sense, their mechanistic rationale is less clear. Indeed, recent studies have scrutinized the utility of BMI to predict adiposity, insulin resistance, T2DM, and cardiometabolic risk, particularly across ethnic groups (3, 4, 40). Indeed, we show evidence that BMI is not a surrogate for total adiposity in Chinese American individuals, as it is in white individuals. Instead, our study indicates that at least for Chinese individuals, it may be better to replace BMI with a screening strategy more causally related to risk. As such, circulating biomarkers of SCAT fibrosis may be of clinical value in this and other Asian populations prone to visceral obesity.
By contrast, BMI specifically marked VAT accrual in a manner that transcends ethnicity. Indeed, increases in either BMI or VAT mass, but not total adiposity per se, correlated with reduced glycemic control in Chinese subjects. Thus, although understanding drivers of overall adiposity may be relevant to the pathogenesis of insulin resistance in some groups, identifying drivers of VAT accrual would likely provide greater insight in Chinese individuals. Our findings suggest that SCAT fibrosis is such a driver.
A prevailing hypothesis is that Asian populations commonly develop visceral obesity due to prevalent genetic variations that, when combined with dietary excess, sedentary behaviors, and aging, promote the preferential expansion of VAT (10). Our findings prompt an alternative concept: that certain ethnicities (e.g., Chinese) develop SCAT fibrosis in the context of obesity and that VAT expansion could be secondary to the limited expandability of fibrotic SCAT.
VAT may thus represent an “ectopic” fat storage site, engaged due to insufficient SCAT expandability in a manner reminiscent of fatty infiltration in the liver, heart, and skeletal muscle when WAT storage capacity is exceeded. This concept was recently supported by a large genomic analysis of individuals with metabolic syndrome, and others with a congenital lipodystrophy, showing that insulin resistance is coupled to genetic alterations limiting SCAT storage capacity, but not obesity per se (41). Our findings prompt interest in exploring the sequence and expression of genes involved in SCAT storage capacity in Chinese vs white individuals.
Prior work has shown that WAT fibrosis occurs in white individuals in the context of obesity. Consistent with these studies, we also saw increasing SCAT Hyp levels among white individuals in conjunction with obesity, although this relationship was not clearly seen by monitoring mRNA levels of profibrotic genes. Most studies of WAT fibrosis in white individuals have analyzed subjects with obesity great enough for bariatric surgery (11, 15, 36, 38, 42). Indeed, we found that subjects with severe obesity (BMI > 35) largely accounted for the SCAT fibrosis we saw in white individuals. Thus, WAT fibrosis in white individuals may be a function of severe obesity, tipping such individuals toward insulin resistance. On the other hand, when individuals with severe obesity were excluded from analysis, we saw that Chinese individuals had much more SCAT fibrosis than white counterparts, indicating that Chinese individuals develop SCAT fibrosis as an earlier manifestation of obesity, and at relatively low BMI values. This finding may shed light on why Chinese individuals may develop insulin resistance despite the absence of profound body weight gain.
Most studies probing WAT fibrosis in people have examined the VAT (11, 12, 17, 42). Our study differs from these in that all our analyses involved the SCAT. Indeed, it was because we focused specifically on the SCAT of relatively lean individuals that we were able to identify fibrosis as a factor that may be particularly relevant to insulin resistance in Chinese individuals.
Indeed, our findings also show a consistent relationship between SCAT fibrosis and insulin resistance, particularly among Chinese individuals in the context of obesity. Although rodent models have shown a strong mechanistic link between WAT fibrosis and metabolic dysfunction (14), prior human data have been more variable. Some studies support the concept that WAT fibrosis directly drives metabolic dysfunction (16, 17, 42, 43). For example, increases in collagen VI abundance and fibrotic tracts were correlated with insulin resistance in subjects with obesity (16).
Other studies question the role of WAT fibrosis in T2DM. However, these differ from our study in key ways. One found reduced VAT fibrosis in diabetic subjects with obesity vs nondiabetic subjects with obesity (38). However unlike ours, these studies focused on people undergoing bariatric surgery, many of whom already had T2DM, and did not include ethnic comparisons. Our study focused on the SCAT of relatively lean people with little contribution from individuals who had T2DM (none taking insulin). The consequences of WAT fibrosis in nondiabetic or prediabetic individuals may be different than in those with severe obesity or established T2DM.
Our study has a relatively small sample size, particularly for those undergoing SCAT biopsy. However, this sample size compares quite favorably with several others in which WAT samples were analyzed alongside plasma factors, anthropometric parameters, and imaging data (11, 17, 42–44). Moreover, our sample was relatively age matched. It also included men and women and both lean individuals and individuals with obesity in each group. Had we analyzed a larger group of individuals undergoing surgery, we could have analyzed both SCAT and VAT samples. However, this would have required more bariatric patients, and our results benefit from having largely avoided such subjects. Additionally, we took additional measures to increase the matching between groups by performing analyses in which individuals with extreme obesity were excluded, and by dividing each ethnic group into subgroups with relative insulin resistance vs relative insulin sensitivity, using two separate HOMA-IR cutoffs. These efforts strengthen the conclusions we were able to draw.
It remains unclear what factors induce SCAT fibrosis in Chinese individuals. Beyond WAT inflammation, future studies should assess ethnicity-specific differences in adipocyte differentiation, function, and progenitor subtypes. In addition, future studies should specifically measure adipocyte size across ethnic groups and fat depots, as WAT fibrosis might be expected to limit the ability of adipocytes to expand in the context of obesity. We also propose that probing functional and genomic differences in the WAT across a wider array of ethnicities than compared here may reveal even more markers of T2DM risk and reveal therapeutic approaches tailored to specific populations. However, our findings point to SCAT fibrosis as a key tissue-intrinsic marker of insulin resistance in individuals of Chinese ethnicity, and may apply to other Asian ethnicities as well.
Abbreviations:
- %BF
percentage body fat
- BMI
body mass index
- COL1A1
collagen type I
- COL3A1
collagen type III
- COL6A1
collagen type VI
- DXA
dual-energy X-ray absorptiometry
- FN1
fibronectin
- FPG
fasting plasma glucose
- HIF1A
hypoxia-inducible factor 1 α
- HOMA-IR
homeostatic model assessment of insulin resistance
- Hyp
hydroxyproline
- IDEO
Inflammation, Diabetes, Ethnicity, and Obesity
- MMP2
matrix metalloproteinase 2
- SCAT
subcutaneous adipose tissue
- T2DM
type 2 diabetes
- TIMP1
tissue inhibitor of metalloproteinases 1
- TIMP2
tissue inhibitor of metalloproteinases 2
- UCSF
University of California San Francisco
- VAT
visceral adipose tissue
- WAT
white adipose tissue
Acknowledgments
We thank the IDEO subjects for their participation, Eliseo Barajas, Michael C. Luo, Mekhala Hoskote, Kalyani Magee, Lili Mohebbi, and Morgan H. Winchell for subject recruitment and follow-up, Grace Wei for data management, and Kiran Nagra, Geffen C. Treiman, and Chris Kim for technical assistance.
Financial Support: This study was supported by the National Institute of Diabetes and Digestive and Kidney Diseases [R01 DK103175 (to S.K.K.) and DK098722, DK063720, and 5T32 DK007418-35 (to D.L.A.)], the National Center for Advancing Translational Sciences (UCSF-CTSI Award UL1 TR001872), a University of California, San Francisco Department of Medicine Award for Excellence in Cohort Development (to S.K.K), the Wilsey Family Foundation (to D.L.A.), and the Joseph and Vera Long Foundation (to D.L.A.).
Author Contributions: D.L.A. recruited the IDEO subjects, collected the data, oversaw tissue and sample processing, performed all data and statistical analysis, generated initial figures, and wrote the original manuscript. J.A.F. assisted D.L.A. with recruitment, sample collection, and processing, qPCR, and data analysis. M.Y.C.L. facilitated patient recruitment and sample acquisition. A.L.S. provided critical advice on data and statistical analyses and contributed to the final manuscript. J.S. oversaw the acquisition and initial analysis of DXA data. S.K.K. conceived of the study, supervised its completion, provided critical guidance on all data interpretation, created the final figures and tables, and wrote the final manuscript.
Disclosure Summary: The authors have nothing to disclose.
