


Abstract
Type 2 diabetes mellitus (T2DM) is accompanied by an increased risk for coronary artery disease (CAD), but the overlapping metabolic disturbances preceding both diseases are insufficiently described.
We hypothesized that alterations in metabolism occur years before clinical manifestation of T2DM and CAD and that these alterations are reflected in the plasma metabolome. We thus aimed to identify plasma metabolites that predict future T2DM and CAD.
Through use of targeted liquid chromatography-mass spectrometry, 35 plasma metabolites (amino acid metabolites and acylcarnitines) were quantified in 1049 individuals without CAD and diabetes, drawn from a population sample of 5386 in the Malmö Preventive Project (mean age, 69.5 years; 31% women). The sample included 204 individuals who developed T2DM, 384 who developed CAD, and 496 who remained T2DM and CAD free during a mean follow-up of 6.1 years.
In total, 16 metabolites were significantly associated with risk for developing T2DM according to logistic regression models. Glutamate (OR, 1.96; P = 5.4e-12) was the most strongly associated metabolite, followed by increased levels of branched-chain amino acids. Incident CAD was predicted by three metabolites: glutamate (OR, 1.28; P = 6.6e-4), histidine (OR, 0.76; P = 5.1e-4), and asparagine (OR, 0.80; P = 2.2e-3). Glutamate (OR, 1.48; P = 1.6e-8) and asparagine (OR, 0.75; P = 1.8e-5) were both associated with a composite endpoint of developing T2DM or CAD.
Several plasma metabolites were associated with incidence of T2DM and CAD; elevated glutamate and reduced asparagine levels were associated with both diseases. We thus discovered associations that might help shed additional light on why T2DM and CAD commonly co-occur.
Type 2 diabetes (T2DM) is a major risk factor for coronary artery disease (CAD), and the clustering of these two diseases is referred to as cardiometabolic disease (CMD). Whereas many other CAD risk factors, such as smoking and uncontrolled hypertension, have improved in parts of the world, diabetes continues to increase globally (1) and CAD remains the most common cause of death worldwide (2). T2DM and CAD share several risk factors, but the overlapping metabolic disturbances preceding both diseases are insufficiently described. Metabolomics has emerged as a powerful discipline in thoroughly mapping the metabolic alterations that precede CMD. Circulating levels of metabolites have been associated with the hallmarks of CMD, such as obesity, hyperglycemia, and insulin resistance (3–5).
Notably, branched-chain and aromatic amino acids (BCAA and AAA) predicted future diabetes in several prospective studies (6–8). Additionally, increased circulating levels of the BCAA isoleucine and two AAAs, phenylalanine (Phe) and tyrosine (Tyr), have been shown to predict future cardiovascular disease (9); a large multicohort study identified increased Phe and Tyr among the strongest predictors of future risk for cardiovascular disease (10).
That circulating BCAA and AAA predict future risk for both T2DM and cardiovascular disease might indicate that some of the pathophysiological overlap between the two diseases is reflected in the plasma metabolome. In that light, by defining comprehensive metabolite risk profiles for both CAD and T2DM, it could be possible to identify metabolites that are related to both diseases. Such metabolites could belong to pathways that contribute to CMD pathogenesis and could eventually be subjected to targeted intervention for preventing disease onset. Here we quantified 35 plasma metabolites, including amino acids, acylcarnitines, and intermediates in amino acid metabolism, by using a targeted liquid chromatography-mass spectrometry platform. We assessed the metabolites’ associations with incidence of T2DM and CAD in a Swedish population of 1049 individuals without CMD at baseline examination.
Methods
The Malmö Preventive Project is a population-based prospective cohort of 33,346 individuals enrolled between 1974 and 1992. Between 2002 and 2006, all participants who were alive were invited to a reexamination. There were no other exclusion criteria. In total, 18,240 individuals (age 65 to 80 years) were re-examined for cardiometabolic risk factors. Overnight fasting EDTA plasma samples were collected and stored at −80°C for later analyses. Among a random sample of 5386 individuals from the reexamination, 1406 were excluded because of history of T2DM, CAD, or stroke before enrollment in the reexamination study because of incomplete data on CAD risk factors or missing plasma samples. Of the remaining 3980 individuals, 384 developed CAD before December 31, 2013, with a mean follow-up time of 7.2 years, and 204 developed T2DM, with a mean follow-up time of 6.3 years. In total, 35 individuals developed both T2DM and CAD. Controls were defined as individuals who did not to develop CAD or T2DM during follow-up. Among 3361 individuals qualified as controls, a random sample of 496 individuals was included in the analyses because of the high analytical demand, resulting in a baseline study sample of 1049 individuals (Fig. 1). The ethics committee of Lund University approved the study protocols (EPN Lund 2009/633), and all participants provided written informed consent.
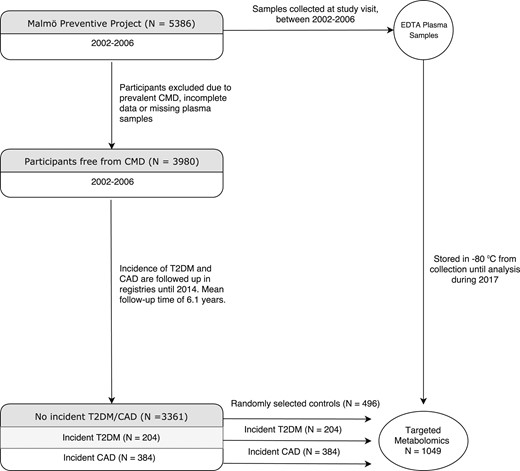
Flowchart of the participant selection from the Malmö Preventive Project.
Endpoint definitions and biochemical measurements
CAD was defined as coronary revascularization, fatal or nonfatal myocardial infarction, or death due to ischemic heart disease. The study participants were followed for incident CAD through record linkage using the Swedish personal identification number with the previously validated Swedish Hospital Discharge Register, the Swedish Cause of Death Register, and the Swedish Coronary Angiography and Angioplasty Registry (11). Myocardial infarction was defined on the basis of code 410 or I21 in the International Classification of Diseases, ninth revision or tenth revision, respectively. Coronary artery bypass surgery was identified from national Swedish classification systems of surgical procedures and defined as procedure codes 3065, 3066, 3068, 3080, 3092, 3105, 3127, or 3158 in the Op6 system or as procedure code FN in the KKÅ97 system. Percutaneous intervention was identified from Swedish Coronary Angiography and Angioplasty Registry. T2DM was defined as a fasting plasma glucose > 7.0 mmol/L, a history of physician diagnosis of T2DM, receiving antidiabetic medication, or having been registered in local or Swedish diabetes registries (12). CMD was defined as development of T2DM or CAD within the follow-up time of 6.1 years.
Cigarette smoking was elicited by a self-administered questionnaire, with current cigarette smoking defined as any use within the past year. Fasting total cholesterol, high-density lipoprotein (HDL) cholesterol, triglycerides, and glucose were measured according to standard procedures at the Department of Clinical Chemistry at Malmö University Hospital. Low-density lipoprotein (LDL) cholesterol was estimated with the Friedewald equation.
Analytical procedure
Plasma metabolites were profiled by using a UPLC-QTOF-MS System (1290 liquid chromatography, 6550 mass spectometry; Agilent Technologies, Santa Clara, CA) and has previously been described in detail (13). Briefly, EDTA plasma samples stored at −80 °C were thawed and extracted by addition of six volumes of extraction solution. The extraction solution consisted of 80:20 methanol/water containing stable isotope–labeled internal standards, purchased from Cambridge Isotope Laboratories (Andover, MA) and Toronto Research Chemicals (Toronto, ON). Detailed information about internal standards is found in Supplemental Table 1. Extracted samples were separated on an Acquity UPLC BEH Amide column (1.7 μm, 2.1 × 100 mm; Waters Corp., Milford, MA). One quality control sample was injected for every sixth analytical sample to monitor and estimate the analytical precision (Supplemental Table 2). More detailed information about the analytical procedures is available in Supplemental Material 1.
Statistical analyses
The correlations between baseline fasting levels of circulating metabolites and traditional risk factors were analyzed by using Spearman correlations because of skewed distribution of metabolite concentrations. For regression analyses, the metabolite data were log-transformed, mean-centered, and unit variance–scaled before analysis. Logistic regression models were used to analyze the associations between baseline metabolites and incident CAD, T2DM, and CMD. Initial analyses were adjusted for age, sex, and analysis batch. Additional adjustments for body mass index (BMI), fasting glucose, LDL cholesterol, HDL cholesterol, triglycerides, systolic blood pressure, antihypertensive treatment, and smoking status were performed for metabolites that were significantly associated with T2DM or CAD. Furthermore, we performed interquartile analyses for glutamate and asparagine. In initial analyses screening all 35 measured plasma metabolites against CMD risk factors and incidence of T2DM and CAD, associations were considered significant at a false-discovery rate–adjusted P value < 0.05. In secondary analyses that included only metabolites that had significant associations with CAD or T2DM, associations were considered significant at P < 0.05. All statistical analyses were performed by using R 3.3.0 software (R Project). Principal component (PC) analysis was performed on log-transformed and mean-centered levels of 35 metabolites by using R package ropls.
Results
Among the 3980 individuals in The Malmö Preventive Project that were free from T2DM and CAD at the time of examination, 384 developed CAD and 204 developed T2DM within the follow-up time. Among the remaining 3361 individuals, who remained free from prevalent or incident T2DM and CAD throughout follow-up, 496 were randomly chosen as controls. Baseline CMD risk factors did not differ between the randomly selected controls and the remaining eligible controls (Supplemental Table 3). The resulting study participants consisted of 1049 individuals without T2DM and CAD at examination (Fig. 1). The average age of the participants was 69.5 years, and 31% were female. The study participants' baseline characteristics are presented in Table 1. The plasma concentration of the 35 measured metabolites ranged from 0.04 µM (myristoylcarnitine) to 920 µM (glutamine) (Supplemental Table 2).
Baseline Characteristics of Participants in the Malmö Preventive Project (n = 1049)
| Trait | Controls (n = 496) | Participants With Incident T2DM (n = 204) | Participants With Incident CAD (n = 384) |
|---|---|---|---|
| Age, y | 68.7 ± 5.9 | 69.3 ± 5.7 | 70.6 ± 6.3 |
| Women, % | 37.2 | 31.4 | 21.3 |
| BMI, kg/m2 | 26.5 ± 4.2 | 29.2 ± 4.8 | 27.1 ± 4.1 |
| Fasting glucose, mmol/L | 5.4 ± 0.5 | 6.0 ± 0.6 | 5.5 ± 0.6 |
| Systolic blood pressure, mm Hg | 143.7 ± 20 | 149 ± 17 | 150 ± 21 |
| LDL cholesterol, mmol/L | 3.7 ± 0.9 | 3.7 ± 1.0 | 3.9 ± 1.1 |
| HDL cholesterol, mmol/L | 1.4 ± 0.4 | 1.3 ± 0.4 | 1.3 ± 0.4 |
| Triglycerides, mmol/L | 1.2 ± 0.6 | 1.3 ± 0.6 | 1.4 ± 0.7 |
| Antihypertensive treatment, % | 24.6 | 43.6 | 38.9 |
| Current smokers, % | 18.1 | 22.1 | 25.7 |
Plasma metabolomics was performed in 1049 individuals; 204 developed T2DM, 384 developed CAD, and 496 remained free from disease (controls). Table displays the average of traditional risk factors for CMD in the three groups. Values expressed with plus/minus sign are the mean ± SD.
First, the connections between the 35 measured metabolites and 8 traditional risk factors for CMD were investigated (Fig. 2). Strong correlations were seen between several amino acids and both fasting glucose levels, BMI, HDL cholesterol, and triglycerides, whereas the correlations between metabolite levels and LDL cholesterol and systolic blood pressure were lower. In total, 12 metabolites were also significantly correlated with receiving antihypertensive treatment. Generally, metabolite levels were lower in female participants, with 16 metabolites being significantly lower, whereas only 2 metabolites were significantly higher in female participants. Several amino acids, among them BCAAs, were inversely correlated with the participants’ baseline age.
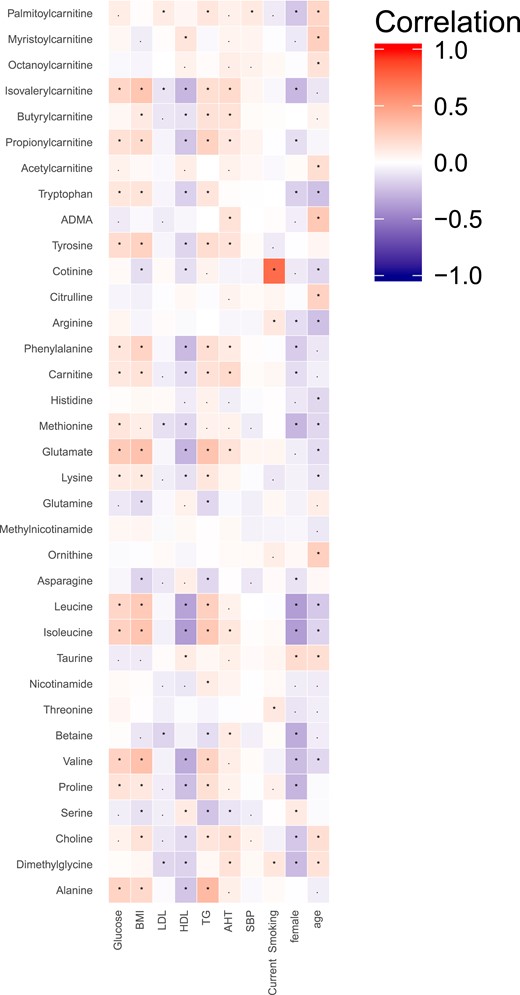
Correlations between plasma metabolite levels and risk factors for CMD. Correlations are Spearman correlations; statistical significance defined as follows: *P < 0.05, adjusted for false-discovery rate; ▪P < 0.05. Abbreviations: ADMA, asymmetric dimethylarginine; AHT, antihypertensive therapy; SBP, systolic blood pressure; TG, triglycerides.
To investigate whether levels of circulating metabolites could predict future T2DM and CAD, the baseline metabolite levels were compared between individuals developing T2DM or CAD within the follow-up time and the healthy controls. Incidence of T2DM was significantly predicted by 16 metabolites when adjusting models for age, sex, and analysis batch (Fig. 3) and applying a false discover rate–adjusted P value threshold of 0.05 (Supplemental Table 4). The metabolites most strongly associated with higher risk for incident T2DM included glutamate, BCAAs, AAAs, and short-chain acylcarnitines (SCACs). Asparagine, serine, and glutamine were the only metabolites significantly associated with lower risk for incident T2DM. Because the level of several metabolites differed between male and female participants, we investigated whether the associations with incident T2DM depended on the participants’ sex. The association with incident T2DM was stronger in males for glutamate (P interaction = 0.046), whereas the other metabolite associations were unaffected by sex.
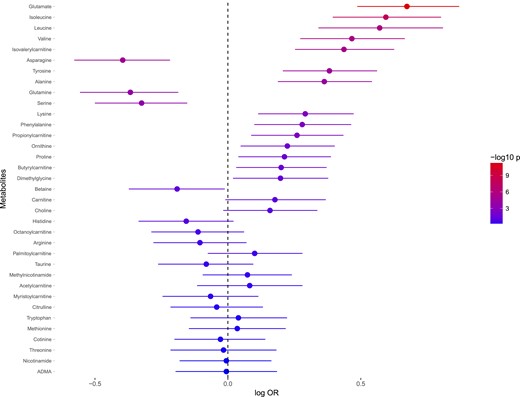
Associations between baseline levels of metabolites and incidence of T2DM. ORs are expressed as 10 log ORs per SD unit increase of metabolite. Error bars denote 95% SD of 10 log OR. P values are expressed as −10 log p. The regressions are adjusted for age and sex. Abbreviation: ADMA, asymmetric dimethylarginine.
Three metabolites associated with incident CAD in models adjusted for age, sex, and analysis batch (Fig. 4) and applying a false-discovery rate–adjusted P value threshold of 0.05 (Supplemental Table 4). Histidine was most strongly associated with incident CAD, followed by glutamate and asparagine. There were no significant interactions with sex. Exclusion of cases that developed CAD or T2DM within 2 years from the examination did not substantially influence the results (data not shown).
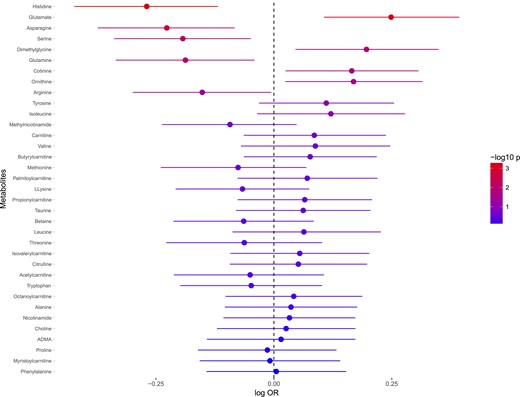
Associations between baseline levels of metabolites and incidence of CAD. ORs are expressed as 10 log OR per SD unit increase of metabolite. Error bars denote 95% SD of 10 log OR. P values are expressed as −10 log p. The regressions are adjusted for age and sex. Abbreviation: ADMA, asymmetric dimethylarginine.
In further analyses, we adjusted the logistic regression models on T2DM and CAD for CMD risk factors, BMI, fasting glucose, LDL cholesterol, HDL cholesterol, triglycerides, systolic blood pressure, antihypertensive treatment, and smoking status to evaluate whether the disease-associated metabolites were related to similar pathways as the traditional risk factors. The multivariable adjustments attenuated some of the metabolite associations, resulting in 7 of 16 metabolites remaining associated with incident T2DM (Table 2). Glutamate displayed the strongest association with incident T2DM in the multivariable-adjusted model (OR, 1.52; P = 1.2e-4). The multivariable adjustments attenuated the associations with incident CAD, but all three metabolites remained significantly associated (Table 2).
Metabolites Associated With T2DM or CAD in Logistic Regression Models Adjusted for Traditional Risk Factors
| Metabolite | T2DM | CAD | ||
|---|---|---|---|---|
| OR (95% CI) | P Value | OR (95% CI) | P Value | |
| Glutamate | 1.52 (1.23–1.89) | 1.2e-4 | 1.19 (1.01–1.39) | 0.034 |
| Isoleucine | 1.38 (1.08–1.76) | 0.010 | — | — |
| Glutamine | 0.77 (0.63–0.95) | 0.012 | — | — |
| Asparagine | 0.77 (0.63–0.95) | 0.013 | 0.83 (0.71–0.97) | 0.017 |
| Ornithine | 1.27 (1.04–1.56) | 0.022 | — | — |
| Leucine | 1.33 (1.02–1.73) | 0.034 | — | — |
| Lysine | 1.24 (1.00–1.53) | 0.047 | — | — |
| Serine | 0.82 (0.67–1.01) | 0.064 | — | — |
| Isovalerylcarnitine | 1.18 (0.95–1.47) | 0.13 | — | — |
| Tyr | 1.15 (0.93–1.42) | 0.20 | — | — |
| Valine | 1.12 (0.89–1.42) | 0.34 | — | — |
| Phe | 1.09 (0.88–1.35) | 0.43 | — | — |
| Alanine | 1.08 (0.87–1.34) | 0.48 | — | — |
| Butyrylcarnitine | 1.07 (0.88–1.31) | 0.49 | — | — |
| Propionylcarnitine | 1.07 (0.87–1.32) | 0.52 | — | — |
| Proline | 1.02 (0.83–1.26) | 0.82 | — | — |
| Histidine | — | — | 0.77 (0.66–0.90) | 1.1e-3 |
ORs are expressed as OR of developing T2DM or CAD per SD unit increase of metabolite. Logistic regressions on T2DM and CAD were adjusted for age, sex, batch, fasting glucose, BMI, LDL cholesterol, HDL cholesterol, triglycerides, systolic blood pressure, antihypertensive treatment, and smoking status.
PC analysis was performed on the 35 measured metabolites to identify covarying metabolite groups. Five orthogonal PCs were constructed, which described 50% of the metabolite variance. PC3 (8%) was associated with incidence of T2DM (OR, 1.42; P = 1.4e-10) and CAD (OR, 1.18; P = 2.4e-4) and correlated strongly with baseline BMI, fasting glucose, and HDL cholesterol (Supplemental Fig. 1). Glutamate and BCAA metabolites contributed positively to PC3, whereas glutamine and asparagine were the strongest negative contributors (Supplemental Fig. 2). PC1 (23%) and PC4 (5%) mainly reflected sex differences in metabolite levels; PC2 (10%) was strongly associated with the participants’ baseline age and PC5 (4%), with the participants’ smoking status (Supplemental Fig. 1).
Because glutamate and asparagine were associated with both CAD and T2DM, independently of each other (Supplemental Table 5) and contributed to a CAD and T2DM associated PC, we wanted to assess their ability to predict incidence of CMD. We therefore constructed a composite endpoint, CMD, defined as development of T2DM or CAD within the follow-up time. Increased levels of glutamate (OR, 1.48; 95% CI, 1.29 to 1.70; P = 1.55e-8) and decreased levels of asparagine (OR, 0.75; 95% CI, 0.65 to 0.85; P = 1.8e-5) associated with increased risk for incident CMD in logistic regression models, adjusted for age, sex, and batch. The associations remained significant after adjustment for all traditional risk factors for CMD (Supplemental Table 6). Participants in the top quartile of glutamate levels had a 100% increased odds of developing CMD and in the top quartile of asparagine levels was associated with a 42% lower odds of developing CMD.
Discussion
Our main finding was that circulating levels of glutamate and asparagine are associated with incidence of both CAD and T2DM. We found associations between plasma asparagine levels and lower risk for future CAD and T2DM. Additionally, we provide further evidence of a connection between BCAAs and T2DM. These findings might help shed additional light on why T2DM and CAD commonly co-occur.
Glutamate and asparagine are associated with future CAD and T2DM
The current study showed that glutamate and asparagine predicted incident T2DM and CAD. Previous studies found that glutamate is associated with several risk factors for CMD, including BMI, insulin resistance (3), and triglyceride levels (4). In line with our results, glutamate levels were shown to be associated with incident T2DM (7, 14) and CAD (15). Some in vitro studies have indicated that extracellular glutamate levels are toxic for pancreatic β cells (16). It has been suggested that accumulation of glutamate might promote increased levels of alanine, through increased transamination from pyruvate (17). This would indicate that the association between alanine and incident T2DM in our study is driven by increased glutamate levels. Circulating asparagine has been associated with decreased BMI, abdominal obesity, and insulin resistance (3, 4). Our study also confirmed the inverse association between asparagine and BMI but found no other associations with CMD risk factors. The literature provides no evidence of connections between asparagine levels and incident CAD and only sparse evidence of asparagine being involved in T2DM, such as lower levels of asparagine in diabetic rats (18). Our study showed that circulating levels of asparagine are associated with incidence of T2DM and CAD.
Glutamate and asparagine contributed in opposite directions to PC3, which was associated with incidence of both T2DM and CAD, indicating that clustering of low asparagine and high glutamate indicates high CMD risk. When simultaneously regressing asparagine and glutamate on incidence of CMD, we found that the metabolites are associated with CMD independently of each other, indicating that they could contribute to separate pathways underlying CMD.
Several factors could influence circulating levels of metabolites, including dietary intake, genetic variation, altered metabolic homeostasis, and the gut microbiome. One study used food-frequency questionnaires to compare plasma amino acid concentrations between different habitual diets. Neither glutamate nor asparagine levels significantly differed between meat eaters, fish eaters, vegetarians, and vegans. Also, the correlation between amino acid content in the diet and the corresponding circulating amino acid concentrations was evaluated. The glutamate content in the diet was not correlated with plasma glutamate levels, but unfortunately the asparagine intake could not be estimated (19). However, acute intake of monosodium glutamate, a common food additive, resulted in a sevenfold increase in plasma glutamate, and this was mirrored by increased insulin secretion (20). This indicates that the postprandial glutamate levels are modifiable by large intakes of dietary glutamate but that fasting levels, which represent glutamate homeostasis, may depend largely on other factors. We previously found that circulating glutamate levels were associated with several genera of gut microbiota (21), and a recent study found that the abundance of the glutamate fermenting bacteria Bacteroides thetaiotaomicron was lower in the gut of obese individuals and correlated to higher levels of circulating glutamate (22). Thus, the gut microbiota may be important in modulating the circulating levels of glutamate.
Asparagine is strongly influenced by genetic variants in the ASPG gene, encoding the enzyme asparaginase, that converts asparagine to aspartate (23). Asparaginase is a leukemia medication that reduces plasma asparagine levels to deplete malignant cells of asparagine. Interestingly, the adverse effects of asparaginase include hyperglycemia and impaired glucose tolerance (24). Thus, increased conversion of asparagine to aspartate, either through normal genetic variation in the ASPG gene or through addition of asparaginase, might lead to lower levels of circulating asparagine and development of hyperglycemia. This would point toward a potential causal connection between low plasma asparagine levels and prediabetes. However, our study found no association between asparagine levels and fasting glucose, meaning that the association with incident T2DM may be driven by impaired glucose tolerance or other mechanisms.
BCAAs and SCACs
Mirroring the strong cross-sectional relationship with CMD risk factors, increased BCAA levels were among the metabolites most strongly associated with incidence of T2DM. As mentioned, BCAAs have previously been associated with incident T2DM in several populations (6–8). Here, we extend these findings to an older population, with a relatively short time to disease. A recent Mendelian randomization study suggested that BCAAs are causally related to increased diabetes risk, showing that a genetic variant causes decreased BCAA catabolism. This resulted in an accumulation of BCAAs and branched-chain keto acids but unaltered levels of SCAC, which are downstream from the affected enzyme. As a reflection of this, the study showed that both BCAAs and branched-chain keto acids were associated with incident diabetes but found no associations for SCAC (25). Our study showed that increased plasma levels of two SCACs, propionylcarnitine and isovalerylcarnitine, were associated with incident T2DM, suggesting that additional pathways link BCAAs and their metabolites to diabetes, apart from decreased BCAA catabolism, that would result in increased levels of SCAC. Because BCAAs and SCAC were strongly correlated with overweight, hyperglycemia, and dyslipidemia, and because their associations with incident T2DM were markedly attenuated after adjustment for CMD risk factors, their association with incident T2DM is probably mediated by or confounded by one or several of these CMD risk factors.
Two previous studies have shown that BCAAs are associated with incidence of cardiovascular disease (9, 26). Our study found no significant association between baseline levels of BCAAs and future CAD. This inconsistency might be explained by differences between the study populations. The study by Magnusson et al. (9) was performed in a middle-aged population, whereas the average baseline age of our participants was 69.5 years. A population-based study of middle-aged and elderly individuals showed that circulating BCAAs are positively associated with fat-free mass index (27). Therefore, it is plausible that the significant decrease of all three BCAAs with age in our study could be due to age-related muscle loss and that this decrease might be a confounder in BCAA prediction of CAD. However, Ruiz-Canela et al. (26) showed that BCAAs predict incidence of CAD in a population with an average age similar to that in our study. This study was, on the other hand, performed in a population where the prevalence of T2DM was >50%, whereas our study participants were free from T2DM at baseline examination.
AAAs
The AAAs Phe and Tyr are among the metabolites with the strongest evidence for a connection with T2DM (6, 8). Our study showed that both Phe and Tyr were associated with incident T2DM but that the associations were attenuated after adjustment for CMD risk factors. The cross-sectional analyses also confirmed a strong correlation between the AAAs and fasting glucose, BMI, HDL cholesterol, and triglycerides. In our study we found no association between the AAAs and incidence of CAD, in contrast to a previous large multicohort study where Phe and Tyr were identified as the strongest metabolite predictors of incident coronary disease (10). The study also revealed an interaction between age and Phe on prediction of cardiovascular disease risk. Furthermore, although Phe was one of the strongest metabolite predictors of future cardiovascular disease in midlife, it was nonsignificant in the age group >65 years. In the cohort with the highest average age, the British Women’s Heart and Health Study, neither Phe nor Tyr was significantly associated with future cardiovascular events. This is consistent with our findings of no significant associations between AAAs and CAD in a population with an average age ∼70 years.
Other metabolites
Lysine and ornithine are two other metabolites that in our study were associated with incident T2DM independently of CMD risk factors. There is little prior evidence of lysine being involved in the development of diabetes. In contrast to our findings, lysine was shown to be lower in patients with T2DM than in healthy controls (28) and positively related to longevity (29). The urea cycle metabolite ornithine is increased in insulin-resistant individuals (5) and in patients with type 1 diabetes and T2DM (24) compared with healthy controls. Ornithine is also lowered in patients with T2DM treated with metformin compared with untreated individuals (30). Together with these previous findings, our results indicate that an increased urea cycle activity leading to increased ornithine levels may precede T2DM.
We found several other metabolites that were associated with incident T2DM; these associations were attenuated after adjustment for CMD risk factors. Among these, we found that T2DM is preceded by high levels of proline and butyrylcarnitine and low levels of glutamine and serine. These metabolites have previously been connected to risk factors for CMD (3–5), which was also confirmed by the cross-sectional analyses in our study. This indicates that these metabolites are involved in the development of T2DM through shared pathways as the traditional risk factors.
Histidine was the only measured metabolite associated with incident CAD but not with incident T2DM. Previously, histidine was shown to be associated with longevity, decreased all-cause mortality, decreased risk for incident cardiovascular disease (28), and decreased risk for incident T2DM (7). Our results reinforce the previous findings of histidine being involved in development of CAD.
Limitations
Our study has several limitations. Because of the study design, we can only report on associations between metabolites and CMD and therefore cannot prove causality. The nature of the targeted metabolomics approach allowed precise measurements, but this approach is limited to predefined targets.
Conclusions
We identified strong associations between circulating metabolite levels and incidence of T2DM and CAD. Increased levels of glutamate and decreased levels of asparagine were, independently of each other, associated with both T2DM and CAD. Additionally, we further strengthened the connection between increased BCAA levels and risk for T2DM while challenging their associations with incident CAD. Our study might help shed additional light on why T2DM and CAD commonly co-occur.
Abbreviations:
- AAA
aromatic amino acid
- BCAA
branched-chain amino acid
- BMI
body mass index
- CAD
coronary artery disease
- CMD
cardiometabolic disease
- HDL
high-density lipoprotein
- LDL
low-density lipoprotein
- PC
principal component
- Phe
phenylalanine
- SCAC
short-chain acylcarnitine
- T2DM
type 2 diabetes mellitus
- Tyr
tyrosine
Acknowledgments
The authors thank the participants in the Malmö Preventive Project for making this research possible.
Financial Support: O.M. was supported by the Knut and Alice Wallenberg Foundation, Göran Gustafsson Foundation, the Swedish Heart and Lung Foundation, the Swedish Research Council, the Novo Nordisk Foundation, Region Skåne, and Skåne University Hospital. C.F. was supported by the Albert Påhlsson Research Foundation, the Crafoord Research Foundation, the Ernhold Lundström Research Foundation, the Royal Physiographic Society of Lund and the Åke Wiberg Foundation. O.M. and C.F. additionally acknowledge support from the Swedish Foundation for Strategic Research for IRC15-0067.
Disclosure Summary: The authors have nothing to disclose.
References
International Diabetes Federation. IDF Diabetes Atlas. 7th ed. Available at: www.diabetesatlas.org. Accessed 12 January 2018.
World Health Organization. Cardiovascular disease. Available at: www.who.int/cardiovascular_diseases/en. Accessed 12 January 2018.
