


Abstract
Serum human chorionic gonadotropin (hCG) levels are essential for diagnosing and monitoring early pregnancy. Obesity is a health care epidemic; however, the performance of this vital serum hormone in women with an elevated body mass index (BMI) is unknown.
To investigate the association of BMI with serum hCG values and rate of hCG increase.
Retrospective cohort study.
University-based infertility clinic.
Women undergoing fresh vs frozen in vitro fertilization cycles with single-day three or five embryo transfers resulting in singleton live births (≥24 weeks’ gestational age) from 2008 to 2015.
None.
The initial hCG (mIU/mL, 16 days after oocyte retrieval) and 2-day percentage of hCG increases among BMI categories were compared using multivariable linear and logistic regression, adjusted a priori for the day of embryo transfer.
The initial serum hCG values correlated inversely with the BMI (P < 0.0001, test for trend). Low initial hCG values (<100 mIU/mL) were significantly more common across increasing BMI classes, from 1.4% of normal weight patients to 15.6% of those with a BMI ≥40 kg/m2 (P = 0.001, test for trend). The mean 2-day hCG increases were similar and normal (≥53%) across the BMI groups.
Patients with obesity achieving live births had statistically significantly lower initial serum hCG values compared with patients who were nonobese. However, the mean 2-day percentage of increases in hCG were similar across BMI categories. The initial hCG values might lack sensitivity for live births in patients with obesity. The rate of hCG increase remains the mainstay of monitoring very early pregnancies after in vitro fertilization. Future studies should investigate whether serum analyte ranges should be adjusted according to the BMI.
In patients undergoing in vitro fertilization (IVF), early serum human chorionic gonadotropin (hCG) levels are vital for diagnosing pregnancy and monitoring these early pregnancies at gestational ages for which ultrasonography will not be yet helpful (≤5 to 6 weeks of gestation) (1). Low initial hCG values, ranging from 20 to 150 mIU/mL, have been found to differentiate between viable and nonviable pregnancies (spontaneous abortions and ectopic pregnancies) with moderate sensitivity and specificity, although no absolute cutoff value for clinical use has been accepted (2–7). The rate of hCG increase at 2-day intervals has also been used to monitor early pregnancy prognosis. A minimum 2-day percentage of increase in hCG of 35% to 53% has been associated with ongoing pregnancy (8, 9). Among IVF pregnancies, the mean 2-day percentage of increase in hCG has been reported to be 124% (10). The inclusion criteria for studies have differed, however, and clinical variables such as the number of embryos transferred might affect hCG dynamics.
The identification of clinical factors influencing the hCG levels and trends is vital, because the hCG values guide clinical management and abnormal values could result in interventions that would disrupt an otherwise normally progressing pregnancy (e.g., methotrexate for a presumed ectopic pregnancy). Several clinical variables have been found to affect the hCG values. Studies have been conflicting on whether the day of embryo transfer (ET; day 3 or day 5) affects the initial hCG measurements (6, 11, 12). Previous studies were not limited to single ETs, and most patients had had two to three embryos transferred in all groups. The percentage of hCG increase at 2 days, although not the initial hCG levels, were more likely to be low in patients receiving multiple embryos (13). The initial hCG values have consistently been shown to be greater in those with a multiple pregnancy. In contrast, previous studies have not agreed on whether the initial hCG values will be similar or greater after a single frozen vs fresh ET (14–17). The hCG dynamics can also vary by race (18).
According to the World Health Organization, obesity is a worldwide epidemic; an estimated 650 million adults are obese, with serious associated comorbidities (19). In response, attention on the effect of the body mass index (BMI) on both assisted reproduction outcomes and serum analytes has been increasing. Several studies have shown that obesity is associated with lower live birth rates after IVF. A single study of 391 IVF cycles resulting in a live birth reported that the initial hCG levels were lower in women with a BMI >30 kg/m2, although a mean of three embryos was transferred and the hCG levels were measured 8 to 26 days after oocyte retrieval (10, 20).
To our knowledge, the present analysis is the first study to assess the effect of the BMI and, more specifically, obesity class on hCG levels and trends in women conceiving singletons after single ETs.
Materials and Methods
Patient population
The Partners Health Care institutional review board approved the present study. The medical records were reviewed for all women who had undergone fresh or frozen ET from October 2007 to September 2015 at our academic infertility practice. Autologous IVF or intracytoplasmic sperm injection cycles with transfer of a single day-3 or day-5 embryo were included if only a single gestational sac had been visualized on ultrasonography, followed by a singleton live birth at ≥24 weeks of gestation. Cycles using preimplantation genetic diagnosis and/or resulting in any ultrasound evidence of multiple pregnancy (more than one gestational sac) were excluded. Clinical and laboratory data were collected from a prospectively maintained departmental database. The key data points (including hCG values) were verified from the electronic medical record.
The patients were categorized by BMI class as underweight (<18.5 kg/m2), normal weight (18.5 to 24.9 kg/m2), overweight (25 to 29.9 kg/m2), obese class I (30 to 34.9 kg/m2), obese class II (35 to 39.9 kg/m2), and obese class III (>40 kg/m2) (21). Good quality cleavage-stage (day 3) embryos were defined as those having at least seven cells, fragmentation scores of 0 (0% fragmentation) or 1 (1% to 9% fragmentation), and symmetry scores of 1 (perfect symmetry) or 2 (moderate asymmetry) (22). Blastocysts (day 5 or 6 embryos) were graded using a modified version of the algorithm reported by Gardner and Schoolcraft (23) and Gardner et al. (24). Good quality blastocysts were defined as hatching or hatched blastocysts with fair or good quality inner cell mass and trophectoderm. The lowest quality embryos were those that were the least expanded, with fewer cells and less density or cohesion in the trophectoderm and inner cell masses (23). Patient race was categorized as white, African American/black, Asian, Hispanic, or other/declined to answer.
The stimulation protocols included downregulation protocols using GnRH agonists, those using GnRH antagonists, and poor responder protocols using estradiol priming or low-dose GnRH agonist flare (25–28). The day of ET and/or freezing was determined by clinical protocols that accounted for patient age, number of oocytes normally fertilized, and patient’s treatment history. Frozen cycles were supported with oral estradiol (3 mg twice daily), titrated to a serum level of 200 pg/mL If the serum levels were insufficient, estradiol administration was switched to vaginal (1 mg twice daily). Luteal support for fresh cycles was provided by daily applications of vaginal micronized progesterone gel (Crinone 8%; Actavis Pharma, Inc., Parsippany, NJ). Frozen cycles were supported with intramuscular progesterone in oil (50 mg daily), titrated to a serum level of ≥20 ng/mL, in accordance with the protocol at our center. Luteal support was continued to 10 weeks of gestation.
hCG value determinations
The analysis was limited to those patients whose first serum hCG was measured 14 to 18 days after oocyte retrieval or the equivalent for the frozen ET cycles (i.e., hCG levels were checked 9 to 13 days after blastocyst transfer or 11 to 15 days after cleavage-stage ET). Subsequent hCG values were checked at 2-day intervals whenever possible (range 2 to 7 days). According to policy, the serial hCG levels for each patient were measured at the same center.
The hCG measurements were performed at the clinical laboratories of two participating academic medical centers. Of all the samples, 79% were run at the first center and 21% at the second center. hCG was measured using an electrochemiluminescence immunoassay, run using the Cobas® e601 or e602 (Roche Diagnostics, Mannheim, Germany). Interassay and intra-assay coefficients of variation for the assay were <6% at both centers, and the results were standardized against the fourth International Standard for Chorionic Gonadotropin from the National Institute for Biological Standards and Control code 75/589 (29). The first laboratory has been accredited by the College of American Pathologists, and the second was inspected by the Joint Commission with Clinical Laboratory Improvement Amendments certification.
For the patients whose hCG levels were not checked exactly 2 days apart, the 2-day increase was calculated, using the log-linear nature of early hCG increases to ≤10 weeks of gestation (9). This method has been used in previous studies and has been confirmed in subanalyses of values measured exactly 2 days apart (30, 31). For this calculation, the difference between the log values of the first and second hCG measures was divided by the log of the first measure. This total percentage of increase in the log hCG was divided by the number of days between the first and second measure and multiplied by two. Exponentiation of this value yielded an estimated absolute value of hCG, from which the absolute 2-day percentage of increase was calculated. These calculated values were included in all present analyses.
For the patients whose hCG levels were not checked exactly 16 days after oocyte retrieval or the equivalent, the day-16 hCG value was calculated using the log-linear rate of hCG increase in early pregnancy (9). To limit the degree of extrapolation, the analyses were limited to those patients whose first hCG was measured 14 to 18 days after oocyte retrieval or the equivalent for the frozen ET cycles. The difference between the log of the first two hCG values was calculated, which was then divided by the number of days between them. The result was multiplied by the number of days from day 16 at which the first hCG value was collected. This value was then added (if the first hCG level had been checked after day 16) or subtracted (if the first hCG had been checked before day 16) to the log of the first available value, which was then exponentiated. A subanalysis was performed that was limited to patients with the serum hCG values checked on day 16 exactly. The calculated day-16 values were included in the analyses, unless otherwise noted. A subanalysis of hCG results from each of the two laboratories was also performed.
The proportion of patients with low initial hCG values, defined as values <100 mIU/mL, was also calculated. A low initial hCG value has been variably defined in reported studies. At our center, 100 mIU/mL is considered abnormal and will prompt an early viability scan (at 6 weeks, instead of at 7 to 8 weeks) owing to concerns for a possible ectopic pregnancy.
Statistical analysis
Generalized estimating equations were used to account for multiple cycles from a patient, as indicated. Multivariable adjustment logistic regression models were used for dichotomous variables to calculate the ORs and 95% CIs of a low initial hCG (<100 mIU/mL) and an abnormal hCG increase between the first and second and between the second and third measurements (using a binomial distribution and logit link function). Multivariable linear regression was used to assess differences in the mean hCG values and percentage of increase in hCG using robust “sandwich” standard errors.
The day of ET was included in the models a priori as a potential confounding variable, because day 5 ETs have been associated with greater subsequent serum hCG levels compared with day 3 ETs (11, 12). Covariates (e.g., embryo quality, race, infertility diagnosis, stimulation protocol, history of ectopic pregnancy, history of pregnancy loss, fresh vs frozen cycle, assisted hatching, intracytoplasmic sperm injection, patient age, gravidity, parity, day 3 FSH, estradiol, peak estradiol, endometrial stripe thickness (in mm) at trigger or frozen ET mapping, and number of good quality embryos transferred) were tested as predictors of a low initial hCG and an abnormal hCG increase and also as potential confounders of the relationship with abnormal hCG trends. The addition of these covariates separately to the base model did not change the effect estimates by >10% and were therefore not included in the final model (32). Therefore, only the day of ET was included in the final model, a priori.
Analyses were performed using Statistical Analysis Software, version 9.3 (SAS Institute, Inc., Cary, NC).
Results
Of the 14,505 IVF cycles from January 2008 to April 2015, all cycles with more than one embryo transferred and those with outcomes other than a singleton pregnancy resulting in a live birth were excluded. The remaining 831 cycles among 541 patients met the criteria for inclusion in the present study, with most cycles (63%) occurring after 2012. The demographic data and cycle characteristics, which were similar between groups, are listed in Table 1. Of these cycles, the serum hCG levels had been checked exactly 16 days after oocyte retrieval or the equivalent in frozen cycles in 248 (29.8%). The first two HCG levels were checked exactly 2 days apart for 724 patients (87%).
Demographic Data and Cycle Characteristics Among Patients With and Without Obesity Using IVF
| Characteristic | BMI <30 kg/m2 (n = 697) | BMI ≥30 kg/m2 (n = 134) |
|---|---|---|
| Oocyte age, y | ||
| Mean ± SD | 33.3 ± 3.3 | 34.4 ± 3.9 |
| Range | 21.8–43.9 | 20.7–41.6 |
| Age at ET, y | ||
| Mean ± SD | 33.7 ± 3.4 | 34.7 ± 4.0 |
| Range | 21.8–44.6 | 20.7–42.0 |
| Race | ||
| White | 477 (68.4) | 105 (78.4) |
| African American/black | 25 (3.6) | 7 (5.2) |
| Hispanic | 32 (4.6) | 6 (4.5) |
| Asian | 100 (14.4) | 10 (7.4) |
| Other/declined | 63 (9.0) | 6 (4.5) |
| Infertility diagnosis | ||
| Male factor | 228 (32.7) | 36 (26.9) |
| Decreased ovarian reserve | 46 (6.6) | 6 (4.5) |
| Anovulation/oligoovulation | 88 (12.6) | 21 (15.7) |
| Tubal | 34 (4.9) | 8 (6.0) |
| Unexplained | 170 (24.4) | 35 (26.1) |
| Other | 77 (11.0) | 14 (10.4) |
| Multiple | 54 (7.7) | 14 (10.4) |
| Gravidity | ||
| Mean ± SD | 0.92 ± 1.15 | 0.86 ± 1.45 |
| Range | 0–6.0 | 0–6.0 |
| Parity | ||
| Mean ± SD | 0.40 ± 0.63 | 0.25 ± 0.54 |
| Range | 0–3.0 | 0–3.0 |
| Day 3 FSH (mIU/mL) | ||
| Mean ± SD | 7.55 ± 3.18 | 6.61 ± 2.13 |
| Range | 1.60–29.0 | 2.40–11.50 |
| Mean peak E2 for fresh cycles | ||
| Mean ± SD | 1584.2 ± 1387.3 | 1485.7 ± 1757.7 |
| Range | 0–9484 | 0–11,771.0 |
| ICSI | 228 (32.7) | 49 (36.6) |
| Endometrial thickness at ET, mm | ||
| Mean ± SD | 10.49 ± 2.69 | 11.80 ± 2.91 |
| Range | 4.80–21.30 | 6.02–20.50 |
| D 3 ET | 321 (46.1) | 65 (48.5) |
| Use of assisted hatching (of d 3 ET) | 79 (24.6) | 23 (35.4) |
| Fresh cycle | 478 (68.6) | 86 (64.2) |
| Good quality embryo transferreda | 436 (62.6) | 69 (51.5) |
Data presented as mean ± SD and range (minimum to maximum) or n (%).
Abbreviations: E2, estradiol; ICSI, intracytoplasmic sperm injection
Good quality cleavage-stage (d 3) embryos had ≥7 cells, low fragmentation (<10%), and perfect or moderate symmetry; good quality d-5 or -6 embryos were hatching or hatched blastocysts with fair or good quality inner cell mass and trophectoderm.
The mean initial hCG values were significantly lower in the patients with obesity compared with patients who were nonobese receiving single embryos and delivering singletons [237.7 vs 408.1 mIU/mL, respectively; linear regression beta (i.e., mean difference between groups), −170.38; 95% CI, −199.61 to −141.16; Table 2]. When patients with obesity were further subdivided into obesity classes (class I to III), the mean initial serum hCG values correlated inversely with the BMI class, with a statistically significant difference (P-value test for trend, P < 0.0001; Fig. 1). This finding was consistent in the sensitivity analyses restricted to participants whose hCG values had been checked exactly 16 days after oocyte retrieval or the equivalent in the frozen ET cycles (n = 248; 251 vs 395 mIU/mL, respectively, linear regression beta, −143.0; 95% CI, −192.4 to −93.5). A subanalysis of the results from each laboratory separately confirmed these findings (data not shown).
Performance of hCG in Patients With Obesity
| Outcome | BMI <30 kg/m2 (referent; n = 697) | BMI ≥30 kg/m2 (n = 134) | Crude Estimatea | Adjusted Estimatea,b |
|---|---|---|---|---|
| First hCG, mIU/mL | −170.36 (−199.51 to −141.20) | −170.38 (−199.61 to −141.16) | ||
| Mean ± SD | 408.1 ± 254.4 | 237.7 ± 131.7 | ||
| Range | 19.0–1751.0 | 28.0–692.0 | ||
| Proportion of patients with hCG <100 mIU/mL | 19 (2.7) | 13 (9.7) | 3.83 (1.85 to 7.97) | 3.80 (1.82 to 7.94) |
| Mean % hCG increase in 2 d (first to second value) | −11.64 (−18.31 to −4.96) | −11.50 (−18.20 to −4.80) | ||
| Mean ± SD | 139.22 ± 42.65 | 127.60 ± 34.86 | ||
| Range | 28.42–319.60 | 41.79–243.68 | ||
| Proportion of patients with abnormal hCG increase (53%) | 7 (1.0) | 2 (1.5) | 1.50 (0.31 to 7.27) | 1.50 (0.31 to 7.29) |
Data presented as mean ± SD and range (minimum to maximum) or n (%), unless otherwise noted.
Mean values were compared using linear regression to generate linear regression β (95% CIs); proportions were compared using logistic regression to generate ORs (95% CIs).
Adjusted for d of ET.
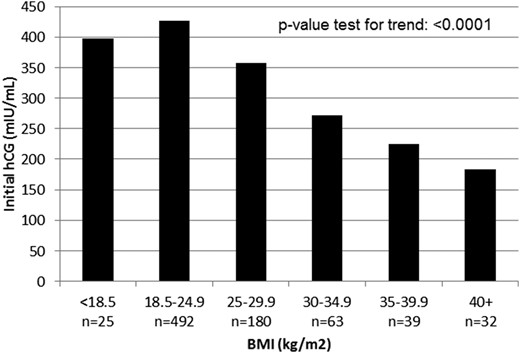
Mean initial hCG according to BMI. hCG was measured 16 days after oocyte retrieval or the equivalent in frozen ET cycles. Class I obesity, BMI 30 to 34.9 kg/m2; class II obesity, BMI 35 to 39.9 kg/m2; class III obesity, BMI >40 kg/m2.
Low initial hCG values (<100 mIU/mL) were statistically significantly more common in the patients with obesity than in the patients who were nonobese (9.7% vs 2.7%, respectively; OR, 3.80; 95% CI, 1.82 to 7.94; Table 2). This finding was consistently found in the sensitivity analyses restricted to patients whose hCG values had been measured exactly 16 days after oocyte retrieval or the equivalent in frozen ET cycles (n = 248; 10.8% vs 1.4%; OR, 8.15; 95% CI, 1.72 to 38.75).
The difference in the mean 2-day percentage of hCG increase was statistically significant between the patients with obesity and patients who were nonobese, although not considered clinically meaningful (128% vs 139%, respectively; Table 2). The differences in the mean 2-day hCG increase were not statistically significant when further analyzed across BMI categories (underweight through obesity class III; P-value test for trend, P = 0.18; Fig. 2). A similar, very low proportion of patients with and without obesity had inadequate hCG increases (<53%) at 2 days (1.0% and 1.5%, respectively; OR, 1.5; 95% CI, 0.31 to 7.29; Table 2).
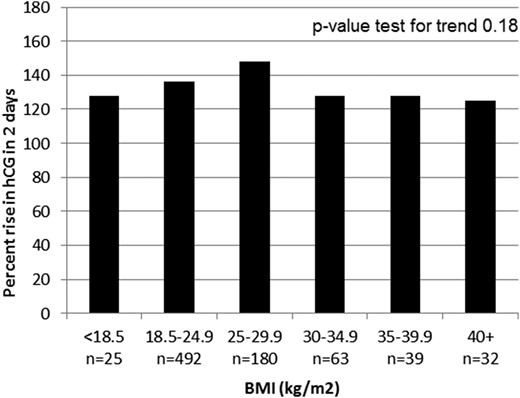
The mean 2-day percentage of increase in hCG according to BMI. Class I obesity, BMI 30 to 34.9 kg/m2; class II obesity: 35-39.9 kg/m2; class III obesity: > 40 kg/m2.
Discussion
Obesity is changing health care, and the field of reproductive endocrinology has responded appropriately by analyzing the performance and safety of tests and treatments in this patient population. To the best of our knowledge, the present study is the first to focus specifically on the effect of BMI on hCG, a pivotal laboratory test in the diagnosis and monitoring of early pregnancy after IVF.
In the present study, of the patients who achieved a singleton live birth, the patients with a greater BMI had a lower mean initial serum hCG level in a dose-dependent fashion. The proportion of patients with low initial serum hCG levels (defined as <100 mIU/mL at our center) was also greater among the patients who were obese, with a statistically significant difference. In contrast, the rate of hCG increase was well within normal limits and was stable among BMI classes. The incidence of low hCG increase (<53% in 2 days) was also similar (roughly 1%) across the BMI classes.
In the present study, although day of ET was included in the analyses a priori to be consistent with previous studies, the differences in the initial hCG values were not statistically significant among the cleavage-stage embryo and blastocyst transfers (365 vs 381 mIU/mL). Also, the use of fresh vs frozen ETs was not associated with the initial hCG values on multivariate analysis.
No hCG thresholds for the prediction of pregnancy outcomes have been accepted, in particular, because practices vary in the timing of hCG testing after ET. Regardless, low initial hCG values (although variably defined) can prompt additional monitoring and precautionary counseling, which add to the stress and expense of IVF treatment for patients. Although the present study was not designed to define an hCG cutoff that would be predictive of outcomes (because only those with live births were included), these results reiterate the inaccuracy of the initial hCG values in predicting the pregnancy outcomes.
The underlying cause of lower initial hCG values in women with obesity is not known but might result from dilution in the setting of obesity-related increased blood volume (33). Similarly, prostate-specific antigen levels have been noted to be significantly lower in men with obesity than in men with normal weight, which has been attributed to the increased blood volume with obesity (34). Given the effect of the BMI on this crucial blood test, future studies should explore whether the BMI affects the interpretation of other serum analytes.
We acknowledge the limitations of the present study. hCG values were obtained at two clinical laboratories, which could have introduced variability in the hCG values. Both laboratories met similar rigorous clinical standards, and a subanalysis of the results from each laboratory confirmed the overall clinical findings. Furthermore, the patients’ serial measurements were obtained at the same laboratory, allowing for a reliable assessment of the hCG trends. The present study only included single ETs that had resulted in singleton pregnancies and live births to exclude any clinical variables that could affect hCG results. The performance of hCG according to the BMI should be explored in other clinical scenarios, including the transfer of multiple embryos, multiple gestations, and outcomes other than a live birth. Finally, only IVF pregnancies were included in the present study. Thus, the generalizability of these findings to other modes of conception is unknown, although hCG has generally been shown to perform similarly, regardless of whether the pregnancies were conceived using IVF (8–10).
To our knowledge, the present study is the first to assess the performance of serum hCG in IVF pregnancies according to patient BMI and, more specifically, across obesity classes. We found that the mean initial serum hCG values were lower across the increasing BMI classes. The serum hCG levels were also more frequently critically low (defined as <100 mIU/mL 16 days after oocyte retrieval) in patients with obesity compared with those in patients who were nonobese. Because the mean 2-day percentage of increase in hCG was normal and similar across BMI classes, the rate of hCG increase remains the mainstay for monitoring early pregnancies, especially as the initial hCG values might lack sensitivity for live births in patients with obesity.
Abbreviations:
- BMI
body mass index
- ET
embryo transfer
- hCG
human chorionic gonadotropin
- IVF
in vitro fertilization
Acknowledgments
Disclosure Summary: The authors have nothing to disclose.
References
World Health Organization. Obesity and overweight. Available at: www.who.int/mediacentre/factsheets/fs311/en/. Updated February 2018. Accessed 18 April 2018.
Centers for Disease Control and Prevention. Defining Adult Overweight and Obesity. Available at: www.cdc.gov/obesity/adult/defining.html. Accessed 10 December 2017.
National Institute for Biological Standards and Control. WHO International Standard 4th IS Chorionic Gonadotropin, Human NIBSC code: 75/589. www.nibsc.org/documents/ifu/75-589.pdf. Accessed 20 May 2016.
